

Abstract
Measuring distances at molecular length scales in living systems is a significant challenge. Methods like FRET have limitations due to short detection distances and strict orientations. Recently, surface energy transfer (SET) has been used in bulk solutions; however, it cannot be applied to living systems. Here, we have developed an SET nanoruler, using aptamer-gold-nanoparticle conjugates with different diameters, to monitor the distance between binding sites of a receptor on living cells. The nanoruler can measure separation distances well beyond the detection limit of FRET. Thus, for the first time, we have developed an effective SET nanoruler for live cells with long distance, easy construction, fast detection and low background. This is also the first time that the distance between the aptamer and antibody binding sites in the membrane protein PTK7 was measured accurately. The SET nanoruler represents the next leap forward to monitor structural components within living cell membranes.
Keywords: Nanoruler, Surface Energy Transfer, Binding Site Distance, PTK7
INTRODUCTION
Application of optical molecular rulers to address questions in biochemistry, biodiagnostics, and bimolecular imaging allows routine measurement of molecular and dynamic distance changes. Up to now, such measurements have typically been addressed by optical methods based on Förster Resonance Energy Transfer (FRET) 1-4 between molecular donors and acceptors. However, the nature of the dipole–dipole mechanism effectively constrains the length scales in FRET-based methods to distances on the order of <10 nm (R0 ≈ 6 nm).5-7 Optical methods that do not alter biomolecular function, but which enable investigation of both long-range static and dynamic distances, would therefore facilitate the study of many multicomponent complexes that are presently difficult to measure.
Recently developed localized surface plasmon resonance (LSPR) sensors have been able to meet these requirements 8-10. Liu et. al. 8 have constructed a nanoplasmonic molecular ruler, in which double-stranded DNA (dsDNA) is attached to a gold nanoparticle (NP), for measuring nuclease activity and DNA footprinting. While this plasmonic ruler performs very well in bulk solution experiments and show a longer detection range than FRET, significant challenges exist when applied to cellular systems because of the high Raman scattering background coming from the cells themselves. This high background significantly reduces the signal-to-background ratio of the plasmonic sensor and greatly hinders molecular distance measurements when applied on the cell surface. 90° light scattering of gold nanoparticles has been used by Bene et. al.11 to measure the distances of receptors on the cell surface. However, light scattering system normally requires the dye and the particle surface to locate in close proximity (<10nm) in order to have the scattering occurred; in longer distance range, fluorescence quenching effect will be the dominant factor in the interactions.11 In addition, it was reported that light scattering effect only dominates in smaller sized nanoparticles (<2nm) due to the insufficient overlap for fluorescence energy transfer. In contrast, particles with greater than a 2nm diameter have higher probability and incidence of fluorescence quenching.12 Therefore, there’s a great limitation on the choice of nanoparticle sizes for the ruler constructions. All these restrictions make the detection of interactions between large complexes on live cells extremely difficult. Therefore, alternative methods are needed for constructing molecular rulers with a still larger detection range for these cellular systems.
One such option involves fluorescence measurements which have wide applications in cellular systems as well as in vivo systems. Recently, several groups 13-21 have reported the nanoparticle surface energy transfer (SET) where energy transfer flows from a donor molecule to a nanoparticle surface at a much slower decay rate than the dipole–dipole energy transfer in FRET, with a 1/d4 distance dependence.13 While SET is similar to FRET, in that the interaction is dipole-dipole in nature, it is geometrically different from FRET because an acceptor nanoparticle has a surface and an isotropic distribution of dipole vectors to accept energy from the donor, leading to a dipole-surface resonance mechanism.14-17 This arrangement effectively breaks the inherent detection barriers of FRET, thereby increasing the probability of energy transfer and ultimately enhancing the efficiency of SET over FRET. The intensity quenching mechanism via coupling of the oscillating electronic dipole of a dye to a metal surface with loss of energy was developed by Chance, Prock and Silbey,5 and by Persson and Lang6 for bulk metals. Aside from bulk systems, recent attempts have conjugated different lengths of linkers onto the metal nanoparticle surface, thus demonstrating the validity of this “SET nanoruler” for mapping distance in a real biological system13-19. In most of these systems, the SET rulers were built by using a linker (e.g., RNA15, 18, 19 or DNA13, 16, 17) to bring the dye donors to the surface of gold nanoparticles for energy transfer. By having the interactions with the targets (e.g., ions15, 18, complimentary DNA16 or RNA19), the linker changed conformations which resulted in a different distance between the dye donor and the gold nanoparticle, thus leading to a different energy transfer efficiency. Other cases used direct conjugation or absorption to bring the donors (BSA20 or rhodamine 6G21) to close proximity of the gold nanoparticle and observe the energy transfer efficiency changes via changing the confirmations of BSA20. However, all these systems required to use the gold nanoparticles as both carriers and energy acceptors to construct the whole SET rulers (donor-linker-acceptor) onto the surface of the gold nanoparticles. This limits the application ranges of using SET interactions to study molecular interactions, as the rulers are restrained to the systems which are required to have conformational changes in their linkers via condition changes. Therefore, if the donor and the acceptor in the SET ruler can be brought separated onto two independent moieties of interest, without the use of linkers, the application ranges of constructing an SET ruler to study molecular interactions can be largely increased. Moreover, all these systems were describing the applications of SET for distance measurements in bulk systems. No single application so far is to apply these SET models to the cellular systems.
To overcome these limitations and construct a practical SET nanoruler for measuring distances on live cells, we are the first to propose to 1) use aptamer-gold nanoparticle conjugates to construct a “SET nanoruler” in a range of different sizes and, 2) for the first time, apply it to the surface of a live cell to monitor the distance between two binding sites on a membrane receptor. Specifically, by taking advantage of the fixed binding site distance on a receptor, we use different ligands to bring the organic fluorophore and the metal nanoparticles into close proximity of fixed length. Moreover, by varying the size of particles, the distance from the dye molecule to the metal particle surface can be manipulated. In this way, we are able to obtain the distance between the two binding sites on the live cell membrane. An added advantage is the easy and straightforward preparation of the aptamer-nanoparticle conjugates by direct incubation of the components.
EXPERIMENTAL METHODS
Preparation of gold nanoparticles of different sizes
Various sizes of gold NPs were synthesized according to the method developed by Frens22. Gold NPs were adopted in the system because of the simplicity and reproducibility of the synthetic and bioconjugation techniques, as well as their unique fluorescence quenching property. Briefly, 0.5 ml of 1% chloroauric acid (Sigma-Aldrich, St. Louis, MO) was added to 50 ml of double-distilled water, and the solution was heated to boiling. Next, different amounts of 1% sodium citrate (Riedel-deHaën, Seelze, Germany) were added to the solution to synthesize different sizes of gold NPs. The solution was refluxed until a color change from dark blue to red was observed. The sizes and absorption spectra of various gold NPs were verified with the Hitachi H-7100 transmission electron microscope (Tokyo, Japan) and the Cary 100 UV-Vis spectrophotometer (Varian, Palo Alto, CA). (Figure 1 and Supporting Information Figure S1) The concentration of gold NPs in each aliquot was also determined by UV-Vis spectroscopic measurements via the Beer’s law (A = εbc). The 5.4nm gold NPs were purchased from Sigma-Aldrich (St. Louis, MO). Characteristic parameters for the preparation and characterization of different sets of gold NPs are summarized in Supporting Information Table S1.
Figure 1.

TEM images of different sizes of gold nanoparticles. The average diameter of NPs for each size was determined by measuring the size of 100 particles from the TEM images. The red title in each box indicated the mean diameter.
Aptamer Synthesis
All DNA oligomers were synthesized on an ABI3400 DNA/RNA synthesizer (Applied Biosystems, Foster City, CA) in our laboratory. All DNA oligonuclease bases and 5′-modifiers were purchased from Glen Research, Sterling, VA. The aptamer sgc8 was labeled with various 5′-modifiers. A DNA library containing a randomized sequence of 41 nucleotides was labeled with a 5′-FITC, -TAMAR or -Cy5 modifier and used as a control for each detection channel. Sequence TDO5, a control aptamer for CEM cells23, 24, was labeled with 5′-Thiol-Modifier [DMTO(CH2)6-S-S-(CH2)6-OP(N(iPr2))(O(CH2)2CN)] or 5′-Amino-Modifier [MMT-NH-(CH2)6-OP(N(iPr2))(OCNEt)] for particle conjugations. For the deprotection procedures, sequences labeled with 5′-TAMAR-Modifier were deprotected in TAMRA deprotection solution (0.05M potassium carbonate in methanol) at 65°C for 3-4 hours. Sequences labeled with 5′-Cy5-Modifier were deprotected in ammonium hydroxide at room temperature for 24-36 hours. Sequences labeled with 5′-Amino-Modifier were deprotected in ammonium hydroxide at 40°C for 17 hours. All other sequences were deprotected in AMA (ammonium hydroxide/40% aqueous methylamine 1:1) at 65°C for 20 minutes. After deprotection, all sequences were further purified by reverse phase HPLC (ProStar, Varian, Walnut Creek, CA) on a C-18 column. A Cary Bio-300 UV spectrometer (Varian, Walnut Creek, CA) was used to measure absorbance to quantify the manufactured sequences. DNA sequences with different labeling are summarized in Supporting Information Table S2.
Preparation of aptamer-functionalized gold nanoparticles
The strategy for functionalizing gold nanoparticles with thiol-modified oligonucleotides followed a published procedure22. The thiolyated aptamers (sgc8 or TDO5) were added to gold NP stock solutions for surface modification. The amount of aptamer needed for the different gold nanoparticle sizes (50 mL) was calculated from estimations of the surface area for each gold NP to ensure saturated surface coverage, as listed in Supporting Information Table S3. After 12 h, 2.5 ml 10× Phosphate Buffered Saline (PBS) (pH 7.4, Fisher Scientific, Pittsburgh, PA) was added to the reaction mixture. After an additional 12 h, another 2.5 mL 10× PBS solution (pH 7.4) was added to make a final concentration of 1× PBS solution (pH 7.4 ± 0.1) with 11.9 mM PO43−, 137mM NaCl and 2.7 mM KCl. The reaction mixture was then allowed to react for 12 h. Unbound oligonucleotides were subsequently removed by centrifugation and resuspension of the pellet (14,000 rpm, twice). DNA-coated gold NPs were resuspended, and the concentrations were determined by measuring the absorptions using a Cary Bio-300 UV spectrometer (Varian, Walnut Creek, CA). Condensed to a concentration of 10 nM, the DNA-gold NP conjugates were stored in a 1× PBS solution (pH 7.4 ± 0.1, 11.9 mM PO43−, 137mM NaCl and 2.7 mM KCl).
Preparation of aptamer-functionalized silica nanoparticles
3-Aminopropyl(3-oxobutanoic acid)-functionalized silica NPs (~15 nm (DLS), 2.5 % (w/v) in DMF) were purchased from Sigma-Aldrich (St. Louis, MO) and used as the control NPs for fluorescence quenching experiments. The particles were first washed with double-distilled water three times (centrifuge rate: 14,000 rpm) to remove dimethylformamide (DMF) solvent and resuspended in DI water to a final concentration of 200 nM. Before DNA conjugation, the carboxylic acid groups of silica NPs were activated with 1-ethyl-3-(3-dimethylaminopropyl) carbodiimide (EDC) and N-Hydroxysuccinimide (NHS) by adding 1.0 ml of carboxylic acid-functionalized silica NPs to 2.0 mL of 1× PBS buffer (pH 7.4) containing 6.5 mg of EDC and 5.8 mg of NHS. After 1.0 h of stirring at 25 °C, the particles were centrifuged and redispersed in 1× PBS buffer (pH 7.4) to give the NHS ester-terminated silica NPs. Excess amino-labeled aptamers (5′-NH2-sgc8 and 5′-NH2-TDO5) (200 μl, 1 mM) were added and incubated with the silica NPs under gentle shaking overnight at 4 °C. (Aptamer:NP = 1:1000 molar ratio) The conjugates were washed three times with PBS buffer and finally reconstituted in binding buffer and stored at 4°C until use.
Antibody labeling
The pure anti-PTK7 (100 mg/L) was purchased from Miltenyi Biotec, Inc. (Auburn, CA). Before dye conjugation, the antibody was concentrated 10× to 1 mg/mL using a 30 KDa cut-off membrane (Fisher Scientific, Pittsburgh, PA) and centrifuged at 12,000 rpm. The Alexa Fluor® 488 Monoclonal Antibody Labeling Kit was purchased from Invitrogen (Carlsbad, CA). The Alexa-488 reactive dye has a tetrafluorophenyl (TFP) ester moiety that reacts efficiently with primary amines on the anti-PTK7 to form a stable dye-protein conjugate. The antibody was labeled with an Alexa-488 reactive dye in a sodium bicarbonate buffer (pH 8.3) for 1 hour at room temperature. Dye-labeled anti-PTK7 was separated from the unlabeled anti-PTK7 using a spin column (1100 g, 5 min) with a 30,000 MW size-exclusion purification resin in PBS (pH 7.2, plus 2 mM sodium azide). After centrifugation, the labeled anti-PTK7 was collected in the collection tube in approximately 100 μL of PBS (pH 7.2), with 2 mM sodium azide; free dye remained in the column bed. The concentration and degree of labeling were determined using the formulas given in the protocol. The conjugates were stored at 4 °C, protected from light. For the isotype-negative control antibody, the FITC-labeled Mouse IgG2a was purchased directly from Miltenyi Biotec, Inc. (Auburn, CA) and also stored at 4 °C, protected from light.
Cell culture
CCRF-CEM (CCL-119, T cell line, human ALL) and Ramos (CRL-1596, B cell line, human Burkitt’s lymphoma) were obtained from American Type Culture Collection. Both cell types were cultured in RPMI 1640 medium (American Type Culture Collection), with 10% fetal bovine serum (Invitrogen, Carlsbad, CA) and 0.5 mg/ml Penicillin-Streptomycin (American Type Culture Collection, Manassas, VA) at 37°C under a 5% CO2 atmosphere. Cells were washed before and after incubation with wash buffer [4.5 g/L glucose and 5 mM MgCl2 in Dulbecco’s PBS with calcium chloride and magnesium chloride (Sigma-Aldrich, St. Louis, MO)]. Binding buffer used for selection was prepared by adding yeast tRNA (0.1 mg/ml; Sigma-Aldrich, St. Louis, MO) and BSA (1 mg/ml; Fisher Scientific, Pittsburgh, PA) to wash buffer to reduce background binding.
Flow Cytometric Analysis
Saturation concentration of Alexa488-labeled anti-PTK7 (200 nM) was incubated with CCRF-CEM cells (1 × 10⁶) at 4°C to prevent receptor internalizations24 for 20 min in the dark in a 200-μL volume of binding buffer containing 20% FBS. Cells were then washed once with 700 μL of the binding buffer, then incubated with saturation concentrations of different sizes of gold NPs (5.4nm: 8nM; 10.1nM-42.2nm: 4nM) or with 4nM 15nm silica NP aptamer conjugates for another 20 min. Then cells were washed twice with 0.1% sodium azide, suspended in 200 μL of binding buffer with 0.1% sodium azide, and subjected to flow cytometric analysis within 15 min. The fluorescence was determined with a FACScan cytometer (BD Immunocytometry Systems) by counting 10,000 events. A green laser at 488nm with different excitation voltages (650V, 700V, 750V) was used as the excitation source. The FITC-labeled isotype Mouse IgG2a antibody was used as a negative control to determine nonspecific binding. The cell fluorescence background was determined from samples with cells only as the fluorescence background for later calculations.
Confocal Imaging Analysis
For confocal imaging, treatment steps for fluorescence quenching experiments were the same as described in Flow Cytometric Analysis. 30 μL of cell suspension bound with Alexa488-anti-PTK7 and aptamer-gold NP conjugates was dropped on a thin glass slide placed above a 20× objective on the confocal microscope and then covered with a coverslip. Imaging of the cells was performed on an Olympus FV500-IX81 confocal microscope. A 5-mW, 488-nm Argon laser was the excitation source for the Alexa Fluor 488 dyes throughout the fluorescence quenching experiments. The objective used for imaging was a XLUMPLFL20XW ×20 water-immersion objective with a numerical aperture of 0.95 (Olympus).
RESULTS AND DISCUSSION
Membrane Receptor PTK7 as the Target Protein for Binding Site Measurements
The cell membrane receptor Protein Tyrosine Kinase 7 (PTK7 or CCK-4), an important biomarker receptor for T-cell acute lymphoblastic leukemia (T-ALL) 25, 26, was chosen as the target molecule for construction of the “SET nanoruler”. Monoclonal antibody anti-PTK7 and aptamer sgc8 have been identified as the molecular ligands for the two binding sites on PTK7 respectively26. The specific interactions of protein receptor PTK7 with these two ligands were confirmed by PTK7 gene silencing27 and gene transfection experiments26. The interactions between the two ligands in the receptor PTK7 were first evaluated by competition studies to validate the colocalization. Previous research26, 28, 29 has indicated that if two ligands are binding to the same binding site on a receptor, by using 100× non-labeled ligands, it was able to replace the labeled ligand on the receptor. Meanwhile, a fluorescence decrease on the receptors was observed. This is a way to prove the binding specificity of a ligand to the receptor binding site. However, if two ligands are binding to two different independent binding site on a receptor, the binding of one ligand (e.g. aptamer) to its own binding site does not affect the binding of the other ligand (e.g. antibody) to its binding site. Therefore, no fluorescence decrease and no competition were observed from the competition studies between these two ligands.
Competition studies between the two ligands were conducted and monitored using Flow Cytometer. Excess unlabeled sgc8 (100×) was used to compete with Alexa488-labeled anti-PTK7 (200 nM) for CEM cell binding (Figure 2A). To further investigate the possibility of co-binding of sgc8 and the antibody on PTK7, a contrasting experiment was conducted by first labeling the aptamer with a FITC fluorophore and incubating with CEM cells. Afterwards, excess non-labeled anti-PTK7 (100×) was added to compete with the aptamer binding (Figure 2B). Flow cytometry results showed no obvious change in the Alexa488-anti-PTK7 binding, indicating that the aptamer sgc8 and the antibody anti-PTK7 simultaneously bind to two different sites of the extracellular domain of PTK7. This colocalization phenomenon served as the basis for choosing protein receptor PTK7 as the ideal model system to construct a molecular ruler to measure the two binding sites on the cell surface.
Figure 2.

Competition studies between aptamer sgc8 and antibody anti-PTK7 on receptor PTK7. (A) Flow Cytometry assay to monitor the fluorescence intensities from the Alexa488-labeled anti-PTK7 in the presence and absence of 100X non-labeled sgc8. The red curve indicates the fluorescence intensity from cell membrane with saturated concentrations of Alexa488-labeled anti-PTK7 (200 nM) in the absence of non-labeled sgc8. The blue curve shows the fluorescence shift in the presence of 100× non-labeled sgc8. The black curve marks the fluorescence background with cells only, and the green curve shows the binding of control antibody FITC-labeled isotype Mouse IgG2a. (B) Flow Cytometry assay to monitor the fluorescence intensities from the FITC-labeled sgc8 in the presence and absence of 100X non-labeled anti-PTK7. The red curve indicates the fluorescence intensity from cell membrane with saturated concentrations of FITC-sgc8 (200 nM) in the absence of non-labeled anti-PTK7. The blue curve shows the fluorescence shift in the presence of 100× non-labeled anti-PTK7. The black curve marks the fluorescence background with cells only, and the green curve shows the binding of control antibody FITC-labeled isotype Mouse IgG2a. FL1: fluorescence channel 1 in Flow Cytometer at 520 nm. FITC: fluorescein isothiocyanate.
Using FRET for Binding Site Distance Measurements
Since FRET has been proven as a powerful tool to study molecular interactions and molecular distance in living system2-4, preliminary trials to measure the two binding site distance were conducted using the FRET design. The previous research work30-32 have indicated that the Alexa Fluor 488 (or FITC) makes a good FRET pair with TMR or Cy5 to probe molecular interactions or distances. Alexa Fluor 488 has a similar absorption and emission spectrum with FITC, but it is less pH-sensitive and more photostable than FITC. Therefore, it was proven to be a better candidate for live cell measurements33. Alexa Fluor 488/TMR has a large spectra overlap, and is easier for the energy transfer to occur. Therefore, it is a more conventional dye pair for FRET studies. But on the other hand, Alexa Fluor 488 alone also shows certain level of emission at around 580nm when excited at 488nm, which results in a high background in FRET. For the dye pair Alexa Fluor 488/Cy5, although it has a much lower spectra overlap, it has still been proven to have a high energy transfer efficiency while reaching close proximity with a low background30. Therefore, the Alexa Fluor 488/Cy5 pair is more suitable for mapping interactions with closer distance and the Alexa Fluor 488/TMR pair can measure interactions with farther distance. Here in this binding site measurement, we have adopted these two different FRET pairs to study the interactions between the two binding sites. As shown in Figure 3, by labeling the two ligands with different dye pairs [Alexa488-antiPTK7/Cy5-sgc8 (Figure 3A) or Alexa488-antiPTK7/TMR-sgc8 (Figure 3B)], the energy transfer from the donor dye (Alexa Fluor 488 on antiPTK7) to the acceptor (TMR/Cy5 on sgc8) was monitored by using a Flow Cytometer. In the FRET experiment using Alexa488-antiPTK7 as the donor and Cy5-sgc8 as the acceptor (Figure 3A), an excitation source at 488nm was used and the FRET signal was monitored in the channel 3 (collecting emission signal at 650±30 nm) of the Flow Cytometer. However, no significant fluorescence shift was observed (FRET: red curve), compared to the system with donor Alexa488-antiPTK7 only (green curve) or acceptor Cy5-sgc8 only (yellow curve). In the other FRET experiment with Alexa488-antiPTK7 as the donor and TMR-sgc8 as the acceptor (Figure 3B), an excitation source at 488nm was used and the FRET signal was monitored in channel 2 (collecting emission signal at 585±42 nm). Similar results were observed in the Alexa488-antiPTK7/TMR-sgc8 system. Although the FRET signal (red curve) with both Alexa488-antiPTK7 and TMR-sgc8 has a significant shift comparing to the background (black curve) and the negative controls (blue and purple curves), no significant intensity difference was shown compared to the donor Alexa488-antiPTK7 only (green curve). This indicated that most of the FRET signal detected in the system was from the direct emission of the donor (Alexa488-antiPTK7) alone into Channel 2 at 488nm excitation, without energy transfer to the acceptor (TMR-sgc8). Therefore, no significant fluorescence energy transfer from donor Alexa488-antiPTK7 to either TMR-sgc8 or Cy5-sgc8. All these results have showed the weak FRET interactions between the two ligands when using the FRET design to study the binding site distance.
Figure 3.

Measure the distance between two binding sites using FRET. (A) The flow cytometry histogram indicates the Flow Cytometry assay to monitor the fluorescence intensities at channel 3 (collecting emission signal at 650±30 nm) from the cell membrane with an excitation source at 488nm, which is the FRET signal from Alexa488-antiPTK7 to Cy5-sgc8. X-axis “FL3” represents the fluorescence emission intensity collected in Channel 3 (650±30 nm) in the Flow Cytometer. The y-axis “events” represents the number of events (cell count). The higher FRET signal is obtained from the cell surface, a more right-shift of the peak in the histogram will be shown. The green curve indicates the fluorescence intensity from the cell membrane with saturated concentrations of Alexa488-labeled anti-PTK7 (200nM). The yellow curve shows the fluorescence intensity with saturated concentrations of Cy5-labeled sgc8 (200nM). The red curve indicates the fluorescence intensity in the presence of both Alexa488-antiPTK7 (200nM) and Cy5-sgc8 (200nM) on the cell membrane. The black curve marks the fluorescence background with cells only, and the blue curve and purple curve show the binding of FITC-labeled control antibody FITC-labeled isotype Mouse IgG2a and Cy5-labeled unselected DNA library, respectively. (B) The flow cytometry histogram indicates the Flow Cytometry assay to monitor the fluorescence intensities at channel 2 (collecting emission signal at 585±42 nm) from the cell membrane with an excitation source at 488nm, which is the FRET signal from Alexa488-antiPTK7 to TMR-sgc8. The x-axis “FL2” represents the fluorescence emission intensity collected in Channel 2 (585±42 nm) in the Flow Cytometer. The y-axis “events” represents the number of events (cell count). The green curve indicates the fluorescence intensity from the cell membrane with saturated concentrations of Alexa488-labeled anti-PTK7 (200nM). The yellow curve shows the fluorescence intensity with saturated concentrations of TMR-labeled sgc8 (200nM). The red curve indicates the fluorescence intensity in the presence of both Alexa488-antiPTK7 (200nM) and TMR-sgc8 (200nM) on the cell membrane. The black curve represents the background signal from cell only without any dye-labeled ligands in the system. The blue curve and purple curve were the negative controls showing the binding of control antibody FITC-labeled isotype Mouse IgG2a and TMR-labeled unselected DNA library, respectively. Excitation source: Argon laser at 488nm. Channel 1: e collecting emission at 530±30 nm; Channel 2:collecting emission at 585±42 nm; Channel 3: collecting emission at 650±30 nm. Alexa Fluor® 488: maximum absorption: 495nm, maximum emission: 519nm; FITC: fluorescein isothiocyanate, maximum absorption: 494nm, maximum emission: 520nm; TMR: Tetramethylrhodamine, maximum absorption: 546nm, maximum emission: 574nm; Cy5: Cyanine 5, maximum absorption: 650nm, maximum emission: 670nm.
Since there was no significant energy transfer between different dye pairs so that to predict the interactions between the two binding sites, we asked whether it would be possible to use fluorescence quenchers, instead of organic dyes, as the energy acceptors to form the FRET interactions. The design was similar as described above using different dye pairs. However, instead of conjugating the organic dyes TMR/Cy5 to aptamer sgc8, two different kinds of fluorescent quenchers, Black Hole Quencher I (BHQ) and Dabcyl, were used to conjugate to the aptamers independently. These two quenchers were chosen because they both have absorptions around 520nm overlapping the emission spectrum of Alexa Fluor 488. In addition, we have also constructed two types of aptamer-quencher conjugates. One is using direct conjugation between the quencher and the aptamer; the other is adding a 10-polyT linker between them. The 10-polyT linker has 10 extra T bases between the quencher and the aptamer, which gave a larger flexibility to the quencher to hang around the aptamer binding site, thus has a higher possibility to have interactions with the Alexa Fluor 488 dyes on the antibody. However, as shown in Figure S2, all the flow cytometry results from the different quenchers and conjugates suggested that no significant fluorescence decrease was observed, indicating that no significant energy transfer occurred from the fluorescent donor to the quencher on the two binding sites. The extra 10-polyT linker on the quencher was also proven not helpful in the energy transfer interactions. These results once again proved that FRET was not able to detect the interactions between the two binding sites on receptor PTK7.
Since FRET interactions generally have high restrictions for dipole-dipole interaction orientations as well as interaction distance within 10 nm 5-7, we suspected that the weak FRET signals may result from unsuitable dipole-dipole orientations on the cell surface or a distance between binding sites that may exceed the detection limit of FRET. Besides FRET, routine methods for protein structure studies, such as X-ray crystallography, was also difficult to be adopted for membrane receptor studies because of problems with the separation and purification of the protein receptor from the cell membrane and protein complex. Therefore, a method with the capability to be applied onto the live cell surface without the needs for protein separations and purifications, as well as with long detection distance and low orientation restrictions, is definitely of great interest for scientists for molecular interaction and distance studies on live cells. To address this problem, by applying the SET interactions onto the living cell surface, we have constructed a molecular ruler to study the binding site distance on the PTK7 receptor on live cell membrane. In this method, there is no need for protein separations and binding site distances can be obtained in the natural cell surface physiological environment, without the concern of protein conformational changes after separations from the cell membrane.
SET Nanoruler Construction
In the effort to construct a “SET nanoruler” to measure the distance between the two binding sites, we employed the two ligands, sgc8 and anti-PTK7, to bring an organic fluorophore and a metal nanoparticle to each of the binding sites on the cell membrane. Gold NPs were chosen as the energy acceptor in the SET design because of their unique fluorescence quenching property, as well as their simplicity and reproducibility for synthetic and bioconjugation preparations (compared to other metal NPs, e.g., silver NPs). The gold nanoparticle was functionalized with excess thiol-modified sgc8 aptamers on its surface, and the antibody anti-PTK7 was modified with the organic fluorophore Alexa Fluor 488 through the primary amines on the heavy chain (preparations described in EXPERIMENTAL METHODS). As a consequence of the colocalization of both binding sites on receptor PTK7, the binding of ligand sgc8 and anti-PTK7 to their individual binding site brought the fluorophore and gold nanoparticle into close proximity, effectively resulting in fluorescence energy transfer from one to the other. As shown in Scheme 1, the distance, R, from the fluorophore on the antibody binding site to the center of the nanoparticle on the aptamer binding, is equivalent to the distance between the two binding sites on the PTK7 receptor to be measured. In order to simplify the model, R was divided into two parts: the distance r, from the fluorophore to the surface of the nanoparticle, and the distance from the surface of the particle to its center, which is the radius of the particle, d/2, with R= r + (d/2). Therefore, as the size of the gold nanoparticle (d) is varied, the distance from the fluorophore to the particle surface (r) changes accordingly. Although some variations in position around the center point of the aptamer binding site can potentially occur, one million cells were counted each time to cancel out these variances. In addition, a series of gold nanoparticles of different sizes were adopted to fit in the binding pockets to avoid this steric effect. Therefore, by controlling the sizes of the gold nanoparticles, the distance from the fluorophore molecule to the surface of gold nanoparticles could be manipulated, and the relationship between the size variations of the gold nanoparticles and the change in the energy transfer efficiency could be evaluated.
Scheme 1.

“SET nanoruler” for measuring the distance between two binding sites in receptor PTK7 on a live cell membrane. The yellow object represents a PTK7 receptor in the lipid bilayer of the cell membrane, with two binding sites on its extracellular domain. The blue moiety represents one of the receptor ligands, anti-PTK7. The Alexa Fluor 488 dye is labeled on its heavy chain through its primary amino groups. On the other side, the red sphere represents a gold nanoparticle. Multiple sgc8 aptamers (black) with thiol labeling are used to modify the surface of the gold nanoparticle. The aptamer-gold NP conjugate is brought to the aptamer binding site on the receptor through aptamer-receptor binding. The colocalization of both ligands on the receptor brings the Alexa Fluor 488 dye on the antibody close to the gold NP on the aptamer binding site. When the donor dye molecule and acceptor NP surface reach close proximity, quenching of fluorescence from the cell surface results. A series gold NPs of different sizes (5.4nm-42.2nm) were used in these energy transfer experiments. “R” represents the distance between the Alexa Fluor 488 dye on the anti-PTK7 heavy chain to the center of the gold NP, and “d” is the diameter of the gold NPs; therefore, “d/2” is the distance from the center of the gold NP to its surface, and “r” represents the distance from the Alexa Fluor 488 dye on anti-PTK7 to the surface of the gold NP.
First, gold nanoparticles of different sizes were prepared with precisely controlled diameters from 5 nm, 10 nm, 13 nm, 15 nm, 18 nm, 20 nm, 25 nm, and 31 nm to 42 nm, as described in EXPERIMENTAL METHODS. The sizes were controlled by using different amounts of reducing agent (sodium citrate) and were monitored afterwards by TEM imaging (Figure 1). The average diameter of each size was obtained by measuring the sizes of 100 particles from the TEM images with a narrow size distribution (shown in Supporting Information Table S1). In order to obtain the specific SET information from the two binding sites on the same receptor, the nanoparticle size range (d=5.4nm-42.2nm) was chosen to avoid crosslinking between individual receptors or inter-receptor SET effects. According to our previous receptor density studies of PTK7 on the cell surface using Fluorescence Correlation Spectroscopy,28 the distance between two adjacent receptors is around 40nm. Therefore, the sizes of nanoparticles chosen for the SET ruler constructions are smaller than the average inter-receptor distance, leading to a low chance for receptor crosslinking. In addition, a probability calculation shown in Supporting Information Appendix indicates that the contribution of inter-receptor SET due to receptor lateral diffusion is less than 1/10000 to the overall observed SET phenomenon. Moreover, since the distance from a dye molecule to the gold NP on the same receptor is much smaller compared to that to a gold NP on an adjacent receptor (at least 40nm), the major contribution of the SET effect observed is, therefore, coming from interactions between the dye molecule and the gold NP on the same receptor.
In order to eliminate the concentration effect on the SET measurement, quantitative binding experiments were conducted for both dye-labeled anti-PTK7 (Figure 4A) and each size of aptamer-gold NP conjugates (Figure 4B) on their own binding sites on the cell membrane. For dye-labeled anti-PTK7, a 200nM saturation concentration was obtained at the antibody binding sites; and for each size of aptamer-gold conjugates, different concentrations of the conjugates (0nM-15nM) were incubated on the cell surface of same amounts of cells (1 million) to obtain a quantitative binding curve, and a plateau was achieved to determine the saturation concentration on the surface for that specific sized conjugate (8nM for 5.4nm, 4nM for 10.1nm and larger NPs). We used these saturation concentrations to conduct all the following SET experiments to keep the consistency in measurements and ensure that they are all under the same saturation labeling conditions for all sized particles conjugates on the cell surface. Plus, a competition study using the same aptamer sgc8 with a different label (Cyanine 5, 650nm/670nm) at lower concentration (25 nM) was conducted after each SET experiment (Supporting Information Figure S3) to once again confirm the saturation binding of the gold nanoparticle-aptamer sgc8 conjugates on the cell surface. A lower concentration (25 nM) of competing ligands (Cy5-sgc8) was chosen in this experiment, because this concentration was not high enough to replace the gold NP-sgc8 conjugates if they already saturated the aptamer binding sites, but it was high enough to stain any aptamer binding sites that were still not occupied. In this way, it worked as an indicator to show whether all the aptamer binding sites on the PTK7 receptors have been saturated by the gold NP-sgc8 conjugates. The results showed that no stain of Cy5-sgc8 was shown on the surface of cell membrane, which indicated that all the aptamer binding sites are saturated by the gold NP-sgc8 conjugates. Therefore, both binding sites were ensured under saturation binding conditions by their individual ligands in the SET nanoruler for the distance measurements.
Figure 4.

Ligand binding saturation concentration determinations. (A) KD binding curve for ligand Alexa488-antiPTK7 on CEM cells. The fluorescence intensities were normalized. The fluorescence intensity with cell only (without any labeled ligands) was set as the background “0”, and the maximum fluorescence intensity was set as “1”. B) KD binding curves for 5.4, 10.1 and 18.4 nm gold NP-aptamer conjugates on CEM cells. Red curve: 5.4 nm gold NP-aptamer conjugates; Blue curve: 10.1 nm gold NP-aptamer conjugates; Purple curve: 18.4 nm gold NP-aptamer conjugates. The fluorescence intensities were normalized. The fluorescence intensity with cell only (without any labeled ligands) was set as the background “0”, and the fluorescence intensity with saturated Alexa488-antiPTK7 alone was set as the maximum intensity “1”. Each fluorescence signal has subtracted the background signal (intensity with cell alone).
After the SET nanoruler were constructed onto the cell membrane and saturated the two binding sites, the sizes of the gold nanoparticles on the aptamer sites were varied from d=5.4nm to 42.2nm. Both flow cytometry (Figure 5) and confocal imaging (Figure 6) were used to monitor the changes in the fluorescence energy transfer efficiency from the Alexa Fluor 488 dyes to the surface of the gold nanoparticle while the NP sizes were varied. In presence of the aptamer-gold NP conjugates on the aptamer binding sites, fluorescence quenching from the Alexa Fluor 488 donor was observed compared to the situation with no gold NP conjugates; and while the diameters of the NPs became larger, the surface of gold NPs were getting closer to the dye molecules, and therefore, more fluorescence quenching was obtained. A quantitative monitoring of the fluorescence quenching was shown in the histograms from the flow cytometry measurements (Figure 5B). When the fluorescence quenching efficiencies was plotted against the change in diameters of the gold NPs on the aptamer binding sites, a sharp fluorescence decrease from the Alexa Fluor 488 on anti-PTK7 was observed as the sizes of aptamer-NP conjugates grew from d=5.4nm (92.8% fluorescence intensity compared to no NPs) to d=18.4nm (35.9% fluorescence intensity compared to no NPs). While the aptamer-NP conjugates reached a diameter of 18nm, the fluorescence quenching reached a fluorescence plateau with similar intensity as the IgG2a control, and larger NP conjugate sizes (18.4nm-42.2nm) remained similar fluorescence quencher efficiencies. This d=18nm converging point not only indicated the situation of maximum fluorescence quenching, but also provide the information of the minimum diameter of gold NPs on the aptamer site whose surface can reach the dye molecules on the antibody sites. Therefore, the distance between the dye molecule and the gold NP reached minimum to produce the maximum fluorescence quenching. Therefore, a fluorescence plateau was obtained and gold NP conjugates with diameters larger than 18nm gave a similar degree of fluorescence quenching. All these quantitative fluorescence quenching efficiency results against the change of gold NPs on the aptamer binding sites were adopted into the further calculations and discussions in the following part “Binding Site Distance Determination” to further obtain the distance between the two binding sites on the cell membrane.
Figure 5.

Flow cytometry assay to monitor the fluorescence intensities on live cells. A) Fluorescence intensity from the Alexa488-labeled anti-PTK7 in the presence of varying sizes of gold NP-aptamer conjugates on live cell membrane was monitored using a Flow cytometer. On each frame, the red curve indicates the fluorescence intensity from cell membrane with saturated concentrations of Alexa488-labeled anti-PTK7 with no gold NP-aptamer conjugate. The red arrow indicates the mean intensity. The blue curve shows the fluorescence shift in the presence of gold NP-sgc8 conjugates. The gap between the blue and red arrow indicates that the fluorescence intensity decreased with the increasing size of the gold NP conjugates. The green curve represents the fluorescence intensity in the presence of the same-sized gold NP, but the NP was conjugated with a control aptamer sequence, TDO5, which does not bind the receptor PTK7. No significant fluorescence shift was shown for the control. The black curve marks the fluorescence background with cells only, and the yellow curve shows the binding of control antibody FITC-labeled isotype Mouse IgG2a. B) Histogram of the mean fluorescence intensity for the fluorescence quenching assay determined from the flow cytometry results. All of the experiments for the fluorescence quenching assay were repeated three times, and the average value was determined as the mean fluorescence intensity.
Figure 6.

Confocal imaging assay for monitoring the fluorescence quenching on cell surface with different sizes of gold nanoparticles. The two boxes framed in red show the fluorescence images of CEM cells with saturated concentration of Alexa488-labeled anti-PTK7 only and fluorescence background with cells only. Boxes (a1)-(a9) show the fluorescence of cells in the presence of different sizes of gold NP-sgc8 conjugates. Boxes (b1)-(b9) indicate the fluorescence with the control aptamers TDO5 and the same sizes of gold NPs as those shown in boxes (a1)-(a9). Vertical comparisons of same sizes of gold NPs with aptamer sgc8 and control sequence TDO5 clearly show the difference in the fluorescence quenching efficiency.
Binding Site Distance Determination
As illustrated in Scheme 1, the relationship of the binding site distance (R), the NP diameter (d) and the distance from the dye molecule to the gold NP surface (r) is given by:
| (1) |
Since the binding site distance R is fixed, increasing the diameter of the gold nanoparticle will result in closer proximity between the fluorescence donor and the nanoparticle acceptor surface (smaller r), hence increasing energy transfer efficiency. This, in turn, explains why the larger gold nanoparticles in the ruler resulted in better fluorescence quenching. The plot of quenching efficiency (Φ) versus different gold nanoparticle diameters (d) (Figure 7) shows a plateau after the particle diameter reached ~18nm, indicating that the surface of the particle had reached the antibody binding site and had thus achieved maximum fluorescence quenching. Consequently, particles with diameters larger than d=18nm would not reach a higher degree of quenching.
Figure 7.
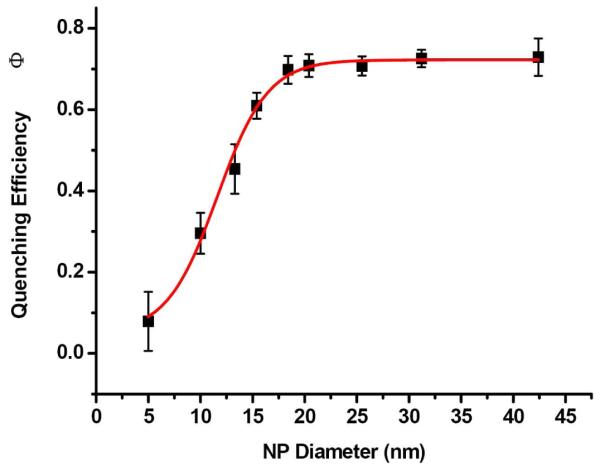
Relationship between fluorescence quenching efficiency and gold nanoparticle diameter. The fluorescence quenching efficiency was determined from the quantitation of the fluorescence intensity from the Flow Cytometry Analysis (Figure 5B). The fluorescence quenching efficiency Φ was determined from: , in which I0=fluorescence intensity in the absence of the quencher (gold NP-aptamer) (i.e., cells with Alexa488-antiPTK7 only); I=fluorescence intensity in the presence of both Alexa488-antiPTK7 and the quencher (gold NP-aptamer).
The distance-dependent quenching data were fit to the Nanoparticle Surface Energy Transfer model employed by Yun et al:13
| (2) |
In equation (2), Φ is the energy transfer efficiency; r0 is a constant value for a specific dye-metal system, corresponding to the distance at which a dye will display equal probabilities for energy transfer and spontaneous emission13; and r is the distance from the dye molecule to the gold nanoparticle surface.
Substitution of r from equation (1) and rearranging gives:
| (3) |
By letting and X=d, (3) is simplified to:
| (4) |
According to the literature19, unlike large particle sizes (>20nm) in which r0 values vary a lot for different particle sizes, for gold particle sizes between 5-15nm, a very similar r0 value was obtained around 6-8nm. Therefore, the r0 values do not have significant variance for different sizes for the particle size ranges (5-15nm) that chosen for the distance calculations and it is reasonable during our calculation to assume r0 as a constant in this range.
Since r0 is a constant, X and Y obey a linear relationship with and Y-axis
The plot of Y versus X in Figure 8 is linear between 5.4 and 18.4 nm with equation:
| (5) |
From the slope,
and from the intercept,
Thus, the obtained distance between the two binding sites is R= (13.4±1.4) nm, which is larger than the detection limit for FRET. This explains the weak FRET signal from these two binding sites obtained in previous FRET studies (Figure 3) and proves that nanoparticle dipole-surface energy transfer can detect larger interaction distances than dipole-dipole interactions.
Figure 8.

Binding site distance determination. A) By plotting vs. nanoparticle diameter d, a linear relationship was obtained between d=5.4nM to d=18.4nM, and it reached a plateau with d larger than 18.4nM (d=18.4nM-42.2nM). B) The expanded plot of linear region.
Potential Effects of Steric Hindrance on the Fluorescence Quenching
The suspected fluorescence quenching from the gold nanoparticles themselves in the system was excluded by a control experiment with same sized gold NPs conjugated with a control aptamer sequence TDO5, which had been confirmed with no bindings to receptor PTK7.23, 24 The control experiments conducted in both flow cytometry (green curves in Figure 5A) and confocal imaging (Figure 6 boxes b1-b9) showed no significant fluorescence quenching compared to the situation with no NPs, indicating that the energy transfer between the two binding sites was indeed resulted from the specific ligand-receptor interactions which brought the donors and acceptors into close proximity and that the metal particle in the system did not have nonspecific interactions with the dyes.
So far, surface energy transfer has been the only plausible basis for the fluorescence quenching phenomenon. However, it is also possible that the binding of nanoparticles to the aptamer binding sites could hinder the binding of the fluorescence donors to the antibody binding sites, and therefore lead to the decrease of fluorescent signals. To investigate the possible steric hindrance of the nanoparticles, control experiments were performed with silica nanoparticles (Figure 9). A 15-nm silica nanoparticle was chosen as the control system for two reasons: 1) previous SET experiments using different sizes of gold nanoparticles (Figure 7) indicated that the 15-nm gold nanoparticles on the aptamer binding site showed significant quenching effects on the Alexa Fluor 488 donors on the antibody binding site (quenching efficiency: ~50%) and 2) there is no fluorescence absorption in the visible range for silica nanoparticles; therefore, they should not accept any energy from the fluorescence donor. Saturation binding (Supporting Information Figure S4) indicated that the SiNP-sgc8 conjugates indeed bound to the aptamer binding sites on the cell surface. However, as shown in Figure 9, while the 15-nm diameter gold nanoparticles quenched around half of the fluorescence from the donor, their counterpart silica nanoparticles with the same diameter showed no significant fluorescence shiftback compared to the maximum fluorescence from the donors only. Therefore, we can therefore deduce that differences in fluorescence quenching resulted from the specific energy transfer from the donor on the antibody binding sites to the gold nanoparticles on the aptamer binding sites and were not caused by the nonspecific steric hindrance effects in the donor binding.
Figure 9.
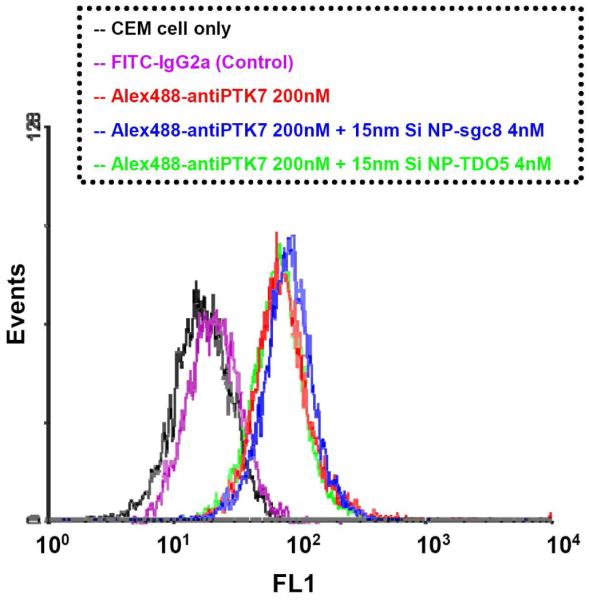
Flow cytometry analysis to monitor the fluorescence quenching effect with 15-nm silica nanoparticles. The red curve indicates the fluorescence intensity from cell membrane with saturated concentrations of Alexa488-labeled anti-PTK7 in the absence of the SiNP-aptamer conjugates. The blue curve shows the fluorescence shifts in the presence of the 15-nm SiNP-sgc8 conjugates, and the green curve represents the fluorescence intensity in the presence of the 15-nm SiNP-TDO5 conjugates, the control aptamer sequence. No significant fluorescence shiftback was observed in the presence of either SiNP-sgc8 or SiNP-TDO5, compared to the red curve with the Alexa488-labeled anti-PTK7 only. The black curve marks the fluorescence background with cells only, and the purple curve showed the binding of control antibody FITC-labeled isotype Mouse IgG2a.
Effects of Different Excitation Intensity and Labeling Efficiency on Distance Determination
The binding site distance was obtained by studying the relationships between the fluorescence quenching efficiencies and the change in NP diameters. However, some systematic effects, such as the dye-antibody labeling efficiency effects and different laser excitation intensity variations, could also change the quenching efficiency and result in a different answer of binding site distance. Here, the influences of different laser excitation intensities and different antibody/dye labeling efficiencies on the calculations of binding site distance were investigated in a series of fluorescence quenching experiments with gold NPs in different sizes. The laser excitation voltage was varied from 650V to 700V and then to 750V in the flow cytometer, and the fluorescence quenching was monitored as shown in Figure 10. It was observed that higher laser intensities gave higher fluorescence signals. However, similar slopes were obtained in the fluorescence decay for different laser intensities for nanoparticle diameters ranging from 5.4nm to 18.4nm, while a plateau was achieved with nanoparticle diameters larger than 18.4nm. The similar decay rates resulted in similar distance R results, which indicated the negligible effects of different laser intensities on the distance determinations of the “SET nanoruler”.
Figure 10.

Effects of different laser intensities on fluorescence quenching efficiency. A) Histogram of the fluorescence quenching assay with different laser excitation intensities (Red: 750V; Green: 700V; Blue: 650V) from flow cytometry analysis. Experimental procedures were the same as described in Figure 5. In all these experiments, the labeling efficiencies of Alexa Fluor 488 dyes on the anti-PTK7 were kept the same, and there were four dyes on each antibody according to the labeling protocol. All of the experiments for fluorescence quenching assay were repeated three times, and the average value was determined as the mean fluorescence intensity. B) Relationship between fluorescence quenching efficiency and gold nanoparticle diameter. Fluorescence quenching efficiencies were determined from fluorescence intensity in Figure 10A using the following equation: . Inside the red rectangle, a linear relationship was obtained between the fluorescence quenching efficiency and gold nanoparticle diameter (d=5.4nm-18.4nm) for different laser intensities. Slopes were equal within experimental error (650V, (−0.077±0.0072); 700V, (−0.072±0.0085); 750V, (−0.073±0.013)). C) Plot vs. NP diameter gave linear relationships between d=5.4nm-18.4nm (red rectangle region in (B)). The linear fits for different laser intensities resulted in similar distance R results (red: R=(13.43±1.40) nm; green: R=(13.74±1.82) nm; blue: R=(13.56±2.73) nm).
Different antibody/dye labeling efficiencies were also tested. With multiple primary amino groups on the heavy chain, the anti-PTK7 could react with different amounts of Alexa Fluor 488 dyes during the conjugation. By controlling the amount of dye added, three different conjugates were prepared, having 2, 4 or 6 dyes, respectively, on each antibody. As shown in Supporting Information Figure S5, results of the fluorescence quenching experiments were similar to those of the laser intensity experiments.
Both of these studies indicated that the variations in laser source intensity and antibody labeling efficiency have limited effects on the determination of the binding site distances. Here it also showed the benefit of using gold NPs with different sizes instead of a single size for the nanoruler construction. As seen from the above measurements, the laser intensity and labeling efficiency effects could change the fluorescence quenching efficiency for individual size of gold NPs. So if only a single sized NP was used in the distance measurement, these effects could result in a different binding distance. However, while a series of different sized NPs were applied for the measurement, these effects were rule out and a similar decay slope was obtained, which leaded to a similar results for the binding site measurements. Therefore, the use of different sizes of nanoparticles in the ruler construction also introduces a feature to enhance the precision for the distance calculations and determinations.
CONCLUSION
In this paper, we have demonstrated, for the first time, the successful construction of a “SET nanorular” on a live cell membrane to measure the protein binding site distances. The distance between the aptamer and antibody binding sites in the membrane protein PTK7 was obtained from the surface of leukemia T-cells (CEM) in the natural physiological environment as (13.4±1.4) nm, with an error within 10%. No protein separations or purifications were needed. The result also shows that this cell membrane SET nanoruler can measure separation distances well beyond the detection distance of FRET. Plus, since the energy acceptor nanoparticle in SET has a surface and an isotropic distribution of dipole vectors to accept energy from the donor, it has a much lower requirement for interaction orientations than FRET and thus leads to wider applications for distance measurements for various in vitro and cellular systems.
On the other hand, the SET system also shows some advantages for cellular measurements over its counterpart plasmonic rulers which also process long-distance detection capability. For plasmonic effects, only small sized particles can be used to build plasmonic rulers, because the scattering effect only dominates in small sized particles (diameters < 2nm) due to the insufficient overlap for fluorescence energy transfer. In contrast, particles with diameters greater than 2nm have higher probability and incidence of fluorescence quenching12. However, the SET nanoruler has a much larger range for the choice of particle sizes. For example, in this paper, a series of sizes (5nm-42nm) of gold nanoparticles have been adopted to successfully construct an SET nanoruler on the cell surface. Therefore, compared with plasmonic rulers, the SET system has fewer limitations on the choices of particle sizes in the designs of nanorulers constructions.. Moreover, high scattering background from the cell surface also significantly reduces the detection signal-to-background ratio and therefore prohibits the applications of plasmonic rulers to the cell surface.
In summary, “SET nanorulers” have the potential to become an alternative to FRET for molecular interaction and distance measurement in cellular systems, especially for applications demanding long observation times or large distances. It represents the next leap forward in use of optical probes to monitor structural components within a cell membrane and will open a new pathway for cellular imaging.
Supplementary Material
ACKNOWLEDGMENT
We would like to thank Mr. Angelo Veloro and Dr. Gail Fanucci for suggestions on experimental design and data discussions, Dr. Kathryn R. Williams for help with the manuscript, Mr. Fei Huang and Mr. Jin Huang for useful discussions on the manuscript. We also thank the fellowship support from the “Chinese Government Award for Outstanding Self-Financed Student Abroad” and the “Academic Women Madelyn Lockhart Dissertation Fellowship”, as well as NIH and NSF for the funding and supports.
Footnotes
SUPPORTING INFORMATION AVAILABLE: Characterizations of different sized gold NPs and preparations of different sized gold NP-aptamer conjugates; Experimental details for saturation binding concentration determination; Competition studies to confirm the saturation binding of aptamer-NP conjugates on cell membrane; Influences of different antibody/dye labeling efficiencies on the calculations of binding site distances; Appendix: probability calculation of inter-receptor SET interaction contribution. This material is available free of charge via the Internet at http://pubs.acs.org.
REFERENCES
- (1).Weiss S. Science. 1999;283:1676–1683. doi: 10.1126/science.283.5408.1676. [DOI] [PubMed] [Google Scholar]
- (2).Zhuang X, Bartley LE, Babcock HP, Russell R, Ha T, Herschlag D, Chu S. Science. 2000;288:2048–2051. doi: 10.1126/science.288.5473.2048. [DOI] [PubMed] [Google Scholar]
- (3).Yildiz A, Forkey JN, McKinney SA, Ha T, Goldman YE, Selvin PR. Science. 2003;300:2061–2065. doi: 10.1126/science.1084398. [DOI] [PubMed] [Google Scholar]
- (4).Blanchard SC, Kim HD, Gonzalez RL, Jr., Joseph D, Chu S. Proceeding of the National Academy of Sciences of the United States of America. 2004;101:12893–12898. doi: 10.1073/pnas.0403884101. P. [DOI] [PMC free article] [PubMed] [Google Scholar]
- (5).Chance RR, Prock A, Silbey R. In: Advances in Chemical Physics. Prigogine I, S AR, editors. 2007. pp. 1–65. [Google Scholar]
- (6).Persson BNJ, Lang ND. Physical Review B. 1982;26:5409. [Google Scholar]
- (7).Lakowicz JR. Principles of fluorescence spectroscopy. 2nd ed. Springer; Heidelberg: 1999. [Google Scholar]
- (8).Liu GL, Yin Y, Kunchakarra S, Mukherjee B, Gerion D, Jett SD, Bear DG, Gray JW, Alivisatos AP, Lee LP, Chen FF. Nat Nano. 2006;1:47–52. doi: 10.1038/nnano.2006.51. [DOI] [PubMed] [Google Scholar]
- (9).Anker JN, Hall WP, Lyandres O, Shah NC, Zhao J, Van Duyne RP. Nat Mater. 2008;7:442–453. doi: 10.1038/nmat2162. [DOI] [PubMed] [Google Scholar]
- (10).Sonnichsen C, Reinhard BM, Liphardt J, Alivisatos AP. Nat Biotech. 2005;23:741–745. doi: 10.1038/nbt1100. [DOI] [PubMed] [Google Scholar]
- (11).Bene L, Szentesi G, Matyus L, Gaspar R, Damjanovich S. Journal of Molecular Recognition. 2005;18:236–253. doi: 10.1002/jmr.730. [DOI] [PubMed] [Google Scholar]
- (12).Fan C, Wang S, Hong JW, Bazan GC, Plaxco KW, Heeger AJ. Proceeding of the National Academy of Sciences of the United States of America. 2003;100:6297–6301. doi: 10.1073/pnas.1132025100. [DOI] [PMC free article] [PubMed] [Google Scholar]
- (13).Yun CS, Javier A, Jennings T, Fisher M, Hira S, Peterson S, Hopkins B, Reich NO, Strouse GF. Journal of the American Chemical Society. 2005;127:3115–3119. doi: 10.1021/ja043940i. [DOI] [PubMed] [Google Scholar]
- (14).Darbha GK, Ray A, Ray PC. ACS Nano. 2007;1:208–214. doi: 10.1021/nn7001954. [DOI] [PubMed] [Google Scholar]
- (15).Jennings TL, Schlatterer JC, Singh MP, Greenbaum NL, Strouse GF. Nano Letters. 2006;6:1318–1324. doi: 10.1021/nl052458a. [DOI] [PubMed] [Google Scholar]
- (16).Ray PC, Darbha GK, Ray A, Hardy W, Walker J. Nanotechnology. 2007;18:375504. [Google Scholar]
- (17).Jennings TL, Singh MP, Strouse GF. Journal of the American Chemical Society. 2006;128:5462–5467. doi: 10.1021/ja0583665. [DOI] [PubMed] [Google Scholar]
- (18).Griffin J, Ray PC. The Journal of Physical Chemistry B. 2008;112:11198–11201. doi: 10.1021/jp8059322. [DOI] [PubMed] [Google Scholar]
- (19).Griffin J, Singh AK, Senapati D, Rhodes P, Mitchell K, Robinson B, Yu E, Ray PC. Chemistry - A European Journal. 2009;15:342–351. doi: 10.1002/chem.200801812. [DOI] [PubMed] [Google Scholar]
- (20).Sen T, Haldar KK, Patra A. The Journal of Physical Chemistry C. 2008;112:17945–17951. [Google Scholar]
- (21).Sen T, Sadhu S, Patra A. Applied Physics Letters. 2007;91:043104-043104–043103. [Google Scholar]
- (22).Frens G. Nature Phys. Sci. 1973;241:20–22. [Google Scholar]
- (23).Chen X, Estevez MC, Zhu Z, Huang Y-F, Chen Y, Wang L, Tan W. Analytical Chemistry. 2009;81:7009–7014. doi: 10.1021/ac9011073. [DOI] [PubMed] [Google Scholar]
- (24).Xiao Z, Shangguan D, Cao Z, Fang X, Tan W. Chemistry - A European Journal. 2008;14:1769–1775. doi: 10.1002/chem.200701330. [DOI] [PubMed] [Google Scholar]
- (25).Shangguan D, Li Y, Tang Z, Cao ZC, Chen HW, Mallikaratchy P, Sefah K, Yang CJ, Tan W. Proceedings of the National Academy of Sciences. 2006;103:11838–11843. doi: 10.1073/pnas.0602615103. [DOI] [PMC free article] [PubMed] [Google Scholar]
- (26).Shangguan D, Cao Z, Meng L, Mallikaratchy P, Sefah K, Wang H, Li Y, Tan W. Journal of Proteome Research. 2008;7:2133–2139. doi: 10.1021/pr700894d. [DOI] [PMC free article] [PubMed] [Google Scholar]
- (27).Meng L, Sefah K, Shangguan D, O’Donoghue MB, Zhu GZ, Noorali A, Zhou L, Tan WH. PLOS One. 2010 doi: 10.1371/journal.pone.0014018. accepted. [DOI] [PMC free article] [PubMed] [Google Scholar]
- (28).Chen Y, Munteanu A, Huang Y-F, Phillips J, Zhu Z, Mavros M, Tan W. Chemistry - A European Journal. 2009;15:5327–5336. doi: 10.1002/chem.200802305. [DOI] [PMC free article] [PubMed] [Google Scholar]
- (29).Stauber GB, Aggarwal BB. Journal of Biological Chemistry. 1989;264:3573–3576. [PubMed] [Google Scholar]
- (30).Yang CJ, Martinez K, Lin H, Tan W. Journal of the American Chemical Society. 2006;128:9986–9987. doi: 10.1021/ja0618346. [DOI] [PubMed] [Google Scholar]
- (31).Sohn SY, Bae WJ, Kim JJ, Yeom K-H, Kim VN, Cho Y. Nat Struct Mol Biol. 2007;14:847–853. doi: 10.1038/nsmb1294. [DOI] [PubMed] [Google Scholar]
- (32).Koch HP, Larsson HP. J. Neurosci. 2005;25:1730–1736. doi: 10.1523/JNEUROSCI.4138-04.2005. [DOI] [PMC free article] [PubMed] [Google Scholar]
- (33).Panchuk-Voloshina N, Haugland RP, Bishop-Stewart J, Bhalgat MK, Millard PJ, Mao F, Leung W-Y, Haugland RP. J. Histochem. Cytochem. 1999;47:1179–1188. doi: 10.1177/002215549904700910. [DOI] [PubMed] [Google Scholar]
Associated Data
This section collects any data citations, data availability statements, or supplementary materials included in this article.