

Abstract
Purpose
Previously, we found that gene expression in histologically normal breast epithelium (NlEpi) from women at high breast cancer risk can resemble gene expression in NlEpi from cancer-containing breasts. Therefore, we hypothesized that gene expression characteristic of a cancer subtype might be seen in NlEpi of breasts containing that subtype.
Experimental Design
We examined gene expression in 46 cases of microdissected NlEpi from untreated women undergoing breast cancer surgery. From 30 age-matched cases (15 estrogen receptor (ER)+, 15 ER-) we used Affymetryix U133A arrays. From 16 independent cases (9 ER+, 7 ER-), we validated selected genes using qPCR. We then compared gene expression between NlEpi and invasive breast cancer using 4 publicly available datasets.
Results
We identified 198 genes that are differentially expressed between NlEpi from breasts with ER+ (NlEpiER+) compared to ER- cancers (NlEpiER-). These include genes characteristic of ER+ and ER- cancers (e.g., ESR1, GATA3, and CX3CL1, FABP7). QPCR validated the microarray results in both the 30 original cases and the 16 independent cases. Gene expression in NlEpiER+ and NlEpiER- resembled gene expression in ER+ and ER- cancers, respectively: 25-53% of the genes or probes examined in 4 external datasets overlapped between NlEpi and the corresponding cancer subtype.
Conclusions
Gene expression differs in NlEpi of breasts containing ER+ compared to ER- breast cancers. These differences echo differences in ER+ and ER- invasive cancers. NlEpi gene expression may help elucidate subtype-specific risk signatures, identify early genomic events in cancer development and locate targets for prevention and therapy.
Keywords: normal, breast, epithelium, expression, invasive cancer, estrogen receptor
Translational Relevance.
We find that gene expression differs in histologically normal epithelium of breasts containing ER+ compared to ER- breast cancers. These normal epithelial gene expression differences reflect the gene expression differences in ER+ compared to ER-cancers. This finding implies that genomic changes characteristic of specific breast cancer subtypes may be detectable before histologic evidence of abnormalities. Therefore, normal epithelium gene expression profiles could help define a breast cancer subtype-specific risk signature, identify the initial genomic differences between subtypes, and suggest new targets for prevention and therapy, which is especially important for ER- cancers.
Introduction
Breast cancer is a heterogeneous disease. One well-documented and clinically important dichotomizing characteristic of breast cancers is expression (or not) of estrogen receptor α (ER). ER expression is of major importance in breast cancer prevention, treatment and outcome (1-3) and may even help define a cancer’s cell of origin (4).
Many of the genomic aberrations present in each subtype of invasive breast cancers can also be detected in earlier lesions, such as carcinoma in situ and even hyperplastic lesions (for review see (5)), suggesting that these aberrations are important to breast cancer initiation or early progression. Unexpectedly, alterations - genetic, epigenetic, gene expression and protein – have been found in histologically normal breast tissue, but their biological significance and clinical utility are poorly understood (6-16) (for review see (17)). They may mark increased risk, or be evidence of a field effect [e.g., due to an exposure or to an occult dysregulation of a gene or pathway]. They could reveal breast cancer’s earliest genomic changes, they could be random effects, or they could be a response to a tumor existing in the breast. Although challenging to address, a better understanding of the changes in histologically normal tissue should provide insight into breast cancer risk, initiation and early progression.
Recently, we found that gene expression in histologically normal breast epithelium (NlEpi) in women with breast cancers could be distinguished from NlEpi gene expression in women without breast cancer who were undergoing reduction mammoplasty (RM) (11, 18), and that NlEpi gene expression in women at high risk of breast cancer undergoing prophylactic mastectomy (PM) resembles NlEpi gene expression in women with breast cancer (18). This suggests that aberrant NlEpi gene expression may indicate increased breast cancer risk by demonstrating either the cancer’s earliest genomic changes, or the influence of the microenvironment on the epithelium. These findings led us to hypothesize that specific gene expression profiles might characterize NlEpi associated with particular subtypes. To test this hypothesis, the goals of the present study were, first, to compare gene expression in NlEpi in breasts containing two cancer subtypes, ER+ and ER-, and, second, to ask whether these gene expression profiles mirrored the gene expression profiles in ER+ and ER- breast cancers from independent cases. If this were true, then NlEpi expression could help define a risk signature for specific cancer subtypes, identify genomic features distinguishing the subtypes early in cancer development, and suggest new targets for subtype-specific prevention and therapy, which is of particular importance for ER- cancers.
Materials and Methods
Case selection
All cases were obtained using an IRB-approved protocol for collection of deidentified breast tissue not required for diagnosis. For microarray analysis, cases were randomly selected from women with ER+ or ER- tumors undergoing cancer surgery. No patient had undergone chemotherapy or radiation treatment prior to tissue acquisition. Each ER+ case was age matched (within 2 years) to an ER- case, to account for effects of age on gene expression (19-21) (see Table 1). Seventeen of 30 cases had been used in other studies (11, 18). For qPCR validation of the array data, an independent set of 16 cases (9 ER+ and 7 ER-) was selected using the same criteria as above (see Table S1).
Table 1.
Clinical-pathological characteristics of 30 breast cancer patients whose histologically normal breast epithelium (NlEpi) was analyzed by microarray
| Patients with ER+ tumors (n=15) | Patients with ER- tumors (n=15) | ||||||||
|---|---|---|---|---|---|---|---|---|---|
| Sample a | Age(yrs) | NlEpi distance from tumor(cm) | ER/PR/HER2 b | Stage c | Sample a | Age (yrs) | NlEpi distance from tumor (cm) | ER/PR/HER2 b | Stage c |
| 351H† | 35 | < 2 | + /+ /- | IIA | 319H★ | 34 | < 2 | - /- /- | IIIA |
| 297BH† | 46 | < 2 | + /+ /- | IIIC | 364H★ | 47 | > 2 | - /- /+ | IIIA |
| 359H† | 48 | < 2 | + /+ /na | I | 289H★ | 47 | < 2 | - /- /- | IIA |
| 304BH†★ | 49 | < 2 | + /+ /+ | I | 342H★ | 48 | < 2 | - /- /- | IIA |
| 248H† | 49 | > 2 | + /+ /- | I | 273H★ | 49 | < 2 | - /- /+ | III |
| 345H | 58 | > 2 | + /+ /- | IIB | 272H★ | 58 | > 2 | - /- /+ | IIIC |
| 388AH★ | 58 | < 2 | + /- /- | I | 322H★ | 58 | < 2 | - /- /- | I |
| 232H★ | 59 | > 2 | + /+ /na | 0 | 226H†★ | 61 | < 2 | - /-/ + | IIIA |
| 258H† | 65 | < 2 | + /+ /- | IIA | 452H | 63 | < 2 | - /- /- | I |
| 405H | 67 | > 2 | + /+ /- | III | 298H | 67 | < 2 | - /- /- | IIB |
| 311H | 69 | > 2 | + /+ /- | IIA | 429H | 69 | < 2 | - /- /- | IIA |
| 453H | 76 | > 2 | + /- /- | II | 333H★ | 76 | > 2 | - /- /+ | IIB |
| 394H | 81 | > 2 | + /+ /- | IIA | 413H | 79 | < 2 | - /- /- | I |
| 275H | 85 | < 2 | + /+ /- | IIIA | 296H | 82 | < 2 | - /- /- | I |
| 228H | 92 | < 2 | + /- /- | IIB | 401H | 94 | < 2 | - /- /- | IIIA |
Used in Tripathi et al or ★ in Graham et al
Estrogen Receptor, Progesterone Receptor, HER2 status of co-incident tumor. na = not available.
Stage using AJCC stage criteria (AJCC cancer staging manual. 6th ed. 2002, New York: Springer)
RNA extraction and microarray hybridization
Tissue preparation, microdissection, RNA extraction, amplification, hybridization and normalization were completed as described previously (11, 18). Briefly, tissues were snap frozen, embedded in Optimal Cutting Temperature embedding medium, sectioned at 10um, stained with hematoxylin and eosin (50% diluted with H20) and then histologically normal epithelium – both terminal ductal-lobular units (TDLUs) and ducts - were identified and microdissected (see Figure S1). Most NlEpi samples (n=20) were “tumor-adjacent” (i.e., located 1-2 cm from the tumor, on blocks lacking malignant cells). Some NlEpi samples (n=10) lay further away, but still in the same quadrant as the tumor, since most surgeries were lumpectomies. Great care was taken to avoid microdissecting any proliferative cells, even simple hyperplastic lesions. Most NlEpi samples consisted only of TDLUs, but about 20% of samples (mainly from older patients) contained some ducts, as well. RNA was extracted using the PicoPure extraction kit (Molecular Devices, Sunnyvale, CA). For cases undergoing microarray analysis, the RNA was amplified, and gene expression was measured using the Affymetrix U133A chip (Affymetrix, Santa Clara, CA), a technique that yields reliable and reproducible results (22). cel files were processed with MAS 5.0 using standard procedures for quality control and normalization was limited to rescaling each sample to a mean intensity of 200. The microarray data from these samples are available from the NCBI Gene Expression Omnibus1 under accession GSE21947.
Identification of differentially expressed probes
Probes with <20% detectable hybridization and samples with a scaling factor >10 were removed. Gene expression data of the probes that passed the quality control filters were analyzed using the method known as Bayesian Analysis of Differential Gene Expression (BADGE) (23) to identify probes that were differentially expressed in NlEpi of patients with ER+ compared to ER- cancers. We have used this approach previously (18, 24). BADGE uses a model-averaging approach to identify probes with different expression in two biological conditions and scores the evidence of differential expression by the probability that the fold change of expression is greater than 1 or smaller than 1. The probability score is then calculated as 1 minus this probability so that the smaller the probability score, the stronger is the evidence of differential expression. The method has a very large sensitivity but low specificity with small sample sizes: with 20 samples per group the sensitivity to detect a fold change of 2 or larger can be 100% but the specificity can be less that 70% (23). Therefore, to reduce the chance of false positives, we used an extrinsic leave-one-out cross validation implemented in BADGE to select those probes that showed robust changes of expression between groups (25). Leave-one-out cross validation consisted of removing one case at a time from the dataset and using the remaining samples to detect the probes with differential expression with a false discovery rate (FDR) < 5%, chosen to trade off sensitivity and specificity. Probes selected ≥ 80% of the time were included in the final list of differentially expressed genes and the final probability scores and fold changes are based on all samples (Table 2). Heatmaps were generated using the package HeatPlus from Bioconductor and simple hierarchical clustering was used to cluster samples based on their expression profiles.
Table 2.
216 probes [identified by gene name] differentially expressed between histologically normal breast epithelium of breasts with ER+ compared to ER- cancers §
| Gene | ER+:ER-Fold ‡ | Gene | ER+:ER-Fold ‡ | Gene | ER+:ER-Fold ‡ | Gene | ER+:ER-Fold ‡ |
|---|---|---|---|---|---|---|---|
| UGT2B28 | 15.65 | BUB3 | 2.28 | CUL4B | 2.08 | ANPEP | 0.40 |
| CXCL13 | 11.76 | SFRS1 | 2.28 | ADCY1 | 2.08 | IGHG1 | 0.40 |
| GRIA2 | 5.52 | CTSO | 2.27 | ATP9A | 2.07 | PTGDS | 0.40 |
| TNFSF11 | 4.41 | SAV1 | 2.27 | ZNF451 | 2.07 | SAT1 | 0.40 |
| TFPI2 | 4.22 | ALOX15B | 2.27 | YWHAZ | 2.07 | KRT23 | 0.40 |
| EREG | 4.20 | FUSIP1 | 2.26 | WAC | 2.07 | COL6A1 | 0.39 |
| SLC26A3 | 4.18 | SHQ1 | 2.26 | TM9SF2 | 2.04 | S100A4 | 0.39 |
| TSPAN8 | 4.13 | CCDC47 | 2.25 | CD74 | 0.49 | RARRES1 | 0.39 |
| CYP24A1 | 4.11 | SERHL2 | 2.24 | LSR | 0.49 | DEFB1 | 0.39 |
| CPB1 | 4.06 | TCP1 | 2.24 | FKBP11 | 0.48 | CD14 | 0.38 |
| NAIP | 4.05 | COIL | 2.23 | C1QA | 0.48 | S100A11 | 0.38 |
| MYBPC1 | 3.92 | NA | 2.23 | SNRPD2 | 0.48 | PTGDS | 0.38 |
| STC1 | 3.87 | PI15 | 2.22 | IFITM1 | 0.47 | CX3CL1 | 0.37 |
| BMP5 | 3.71 | LONP2 | 2.21 | S100A11 | 0.47 | GSTA1 | 0.37 |
| GPR144 | 3.49 | ZBTB44 | 2.21 | BCL3 | 0.47 | SH3BGRL3 | 0.37 |
| CLCA2 | 3.41 | XRCC5 | 2.21 | STAG2 | 0.47 | PSPH | 0.37 |
| HPGD | 3.04 | FYCO1 | 2.20 | RPL13 | 0.47 | TGFB2 | 0.37 |
| NEDD4L | 2.94 | ZFC3H1 | 2.20 | GMFG | 0.47 | MAF | 0.36 |
| SERHL | 2.93 | ERBB4 | 2.19 | APOC1 | 0.47 | PLTP | 0.36 |
| HMGCS2 | 2.90 | GOLGA8B | 2.19 | GBP1 | 0.47 | G0S2 | 0.35 |
| STK32B | 2.86 | FRY | 2.19 | CITED2 | 0.47 | HSPG2 | 0.35 |
| TRIB2 | 2.81 | GATA3 | 2.19 | LTB | 0.46 | PI3 | 0.35 |
| BAT1 | 2.80 | ERMAP | 2.18 | TNFAIP2 | 0.46 | RARRES1 | 0.34 |
| C14ORF132 | 2.63 | NSF | 2.18 | PDZK1IP1 | 0.46 | RPS26 | 0.33 |
| ZNF167 | 2.60 | SIDT1 | 2.17 | H2AFX | 0.46 | S100A6 | 0.33 |
| GYG2 | 2.59 | RAB3GAP2 | 2.17 | ATP5E | 0.46 | NA | 0.33 |
| KCTD7 | 2.55 | GFRA1 | 2.16 | IGKC | 0.46 | NOV | 0.32 |
| PNMAL1 | 2.54 | GPRC5B | 2.16 | CRABP2 | 0.45 | VGLL1 | 0.31 |
| TTLL5 | 2.52 | ISG20L2 | 2.16 | NA | 0.45 | THBS1 | 0.31 |
| PDZK1 | 2.52 | BLCAP | 2.16 | CIITA | 0.45 | IGHA2 | 0.30 |
| DIO2 | 2.50 | GNB1 | 2.16 | TRBC1 | 0.45 | CCL19 | 0.30 |
| GPLD1 | 2.50 | ABAT | 2.15 | TRAF3IP3 | 0.45 | IGKC | 0.30 |
| LYST | 2.48 | STC2 | 2.15 | CX3CL1 | 0.45 | LOC100293440 | 0.29 |
| HSP90AB1 | 2.45 | IL20RA | 2.15 | RPL36 | 0.45 | IGL@ | 0.29 |
| FGFR3 | 2.44 | TTC19 | 2.15 | CD24 | 0.45 | IGKC | 0.29 |
| LANCL1 | 2.43 | TCF7L2 | 2.15 | SPP1 | 0.44 | CCL5 | 0.28 |
| NA | 2.41 | CEP68 | 2.15 | CCL8 | 0.44 | IGL@ | 0.27 |
| MAP4K5 | 2.41 | CPD | 2.14 | LTF | 0.44 | UBD | 0.27 |
| AKR1D1 | 2.40 | MME | 2.14 | FOSL2 | 0.44 | NA | 0.25 |
| PEX11B | 2.40 | YTHDF1 | 2.13 | LOC91316 | 0.44 | IGL@ | 0.25 |
| SERINC3 | 2.36 | KLF7 | 2.13 | C10ORF81 | 0.43 | MUC7 | 0.22 |
| FAM188A | 2.33 | AHNAK | 2.12 | FABP4 | 0.43 | LOC100291464 | 0.21 |
| PSMB1 | 2.33 | NA | 2.12 | JUNB | 0.43 | LYZ | 0.21 |
| TBC1D8B | 2.32 | MTUS1 | 2.12 | FABP7 | 0.43 | MGC29506 | 0.19 |
| TRIM37 | 2.32 | ADRA2A | 2.11 | RPL28 | 0.43 | S100A8 | 0.19 |
| HEY1 | 2.32 | TRIM36 | 2.11 | CXCL14 | 0.42 | IGL@ | 0.18 |
| MSMB | 2.31 | PTPRZ1 | 2.11 | LIF | 0.41 | CCL2 | 0.18 |
| RAB3GAP1 | 2.31 | MCCC2 | 2.11 | ID2 | 0.41 | S100A9 | 0.18 |
| NPY2R | 2.30 | ESR1 | 2.10 | C4BPA | 0.41 | CD52 | 0.17 |
| AXL | 2.30 | ITPR1 | 2.10 | TFEB | 0.41 | IGKC | 0.17 |
| SPRY1 | 2.30 | ADAM12 | 2.10 | AIF1 | 0.40 | IGLL3 | 0.13 |
| ABLIM1 | 2.30 | PIP4K2A | 2.09 | CCL3 | 0.40 | IGHM | 0.11 |
| STC1 | 2.30 | RYBP | 2.09 | TOP2A | 0.40 | IGL@ | 0.11 |
| RAB28 | 2.29 | POGK | 2.08 | STAB1 | 0.40 | CSN2 | 0.09 |
Probability scores calculated in BADGE ranged from 4.45E-8 to 1.81E-2
Fold change calculated in BADGE (see methods)
NA, not available; @, cannot distinguish between multiple gene family members
Validation of microarray data via quantitative real-time PCR (qPCR)
Seven genes were selected for qPCR validation of gene expression data (ABLIM, AHNAK, CRABP2, CX3CL1, CXCL14, ESR1, and NEDD4L), based on consistent expression among cases within ER+ and ER- groups, mean probe expression ≥200, >2-fold difference in expression between the groups, a strongly significant p-value, and biological relevance to cancer. Several of the genes have been implicated in breast cancer-associated pathways (e.g., ESR1 is the estrogen receptor; CRABP2 is involved in retinoic acid pathway; CX3CL1 and CXCL14 are involved in the immune response). An endogenous control gene, CPSF6, was selected based on consistent expression between groups, and a probe expression greater than 200. For each gene, we selected intron-spanning TaqMan assays (ABI, Foster City, CA) that overlapped with the Affy probe target on the HU-133A chip and that generated amplicons <110 nucleotides.
For each qPCR, 2ng unamplified RNA was reverse transcribed using random hexamers with the TaqMan Multiscript RT reagent kit (ABI). For each sample, the dCT value for each test gene was calculated by subtracting the CT value of the reference gene, CPSF6, from the CT value of the test gene. For both the NlEpiER+ and NlEpiER-groups, each test gene’s mean dCT value and standard error of the mean were calculated using a one-tailed 2-sample t-test (from the data analysis package in Microsoft Excel). To assess each test gene in individual samples, the dCT value for individual NlEpiER- samples was compared to the mean dCT value for the NlEpiER+ samples, and the dCT values for individual NlEpiER+ samples were compared to the mean dCT value for the NlEpiER- samples. For each comparison, we defined validation as expression in the direction predicted by microarray analysis. These individual assessments generated the rates of validation described in the text.
For graphical presentation of quantified and summarized qPCR results, mean ddCT values for each gene were calculated by subtracting the mean dCT value of the reference group (NlEpiER+, as defined in the microarray analysis) from the mean dCT value of the test group (NlEpiER-). Data were plotted as 2-ddCT (mean fold change) using Graph Pad prism software. To determine whether dCT valued differed between groups, we used a one-tailed two-sample t-test assuming equal variances to compare dCT values for individual samples between groups. Significantly different dCT values (p < 0.05) are denoted by an asterisk.
Annotation and analysis of differentially expressed genes
The list of differentially expressed genes was compared to published datasets and was uploaded into DAVID2 and analyzed with the Functional Annotation Enrichment Analysis to determine overrepresented GO terms and PANTHER functions. Ingenuity Pathway Analysis3 was also used to identify biological functions, canonical pathways, and functional gene classification terms.
Comparison of NlEpi Gene Expression to Existing Breast Cancer Gene Expression Datasets
In order to compare gene expression in NlEpi with invasive breast cancer, we used a publicly available breast cancer gene expression dataset (26). The dataset was downloaded from NCBI’s Gene Expression Omnibus (GEO) database with accession number GSE3494. To be compatible with this dataset, we also recalculated the signal intensity from the 30 NlEpi samples’ .cel files using the RMA algorithm (27). To investigate how previously reported ER-related genes are expressed in NlEpi, we retrieved three lists of genes that distinguish ER+ from ER- breast cancers (28-30). These gene lists were mapped to our own expression data using official gene symbol as a common ID. When multiple probes in our gene expression dataset corresponded to the same gene ID in the published gene lists, we used only the probe with highest average expression level across all samples. Differentially expressed genes were selected using a simple t-test with a correction for multiple hypotheses testing (false discovery rate [FDR]).
Results
Identification of genes that are differentially expressed between NlEpiER+ compared to NlEpiER-
Cases were selected for microarray analysis based on tumor immunohistochemical staining for ER. Then, 15 ER+ cases were each age-matched to an ER- case, to minimize age-related differences in gene expression (19-21). Based on sample availability, individual cases could not be directly matched for ethnicity, cancer stage or distance of the NlEpi sample from the tumor. Table 1 presents clinical-pathologic information for these 30 cases. NlEpi was microdissected from each case. RNA was isolated, amplified and used for microarray analysis (see Methods).
Using BADGE (23) and then applying an extrinsic leave-one-out 80% cross-validation, we identified 216 probes, reflecting 198 genes, that were significantly differentially expressed between NlEpiER+ compared to NlEpiER-. These are presented in Table 2 (by relative fold-change) and in Table S2 (alphabetically). Of the 216 probes, 115 (53.2%), corresponding to 111 genes, had a higher gene expression in NlEpiER+ samples, and 101 (46.8%), corresponding to 87 genes, had a higher gene expression in NlEpiER- samples. Six genes were represented by multiple probes and 5 probes represented unidentified targets. As expected, and as shown in Figure 1, unsupervised clustering analysis utilizing the 216 probes separated the samples based on ER status.
Figure 1. Clustering of NlEpi Samples Based on Gene Expression.
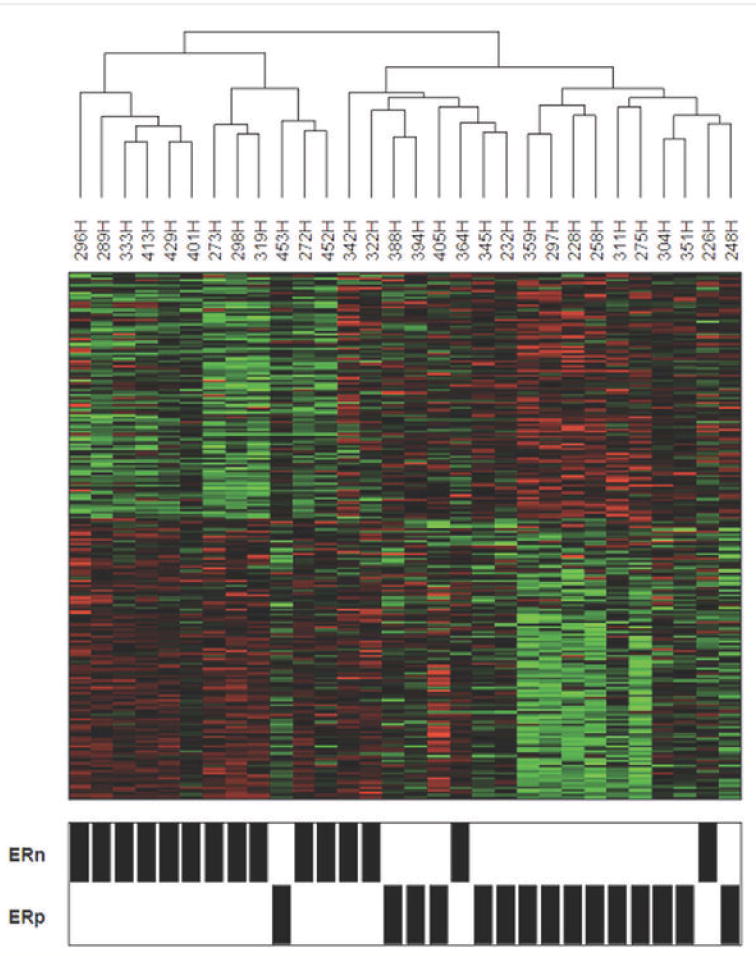
Clustering of the 30 NlEpi samples using the 216 probes identified as differentially expressed between the NlEpiER+ (ERp) and NlEpiER- (ER-) samples. The relative abundance of each transcript for each sample is represented as a colored block showing fold changes greater than 2 in either direction.
For validation of these expression data, we used qPCR, selecting primers for 7 of the differentially expressed genes (ABLIM, AHNAK, CRABP2, CX3CL1, CXCL14, ESR1, NEDD4L), and one endogenous control gene (CPSF6). We first tested the microarray data on unamplified RNA that remained from 15 of the 30 cases used for the microarray analysis (7 ER+ and 8 ER-), in a technical validation of the microarray data. We examined the 7 genes’ expression in 6-8 of these samples. Overall, 43/51 (84%) reactions validated the microarray data, with 5 of the 7 genes confirming the microarray data in every sample tested (CRABP2, CX3CL1, CXCL14, ESR1, NEDD4L, 100% of PCRs validated), and 2 of the 7 genes not confirming the microarray (AHNAK and ABLIM, 43% of PCRs validated). When we calculated mean fold change in expression for each gene between groups, we found that the mean fold change was in the expected direction for 5 of the genes (CRABP2, ESR1, NEDD4L, CX3CL1 and CSCL14) as shown in Figure 2A.
Figure 2. qPCR Validation of Microarray Data.
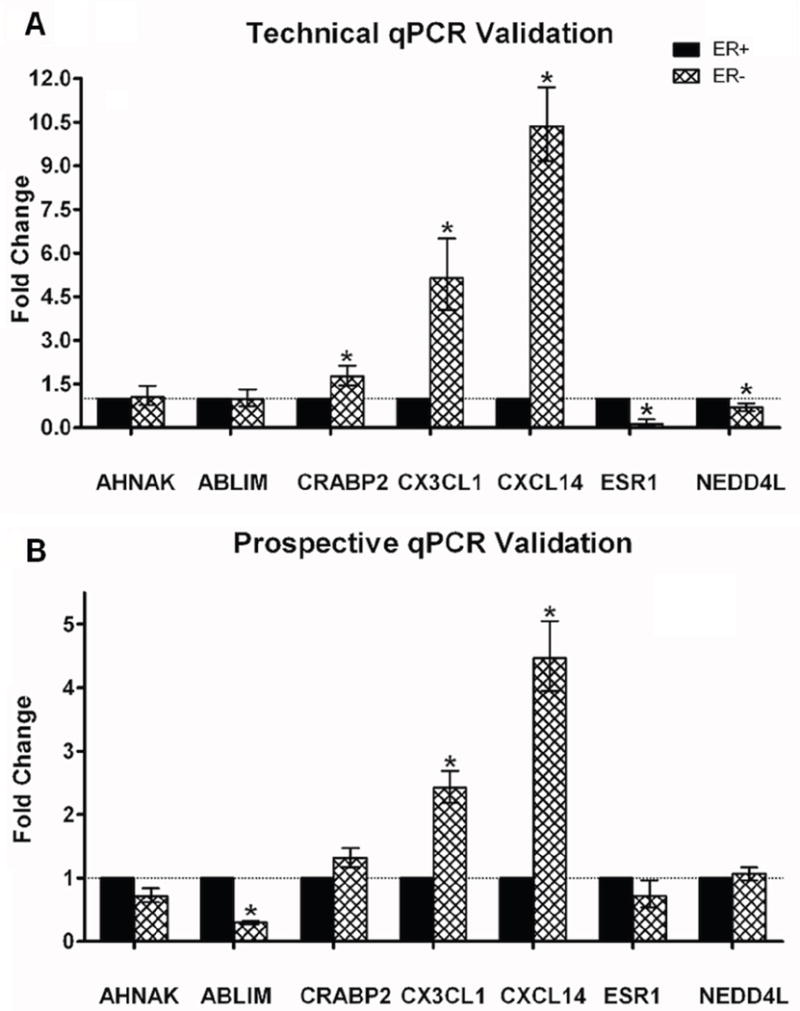
A. qPCR results using unamplified RNA from the original samples (technical validation). B. qPCR results using unamplified RNA from independent samples (prospective validation). Each panel shows qPCR results for 7 genes tested. The 7 test genes are listed on the X-axis, and the mean fold change of expression is shown on the Y-axis. NlEpiER+ serves as the reference group. Fold changes were calculated using the ddCT method, where fold change data are represented as 2-ddCT. Error bars depict the standard error of the mean dCT values. Significantly different dCT values (p < 0.05) are denoted by an asterisk.
Testing the gene expression profile in independent cases of NlEpi from breasts with ER+ and ER- breast cancers
Next, we tested the gene expression data on NlEpi from an independent set of breast cancer cases. For this prospective validation, we used the same techniques to obtain RNA from NlEpi of 16 independent cases (9 ER+ and 7 ER-) with similar clinical-pathological features as the 30 cases used for microarray analysis (see Table S1). We then tested these 16 cases with each of the 7 qPCR primers. Overall, 82/106 (77%) reactions validated the microarray data. When we calculated mean fold change in expression for each gene between groups, we found that 3 of the 7 genes (ABLIM, CX3CL1, CXCL14) confirmed the microarray results. Mean fold changes were in the expected direction for another 3 genes (AHNAK, CRABP2, ESR1), but did not reach significance, perhaps due to the small number of cases. The non-validating PCRs were distributed evenly across all 16 cases. These results are shown in Figure 2B.
Annotation of the ER+ vs ER- NlEpi gene expression profile
The 216-probe list was analyzed with DAVID and Ingenuity, which together identified functional categories implicated in carcinogenesis, including cell adhesion, motility, transcription, cell cycle, immune response and hormonal activity and regulation (see Table S3 and Figure S2). The 198 unique genes (see Tables 2 and S2) included genes known to be involved in ER function or characteristic of ER+ tumors. These genes were overexpressed in NlEpiER+ compared to NlEpiER-. Examples include ESR1 itself (28, 31, 32), ABAT (33), GATA3 (28, 32, 34-36), GFRA1 (33), PDZK1 (33), STC2 (28, 33) and ERBB4 (29). Similarly, genes characteristic of ER- cancers were relatively overexpressed in NlEpiER- compared to NLEpiER+. Examples include CX3CL1 (33), FABP7 (33), GBP1 (37), KRT23 (38), RARRES1 (33), S100A8 (33) and THBS1 (28). In addition, the 198 genes included family members of genes implicated in breast cancer, such as multiple ribosomal-related proteins and S100 calcium binding proteins, which were all overexpressed in NlEpiER-, and YWHAZ, an antiapoptotic protein, associated with anthracycline resistance (39), which was overexpressed in NlEpiER+.
We noted multiple immune-related genes’ expression was increased in NlEpi of ER-cancers. At least 18/86 (21%) of the genes with higher expression in NlEpi of ER-cancers are immune-related (e.g., CXCL1, multiple CCLs, multiple Ig genes). To examine whether these genes were expressed in the epithelium or were due to an increase in the number of infiltrating lymphocytes, we performed immunohistochemistry for p63 (a myoepithelial cell marker) and LCA (a pan-leucocyte marker) on adjacent sections of a representative subgroup of cases (7 ER+ and 11 ER-). The number of lymphocytes (LCA+ cells with characteristic morphology) per TDLU was determined by a pathologist blinded to ER status. No difference in the number of lymphocytes per TDLU was seen between the ER+ and ER- cases (see Table S4 and Figure S3). Thus, increased expression of immune-related genes in NlEpiER- compared to NlEpiER+ is not due to quantitative differences in lymphocyte infiltration.
Gene Set Enrichment Analysis (GSEA) analysis of the whole NlEpi expression dataset identified overexpression of keratin genes in the NlEpiER- group (FDR < 0.25). The keratin genes in the gene set included markers of basal breast cancers (KRT17, KRT15, KRT13, KRT6B, KRT5) (40) and also of luminal breast cancers (KRT8, KRT18). Two other gene sets of interest that were differentially expressed (although with higher FDR) included ribosomal genes, which were also overexpressed in the NlEpiER- group, and genes defining ER, which were overexpressed in the NlEpiER+ group. These results are depicted in Figures S4-S7.
Comparison of NlEpi gene expression to invasive breast cancer gene expression
We wished to compare gene expression in NlEpi to gene expression in invasive breast cancers. We first compared the expression pattern of the 216 probes in our dataset to their expression pattern in a publicly available breast cancer gene expression dataset. We used the dataset of Miller et al (26) because ER status is provided and it is based on the same platform (Affymetrix U133A) as the present study. Figure 3 shows side by side the expression pattern of the 216 probes in our 30 NlEpi samples and the 247 breast cancers. We find that 115 of the 216 (53%) probes, representing 103 genes, are differentially expressed (FDR<0.05) in ER+ compared to ER- breast tumors. Even though about half of the 216 probes are not significantly different between ER+ and ER-breast tumors, Figure 3 shows that the overall pattern is quite similar for most of 216 probes between NlEpi and tumors.
Figure 3. Gene expression in histologically normal breast epithelium (NlEpi) compared to invasive breast cancer.
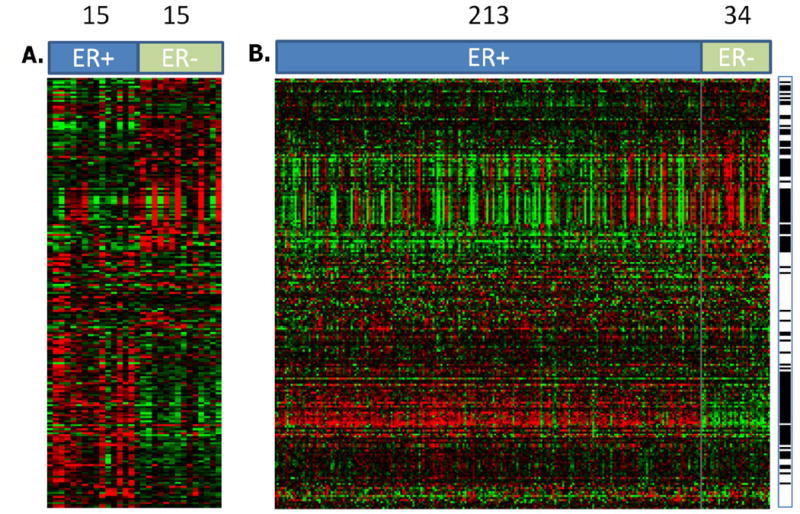
Each row is a probe, each column is a sample. A. Expression pattern of the 216 probes that show differential expression between NlEpiER+ and NlEpiER- ER+ indicates our 15 NlEpi ER+ samples, ER- indicates our 15 NlEpi ER- samples. B. Expression of the same 216 probes in the breast cancer data set of Miller et al (26). The probes (rows) are in same order in A and B. ER+ indicates the 213 ER+ cancers, ER- indicates the 34 ER- cancers. The black bars at the right indicates whether a gene’s expression is statistically different between ER+ compared to ER- breast cancer at P<0.05. Numbers across the top indicate the number of samples (NlEpi in A, cancers in B). Red indicates relative overexpression, green indicates relative underexpression.
Next, we wished to investigate how genes previously reported to distinguish ER+ from ER- cancers are expressed in NlEpi. Therefore, we retrieved three gene lists reported previously to be differentially expressed in ER+ vs. ER- breast cancers, and analyzed the genes’ expression in our NlEpi dataset (28-30). We found that 25%-31% of the genes that distinguish ER+ from ER- cancers are also differentially expressed in NlEpiER+ compared to NlEpiER-. These results are shown in Figure 4. Specifically, in the Tozlu gene list (29), 11 of 35 (31%) genes overexpressed in ER+ cancers are also over-expressed in NlEpiER+ (FDR<0.05). These genes include ESR1, GATA3, BCL2, MYB, AR, STC2 and ERBB4. In the Gruvberger gene list (28) 9 of the 36 (25%) genes distinguishing ER+ from ER- cancers are also differentially expressed (FDR<0.05), in NlEpiER+ compared to NlEpiER-. These include ESR1, GATA3, STC2 (up in both NlEpiER+ and ER+ cancers) and CDH3, EGFR, S100A8 (up in both NlEpiER- and ER-cancers). In the Van’t Veer gene lists (30), 76 of the 248 (31%) genes whose expression distinguishes ER+ from ER- breast cancers are also differentially expressed (FDR<0.05), in NlEpiER+ compared to NlEpiER-. These genes include classic components of the luminal A signature, ESR1 and GATA3, as well ERBB4, BCL2 and MYB, which are all over-expressed in NlEpiER+, and genes marking basal tumors: CDH3, CXC3L1, FAPB7 and KRT23 which are all over-expressed in NlEpiER-.
Figure 4. Expression of genes that distinguish ER+ from ER- invasive breast cancer in histologically normal breast epithelium (NlEpi).
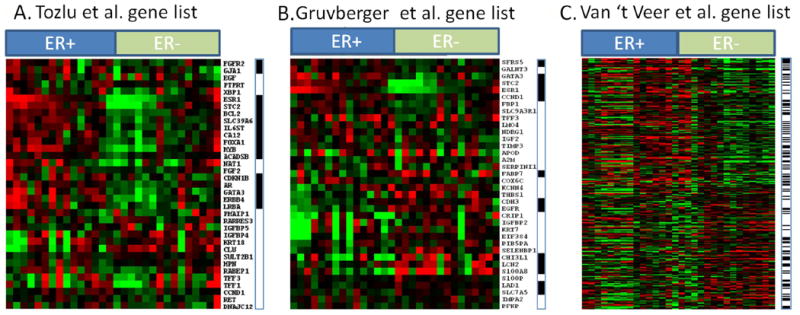
Each panel shows results from one comparison. Each comparison takes a gene list that distinguishes ER+ from ER- invasive breast cancer (28-30) and examines each gene’s expression in the NlEpi samples. Within each panel, each row is a gene from the invasive cancer study and each column is a NlEpi sample. Across the top of each panel, ER+ indicates the 15 NlEpiER+ samples; ER- indicates the 15 NlEpiER- samples. A black horizontal bar at the right of each panel indicates whether a gene distinguishing ER+ from ER- invasive cancer is differentially expressed (P<0.05) in NlEpiER+ vs NlEpiER-. Red indicates relative overexpression, green indicates relative underexpression. A. Tozlu gene list. 11 of the 35 genes show significantly higher expression in the “correct” direction in our NlEpiER+ and NlEpiER- sample. In this gene list, all 11 significant genes happen to be over expressed in the NlEpiER+ compared to NlEpiER- samples. B. Gruvberger gene list. 9 of the 36 genes show significantly higher expression in the “correct” direction in our NlEpiER+ and NlEpiER- samples. C. Van’t Veer gene list. 76 of the 248 genes show significantly higher expression in the “correct” direction in our NlEpiER+ and NlEpiER- samples.
In each comparison between NlEpi gene expression and an external dataset, many genes were not differentially expressed, and a small number were differentially expressed in the “wrong” direction. The proportion of these “wrongly directed” genes was always smaller than the proportion of “rightly directed” genes, and the proportion decreased as cancer sample size increased, suggesting that “wrongly directed” genes represent a combination of small sample size and microarray related artifacts. Specifically, in the Tozlu dataset (29), there were 0/35 (0%) genes in the “wrong” direction compared to 11/35 (31%) in the “right” direction; in the Gruvberger dataset (28), there were 5/36 (14%) compared to 9/36 (25%); in the Van’t Veer dataset (30), there were 9/248 (4%) compared to 78/248 (31%), and in the Miller dataset (26), there were 7/216 (3%) probes compared to 115/216 (53%).
In sum, we found overlap between NlEpi and the corresponding cancer subset in 25%-53% of the genes or probes examined. Since the NlEpi was microdissected, but the cancer gene expression datasets were derived from cancers that were not microdissected, and thus contain heterogeneous cell types, the similarities between NlEpi and cancer gene expression may be underestimated.
Discussion
We investigated gene expression in histologically normal breast epithelium microdissected from breasts with either ER+ or ER- breast cancers. We found that gene expression in NlEpiER+ differs from gene expression in NlEpiER-, and that gene expression in each type of NlEpi resembles expression of the corresponding type of invasive breast cancer (i.e., ER+ or ER-).
There are several possible (and not mutually exclusive) explanations for our findings. One explanation is that the NlEpi gene expression profile reflects the influence of the extracellular environment. The extracellular environment unquestionably plays a crucial role in cancer development, and likely acts prior to tumor invasion (24, 41, 42). A co-incident cancer could influence NlEpi gene expression, although our previous findings suggest that neither contamination nor paracrine effects of a cancer would explain aberrant NlEpi gene expression (18). An intriguing possibility is that particular women may be predisposed to develop particular tumor subtypes due to inherited susceptibility genes. Evidence supporting this explanation includes the finding that gene expression is significantly influenced by germline polymorphisms (43), and the observation that components of breast cancer’s prognostic signatures are present in non-neoplastic tissue of susceptible animals (44). Alternatively, the NlEpi gene expression profile could reflect a field effect in some part of the breast (for review see (17)) that results in a predisposition for that area to transform into a particular cancer subtype. We do not know the size of the field since we have not comprehensively sampled distinct geographic regions of the breast. This model might be particularly relevant to women who are BRCA gene mutation carriers. Finally, combined with our previous finding that gene expression in NlEpi from women at high risk of breast cancer can resemble gene expression in NlEpi from cancer-containing breasts, the present findings suggest that characteristic features of breast cancer subgroups may be detectable prior to histologic abnormalities. The NlEpi gene expression profile could demonstrate some of the earliest genomic changes of ER+ and ER- cancers. These changes may be present before histologic abnormality, either in cancer initiating cells or in cells that eventually develop into the tumor. The relationship between the NlEpi abnormalities and any intratumoral heterogeneity that eventually develops is unknown (45, 46).
Regardless of which explanation(s) is correct, analysis of NlEpi gene expression and comparison to 4 independent cancer datasets offer insight into events occurring early in carcinogenesis. In particular, NlEpi expression of ER and associated co-factors and downstream signals seems fundamental to the development of ER+ cancers. Conversely, expression of these genes is absent in NlEpi associated with ER- cancers. This observation is consistent with the substantial benefits of anti-estrogens in preventing only ER+ cancers (1, 47, 48). ER- tumors have no signature feature analogous to ER expression, and may be more heterogeneous than ER+ tumors (49). A consequence is that prevention and treatment is less successful for ER- tumors than for ER+ tumors. More generally, the overlap between genes and probes differentially expressed in NlEpi subtypes and in the corresponding cancer subtype is striking (36%-53% of the genes or probes examined). This observation suggests that histologically normal epithelium may be quite genomically active and that additional genome-wide approaches to investigate the NlEpi landscape could be highly promising.
The various analyses of NlEpi gene expression results suggested several directions that would be worthwhile pursuing. Examination of the gene list itself suggested that immune-related genes’ expression was generally increased in NlEpiER-, and was not due to an increase in number of infiltrating lymphocytes. One possible explanation is that the lymphocytes infiltrating NlEpiER- differ from those infiltrating NlEpiER+ and generate a distinct signature. Another possible explanation may be found in recent reports of high expression of immunomodulatory genes in ER- breast cancers composed predominantly of epithelial cells and lacking lymphocytic infiltrates (49, 50). The immunomodulatory gene expression in this setting may be associated with good prognosis, and is consistent with data from cell lines (51). Furthermore, immunoglobulin genes themselves have been reported to be expressed in breast cancer cells and breast cancer cell lines (52-55). This area would be promising to investigate further.
GSEA analysis of our expression data identified several gene sets that may differ between NlEpiER+ and NlEpiER-. ER-related genes were overexpressed in NlEpiER+, which seems to confirm the validity of our data. Ribosome-related genes and keratin genes were overexpressed in NlEpiER-. NlEpiER-’s overexpression of ribosomal genes may reflect increased cell metabolism and protein synthesis, or be related to lineage-specific cell fate (56). Overrepresentation of ribosomal genes has been reported in basal breast cancers (which are ER-) (57) and may be related to increased cell proliferation or MYC activity, which has also been reported by others (58). The explanation for overexpression of keratin genes is not clear, but one could speculate that it suggests alterations to the cells’ structural integrity, or even a response to signals from the extracellular environment. Unlike the BADGE-derived gene list and the DAVID analyses, GSEA did not identify immune function as an overrepresented category; this may be due to separate analytic approaches.
This study has limitations. One is its small sample size, which is due to the logistic and technical challenges of obtaining and investigating fresh tissue of untreated patients. To counterbalance this limitation, we adopted a study design suitable for small sample size: the cases in each group were tightly age-matched (since age exerts a major influence on gene expression in the breast (19-21)), the normal epithelium was microdissected away from other cells to enrich for a homogeneous cell population, we utilized a statistical approach appropriate for small sample size, we validated the microarray results on independent NlEpi samples and compared them to external cancer datasets. The study’s second limitation is the possibility that our NlEpi samples were contaminated by malignant cells. We made every effort to avoid this by having each section reviewed by a breast pathologist (A delas M) to diagnose each area on every tenth slide from each section: both histologically normal epithelium and any abnormal areas (cancerous or not) were marked. Every effort was made to avoid any non-normal area. Thus, we think it is unlikely that the microdissected samples were contaminated to any substantial extent.
In conclusion, gene expression differs in NlEpi of breasts containing ER+ compared to ER- breast cancers. These gene expression differences reflect the gene expression differences in ER+ compared to ER- cancers. This finding implies that genomic changes characteristic of specific breast cancer subtypes may be detectable before histologic evidence of abnormalities. Future work could examine whether gene expression characteristic of the breast cancer intrinsic or molecular subtypes (31, 32, 59) is detectable in NlEpi, and whether NlEpi gene expression reflects gene expression in each subtype. This would be clinically relevant since each subtype has characteristic genomic (31, 32, 59), clinical and pathological features (30, 60). Therefore, normal epithelium gene expression profiles could help define a breast cancer subtype-specific risk signature, identify the initial genomic differences between subtypes, and suggest new targets for prevention and therapy, which is especially important for ER- cancers.
Supplementary Material
Representative examples of 10um H&E stained guide sections demonstrating histologically normal epithelial cells identified for microdissection. 100X magnification.
Genes that serve as activators or effectors of the estrogen receptor pathway as identified in Ingenuity Pathways Analysis. The genes that are red have higher expression in NlEpiER+ than NlEpiER- samples, and the genes that are green have lower expression in NlEpiER+ than in NlEpiER- samples.
Ten uM sections were cut from representative ER+ and ER- samples and stained with H&E, p63, and LCA. Shown are stained sections from samples with low (405H, 342H) and high (304B, 226) percentages of lymphocyte invasion into the TDLUs. Magnification: First row (405H ER+) H+E 200x, P63 and LCA 100X; Second row (304BH ER+) all 200x; Third row (324H ER-) all 200x, Fourth row (226H ER-) all 100x.
The 30 NlEpi .cel files were analyzed by GSEA. Gene sets that were overexpressed in NlEpiER+ and in NlpiER- samples are listed in Figure S4. The enrichment plot and expression of keratin genes are shown in Figure S5. The enrichment plot and expression of ribosomal genes are shown in Figure S6. The enrichment plot and expression of ER related genes are shown in Figure S7.
198 unique genes (listed alphabetically) that are differentially expressed between NlEpi of breasts with ER+ compared to ER- cancers.
Clinical-pathological features of 16 independent cases whose histologically normal breast epithelium was used to validate the microarray data by qPCR.
Functional classification of genes distinguishing NlEpi of breasts with ER+ compared with ER- cancers.
Summary of immunohistochemistry results for p63 and LCA in NlEpi.
Acknowledgments
Funding: CLR was supported by PHS CA115434, the Avon Foundation and the LaPann funds. XG is supported by NIH grant GM083226.
List of Abbreviations
- BADGE
Bayesian Analysis of Differential Gene Expression
- ER
Estrogen Receptor alpha
- FDR
False Discovery Rate
- GEO
Gene Expression Omnibus Database Repository
- GSEA
Gene Set Enrichment Analysis
- HER2
Human Epidermal Growth Factor Receptor-2
- NlEpi
Histologically Normal Breast Epithelium
- NlEpiER+
NlEpi from breasts with ER+ cancers
- NlEpiER-
NlEpi from breasts with ER- cancers
- PR
Progesterone Receptor
- qPCR
Quantitative Real-Time PCR
- RM
Reduction Mammoplasty
- TDLU
Terminal Ducto-Lobular Unit
Footnotes
References
- 1.Fisher B, Costantino JP, Wickerham DL, et al. Tamoxifen for prevention of breast cancer: report of the National Surgical Adjuvant Breast and Bowel Project P-1 Study. J Natl Cancer Inst. 1998;90:1371–88. doi: 10.1093/jnci/90.18.1371. [DOI] [PubMed] [Google Scholar]
- 2.Tamoxifen for early breast cancer: an overview of the randomised trials. Early Breast Cancer Trialists’ Collaborative Group. Lancet. 1998;351:1451–67. [PubMed] [Google Scholar]
- 3.Effects of chemotherapy and hormonal therapy for early breast cancer on recurrence and 15-year survival: an overview of the randomised trials. Lancet. 2005;365:1687–717. doi: 10.1016/S0140-6736(05)66544-0. [DOI] [PubMed] [Google Scholar]
- 4.Ince TA, Richardson AL, Bell GW, et al. Transformation of different human breast epithelial cell types leads to distinct tumor phenotypes. Cancer Cell. 2007;12:160–70. doi: 10.1016/j.ccr.2007.06.013. [DOI] [PubMed] [Google Scholar]
- 5.Sgroi DC. Preinvasive breast cancer. Annu Rev Pathol. 5:193–221. doi: 10.1146/annurev.pathol.4.110807.092306. [DOI] [PMC free article] [PubMed] [Google Scholar]
- 6.Deng G, Lu Y, Zlotnikov G, Thor AD, Smith HS. Science. Vol. 274. New York, NY: 1996. Loss of heterozygosity in normal tissue adjacent to breast carcinomas; pp. 2057–9. [DOI] [PubMed] [Google Scholar]
- 7.Yan PS, Venkataramu C, Ibrahim A, et al. Mapping geographic zones of cancer risk with epigenetic biomarkers in normal breast tissue. Clin Cancer Res. 2006;12:6626–36. doi: 10.1158/1078-0432.CCR-06-0467. [DOI] [PubMed] [Google Scholar]
- 8.Clarke CL, Sandle J, Jones AA, Sofronis A, Patani NR, Lakhani SR. Mapping loss of heterozygosity in normal human breast cells from BRCA1/2 carriers. Br J Cancer. 2006;95:515–9. doi: 10.1038/sj.bjc.6603298. [DOI] [PMC free article] [PubMed] [Google Scholar]
- 9.Grigoriadis A, Mackay A, Reis-Filho JS, et al. Establishment of the epithelial-specific transcriptome of normal and malignant human breast cells based on MPSS and array expression data. Breast Cancer Res. 2006;8:R56. doi: 10.1186/bcr1604. [DOI] [PMC free article] [PubMed] [Google Scholar]
- 10.Larson PS, de las Morenas A, Cupples LA, Huang K, Rosenberg CL. Genetically abnormal clones in histologically normal breast tissue. Am J Pathol. 1998;152:1591–8. [PMC free article] [PubMed] [Google Scholar]
- 11.Tripathi A, King C, de la Morenas A, et al. Gene expression abnormalities in histologically normal breast epithelium of breast cancer patients. Int J Cancer. 2008;122:1557–66. doi: 10.1002/ijc.23267. [DOI] [PubMed] [Google Scholar]
- 12.Larson PS, de las Morenas A, Bennett SR, Cupples LA, Rosenberg CL. Loss of heterozygosity or allele imbalance in histologically normal breast epithelium is distinct from loss of heterozygosity or allele imbalance in co-existing carcinomas. Am J Pathol. 2002;161:283–90. doi: 10.1016/S0002-9440(10)64180-6. [DOI] [PMC free article] [PubMed] [Google Scholar]
- 13.Larson PS, Schlechter BL, de las Morenas A, Garber JE, Cupples LA, Rosenberg CL. Allele imbalance, or loss of heterozygosity, in normal breast epithelium of sporadic breast cancer cases and BRCA1 gene mutation carriers is increased compared with reduction mammoplasty tissues. J Clin Oncol. 2005;23:8613–9. doi: 10.1200/JCO.2005.02.1451. [DOI] [PubMed] [Google Scholar]
- 14.Batchelder AJ, Gordon-Weeks AN, Walker RA. Altered expression of anti-apoptotic proteins in non-involved tissue from cancer-containing breasts. Breast cancer research and treatment. 2009;114:63–9. doi: 10.1007/s10549-008-9988-2. [DOI] [PubMed] [Google Scholar]
- 15.Ding L, Erdmann C, Chinnaiyan AM, Merajver SD, Kleer CG. Identification of EZH2 as a molecular marker for a precancerous state in morphologically normal breast tissues. Cancer research. 2006;66:4095–9. doi: 10.1158/0008-5472.CAN-05-4300. [DOI] [PubMed] [Google Scholar]
- 16.Van der Auwera I, Bovie C, Svensson C, et al. Quantitative methylation profiling in tumor and matched morphologically normal tissues from breast cancer patients. BMC Cancer. 10:97. doi: 10.1186/1471-2407-10-97. [DOI] [PMC free article] [PubMed] [Google Scholar]
- 17.Heaphy CM, Griffith JK, Bisoffi M. Mammary field cancerization: molecular evidence and clinical importance. Breast Cancer Res Treat. 2009 doi: 10.1007/s10549-009-0504-0. [DOI] [PubMed] [Google Scholar]
- 18.Graham K, de Las Morenas A, Tripathi A, et al. Gene expression in histologically normal epithelium from breast cancer patients and from cancer-free prophylactic mastectomy patients shares a similar profile. Br J Cancer. doi: 10.1038/sj.bjc.6605576. [DOI] [PMC free article] [PubMed] [Google Scholar]
- 19.Anders CK, Acharya CR, Hsu DS, et al. Age-specific differences in oncogenic pathway deregulation seen in human breast tumors. PLoS One. 2008;3:e1373. doi: 10.1371/journal.pone.0001373. [DOI] [PMC free article] [PubMed] [Google Scholar]
- 20.Euhus DM, Bu D, Milchgrub S, et al. DNA methylation in benign breast epithelium in relation to age and breast cancer risk. Cancer Epidemiol Biomarkers Prev. 2008;17:1051–9. doi: 10.1158/1055-9965.EPI-07-2582. [DOI] [PubMed] [Google Scholar]
- 21.Yau C, Fedele V, Roydasgupta R, et al. Aging impacts transcriptomes but not genomes of hormone-dependent breast cancers. Breast Cancer Res. 2007;9:R59. doi: 10.1186/bcr1765. [DOI] [PMC free article] [PubMed] [Google Scholar]
- 22.King C, Guo N, Frampton GM, Gerry NP, Lenburg ME, Rosenberg CL. Reliability and reproducibility of gene expression measurements using amplified RNA from laser-microdissected primary breast tissue with oligonucleotide arrays. J Mol Diagn. 2005;7:57–64. doi: 10.1016/S1525-1578(10)60009-8. [DOI] [PMC free article] [PubMed] [Google Scholar]
- 23.Sebastiani P, Xe H, Ramoni MF. Bayesian analysis of comparative microarray experiments by model averaging. Bayesian Analysis Journal. 2006;1:707–32. [Google Scholar]
- 24.Emery LA, Tripathi A, King C, et al. Early dysregulation of cell adhesion and extracellular matrix pathways in breast cancer progression. Am J Pathol. 2009;175:1292–302. doi: 10.2353/ajpath.2009.090115. [DOI] [PMC free article] [PubMed] [Google Scholar]
- 25.Singh D, Febbo PG, Ross K, et al. Gene expression correlates of clinical prostate cancer behavior. Cancer Cell. 2002;1:203–9. doi: 10.1016/s1535-6108(02)00030-2. [DOI] [PubMed] [Google Scholar]
- 26.Miller LD, Smeds J, George J, et al. An expression signature for p53 status in human breast cancer predicts mutation status, transcriptional effects, and patient survival. Proc Natl Acad Sci U S A. 2005;102:13550–5. doi: 10.1073/pnas.0506230102. [DOI] [PMC free article] [PubMed] [Google Scholar]
- 27.Irizarry RA, Bolstad BM, Collin F, Cope LM, Hobbs B, Speed TP. Summaries of Affymetrix GeneChip probe level data. Nucleic Acids Res. 2003;31:e15. doi: 10.1093/nar/gng015. [DOI] [PMC free article] [PubMed] [Google Scholar]
- 28.Gruvberger S, Ringner M, Chen Y, et al. Estrogen receptor status in breast cancer is associated with remarkably distinct gene expression patterns. Cancer Res. 2001;61:5979–84. [PubMed] [Google Scholar]
- 29.Tozlu S, Girault I, Vacher S, et al. Identification of novel genes that co-cluster with estrogen receptor alpha in breast tumor biopsy specimens, using a large-scale real-time reverse transcription-PCR approach. Endocr Relat Cancer. 2006;13:1109–20. doi: 10.1677/erc.1.01120. [DOI] [PubMed] [Google Scholar]
- 30.van ’t Veer LJ, Dai H, van de Vijver MJ, et al. Gene expression profiling predicts clinical outcome of breast cancer. Nature. 2002;415:530–6. doi: 10.1038/415530a. [DOI] [PubMed] [Google Scholar]
- 31.Perou CM, Sorlie T, Eisen MB, et al. Molecular portraits of human breast tumours. Nature. 2000;406:747–52. doi: 10.1038/35021093. [DOI] [PubMed] [Google Scholar]
- 32.Sorlie T, Perou CM, Tibshirani R, et al. Gene expression patterns of breast carcinomas distinguish tumor subclasses with clinical implications. Proc Natl Acad Sci U S A. 2001;98:10869–74. doi: 10.1073/pnas.191367098. [DOI] [PMC free article] [PubMed] [Google Scholar]
- 33.Wirapati P, Sotiriou C, Kunkel S, et al. Meta-analysis of gene expression profiles in breast cancer: toward a unified understanding of breast cancer subtyping and prognosis signatures. Breast Cancer Res. 2008;10:R65. doi: 10.1186/bcr2124. [DOI] [PMC free article] [PubMed] [Google Scholar]
- 34.Eeckhoute J, Keeton EK, Lupien M, Krum SA, Carroll JS, Brown M. Positive cross-regulatory loop ties GATA-3 to estrogen receptor alpha expression in breast cancer. Cancer Res. 2007;67:6477–83. doi: 10.1158/0008-5472.CAN-07-0746. [DOI] [PubMed] [Google Scholar]
- 35.Wilson BJ, Giguere V. Meta-analysis of human cancer microarrays reveals GATA3 is integral to the estrogen receptor alpha pathway. Mol Cancer. 2008;7:49. doi: 10.1186/1476-4598-7-49. [DOI] [PMC free article] [PubMed] [Google Scholar]
- 36.Mehra R, Varambally S, Ding L, et al. Identification of GATA3 as a breast cancer prognostic marker by global gene expression meta-analysis. Cancer Res. 2005;65:11259–64. doi: 10.1158/0008-5472.CAN-05-2495. [DOI] [PubMed] [Google Scholar]
- 37.Creighton CJ. A gene transcription signature associated with hormone independence in a subset of both breast and prostate cancers. BMC Genomics. 2007;8:199. doi: 10.1186/1471-2164-8-199. [DOI] [PMC free article] [PubMed] [Google Scholar]
- 38.Herschkowitz JI, Simin K, Weigman VJ, et al. Identification of conserved gene expression features between murine mammary carcinoma models and human breast tumors. Genome Biol. 2007;8:R76. doi: 10.1186/gb-2007-8-5-r76. [DOI] [PMC free article] [PubMed] [Google Scholar]
- 39.Li Y, Zou L, Li Q, et al. Amplification of LAPTM4B and YWHAZ contributes to chemotherapy resistance and recurrence of breast cancer. Nat Med. 16:214–8. doi: 10.1038/nm.2090. [DOI] [PMC free article] [PubMed] [Google Scholar]
- 40.Charafe-Jauffret E, Ginestier C, Monville F, et al. Gene expression profiling of breast cell lines identifies potential new basal markers. Oncogene. 2006;25:2273–84. doi: 10.1038/sj.onc.1209254. [DOI] [PubMed] [Google Scholar]
- 41.Troester MA, Lee MH, Carter M, et al. Activation of host wound responses in breast cancer microenvironment. Clin Cancer Res. 2009;15:7020–8. doi: 10.1158/1078-0432.CCR-09-1126. [DOI] [PMC free article] [PubMed] [Google Scholar]
- 42.Ma XJ, Dahiya S, Richardson E, Erlander M, Sgroi DC. Gene expression profiling of the tumor microenvironment during breast cancer progression. Breast Cancer Res. 2009;11:R7. doi: 10.1186/bcr2222. [DOI] [PMC free article] [PubMed] [Google Scholar]
- 43.Schadt EE, Monks SA, Drake TA, et al. Genetics of gene expression surveyed in maize, mouse and man. Nature. 2003;422:297–302. doi: 10.1038/nature01434. [DOI] [PubMed] [Google Scholar]
- 44.Lukes L, Crawford NP, Walker R, Hunter KW. The origins of breast cancer prognostic gene expression profiles. Cancer Res. 2009;69:310–8. doi: 10.1158/0008-5472.CAN-08-3520. [DOI] [PMC free article] [PubMed] [Google Scholar]
- 45.Allred DC, Wu Y, Mao S, et al. Ductal carcinoma in situ and the emergence of diversity during breast cancer evolution. Clin Cancer Res. 2008;14:370–8. doi: 10.1158/1078-0432.CCR-07-1127. [DOI] [PubMed] [Google Scholar]
- 46.Park SY, Gonen M, Kim HJ, Michor F, Polyak K. Cellular and genetic diversity in the progression of in situ human breast carcinomas to an invasive phenotype. J Clin Invest. 120:636–44. doi: 10.1172/JCI40724. [DOI] [PMC free article] [PubMed] [Google Scholar]
- 47.Fisher B, Costantino JP, Wickerham DL, et al. Tamoxifen for the prevention of breast cancer: current status of the National Surgical Adjuvant Breast and Bowel Project P-1 study. J Natl Cancer Inst. 2005;97:1652–62. doi: 10.1093/jnci/dji372. [DOI] [PubMed] [Google Scholar]
- 48.Vogel VG, Costantino JP, Wickerham DL, et al. Effects of tamoxifen vs raloxifene on the risk of developing invasive breast cancer and other disease outcomes: the NSABP Study of Tamoxifen and Raloxifene (STAR) P-2 trial. JAMA. 2006;295:2727–41. doi: 10.1001/jama.295.23.joc60074. [DOI] [PubMed] [Google Scholar]
- 49.Speers C, Tsimelzon A, Sexton K, et al. Identification of novel kinase targets for the treatment of estrogen receptor-negative breast cancer. Clin Cancer Res. 2009;15:6327–40. doi: 10.1158/1078-0432.CCR-09-1107. [DOI] [PMC free article] [PubMed] [Google Scholar]
- 50.Teschendorff AE, Miremadi A, Pinder SE, Ellis IO, Caldas C. An immune response gene expression module identifies a good prognosis subtype in estrogen receptor negative breast cancer. Genome Biol. 2007;8:R157. doi: 10.1186/gb-2007-8-8-r157. [DOI] [PMC free article] [PubMed] [Google Scholar]
- 51.Neve RM, Chin K, Fridlyand J, et al. A collection of breast cancer cell lines for the study of functionally distinct cancer subtypes. Cancer Cell. 2006;10:515–27. doi: 10.1016/j.ccr.2006.10.008. [DOI] [PMC free article] [PubMed] [Google Scholar]
- 52.Babbage G, Ottensmeier CH, Blaydes J, Stevenson FK, Sahota SS. Immunoglobulin heavy chain locus events and expression of activation-induced cytidine deaminase in epithelial breast cancer cell lines. Cancer Res. 2006;66:3996–4000. doi: 10.1158/0008-5472.CAN-05-3704. [DOI] [PubMed] [Google Scholar]
- 53.Chen Z, Gu J. Immunoglobulin G expression in carcinomas and cancer cell lines. FASEB J. 2007;21:2931–8. doi: 10.1096/fj.07-8073com. [DOI] [PubMed] [Google Scholar]
- 54.Qiu X, Zhu X, Zhang L, et al. Human epithelial cancers secrete immunoglobulin g with unidentified specificity to promote growth and survival of tumor cells. Cancer Res. 2003;63:6488–95. [PubMed] [Google Scholar]
- 55.Zheng J, Huang J, Mao Y, et al. Immunoglobulin gene transcripts have distinct VHDJH recombination characteristics in human epithelial cancer cells. J Biol Chem. 2009;284:13610–9. doi: 10.1074/jbc.M809524200. [DOI] [PMC free article] [PubMed] [Google Scholar]
- 56.Young DW, Hassan MQ, Pratap J, et al. Mitotic occupancy and lineage-specific transcriptional control of rRNA genes by Runx2. Nature. 2007;445:442–6. doi: 10.1038/nature05473. [DOI] [PubMed] [Google Scholar]
- 57.Chandriani S, Frengen E, Cowling VH, et al. A core MYC gene expression signature is prominent in basal-like breast cancer but only partially overlaps the core serum response. PLoS One. 2009;4:e6693. doi: 10.1371/journal.pone.0006693. [DOI] [PMC free article] [PubMed] [Google Scholar]
- 58.Alles MC, Gardiner-Garden M, Nott DJ, et al. Meta-analysis and gene set enrichment relative to er status reveal elevated activity of MYC and E2F in the “basal” breast cancer subgroup. PLoS One. 2009;4:e4710. doi: 10.1371/journal.pone.0004710. [DOI] [PMC free article] [PubMed] [Google Scholar]
- 59.Sorlie T, Tibshirani R, Parker J, et al. Repeated observation of breast tumor subtypes in independent gene expression data sets. Proc Natl Acad Sci U S A. 2003;100:8418–23. doi: 10.1073/pnas.0932692100. [DOI] [PMC free article] [PubMed] [Google Scholar]
- 60.van de Vijver MJ, He YD, van’t Veer LJ, et al. A gene-expression signature as a predictor of survival in breast cancer. N Engl J Med. 2002;347:1999–2009. doi: 10.1056/NEJMoa021967. [DOI] [PubMed] [Google Scholar]
Associated Data
This section collects any data citations, data availability statements, or supplementary materials included in this article.
Supplementary Materials
Representative examples of 10um H&E stained guide sections demonstrating histologically normal epithelial cells identified for microdissection. 100X magnification.
Genes that serve as activators or effectors of the estrogen receptor pathway as identified in Ingenuity Pathways Analysis. The genes that are red have higher expression in NlEpiER+ than NlEpiER- samples, and the genes that are green have lower expression in NlEpiER+ than in NlEpiER- samples.
Ten uM sections were cut from representative ER+ and ER- samples and stained with H&E, p63, and LCA. Shown are stained sections from samples with low (405H, 342H) and high (304B, 226) percentages of lymphocyte invasion into the TDLUs. Magnification: First row (405H ER+) H+E 200x, P63 and LCA 100X; Second row (304BH ER+) all 200x; Third row (324H ER-) all 200x, Fourth row (226H ER-) all 100x.
The 30 NlEpi .cel files were analyzed by GSEA. Gene sets that were overexpressed in NlEpiER+ and in NlpiER- samples are listed in Figure S4. The enrichment plot and expression of keratin genes are shown in Figure S5. The enrichment plot and expression of ribosomal genes are shown in Figure S6. The enrichment plot and expression of ER related genes are shown in Figure S7.
198 unique genes (listed alphabetically) that are differentially expressed between NlEpi of breasts with ER+ compared to ER- cancers.
Clinical-pathological features of 16 independent cases whose histologically normal breast epithelium was used to validate the microarray data by qPCR.
Functional classification of genes distinguishing NlEpi of breasts with ER+ compared with ER- cancers.
Summary of immunohistochemistry results for p63 and LCA in NlEpi.