Abstract
Cell separation based on microfluidic affinity chromatography is a widely used methodology in cell analysis research when rapid separations with high purity are needed. Several successful examples have been reported with high separation efficiency and purity; however, cell capture at the inlet area and inlet design has not been extensively described or studied. The most common inlets—used to connect the microfluidic chip to pumps, tubing, etc—are vertical (top-loading) inlets and parallel (in-line) inlets. In this work, we investigated the cell capture behavior near the affinity chip inlet area and compared the different performance of vertical inlet devices and parallel inlet devices. Vertical inlet devices showed significant cell capture capability near the inlet area, which led to the formation of cell blockages as the separation progressed. Cell density near the inlet area was much higher than the remaining channel, while for parallel inlet chips cell density at the inlet area was similar to the rest of the channel. In this paper, we discuss the effects of inlet type on chip fabrication, nonspecific binding, cell capture efficiency, and separation purity. We also discuss the possibility of using vertical inlets in negative selection separations. Our findings show that inlet design is critical and must be considered when fabricating cell affinity microfluidic devices.
Introduction
Cell separations play an important role in both chemical and life sciences including cancer research, cell biology, microbiology and immunology. Many techniques have been developed to realize high throughput and high purity cell isolation and separation1. These techniques can be classified into two types: separation based on internal properties, such as size, shape and electrical properties2–6; or separation based on cell surface markers, such as affinity surface or matrix, fluorescence-activated cell sorting and magnetic-activated cell sorting7–10. Among these methods, cell separations based upon affinity chromatography have become increasingly important in bioanalytical and diagnostic applications due to the features of rapid analysis, high selectivity, low cost, and ease of use11–14.
Cells can be captured by antibodies, aptamers, or other capture ligands that recognize a cell surface marker. Capture molecules will form affinity bonds with the surface molecules on cells to hold the specified cell against shear force in the separation channel, column or chamber. When the applied shear force is smaller than the bond strength between cells and the affinity surface, cells cannot be washed away and are retained in the separation channel1. Cells that cannot form a sufficient number of affinity bonds with the surface will move along the separation channel and reach the waste or recovery reservoir. Cells captured on the surface can also be dislodged for recovery by increasing shear force or using bubble induction11, 15. Cell selection is based largely on the difference in capture force between specific and nonspecific binding. This selection can either be positive (retaining target cells on the surface) or negative (capture non-target cells on the surface)16.
In recent years, the application of microfluidic devices in cell separation has extended the capacity of this technique with high-throughput, automation, miniaturization, and multi-parameter separation17–22. When converting normal cell affinity separations into microfluidic devices, the macro-to-micro interface becomes a critical aspect for device performance. Macro-to-micro interface solutions have been studied extensively in recent years23–29. Ideal interfaces feature simple, robust, and automated operation as well as zero dead volume. However, few devices approach these ideal conditions. For large particles, such as cells, size effects are not negligible in macro-to-micro interfaces comparing with molecules in solution. Cell sedimentation in the connection syringe, tubing and interface have been reported and studied30, 31. This problem can be more significant in affinity surface microdevices due to the surface capture effect for target cells; however, capture effects near the inlet area have not been discussed in detail. In macro-scale experiments, sample tubing can be connected to the separation system easily, making the cell inlet parallel to the separation surface. For micro-systems, the typical channel height is 25—75 µm and it is difficult to connect sample tubing parallel to the separation channel. Therefore, a vertical inlet, in which the loading tube is perpendicular to the separation channel, is a more common approach. However, when using vertical inlets, larger dead volumes caused by a larger cross sectional area and initial impact driven by the vertical direction of hydrodynamic force enhance the capture effect around inlet area. These effects compounds over time, creating channel blockage. Eventually, cell blockages around inlet area increase nonspecific binding, disrupt uniform flow, and degrade separation performance. In contrast, parallel inlets alleviate channel blockage caused by large dead volume and initial cell-surface impact and lead to better separation results.
In this paper, we compared cell capture behavior in microfluidic affinity devices with different inlet types. Though vertical inlets have an increased likelihood of clogging and flow irregularities, they are sometimes necessary for certain experiments because of ease of fabrication and compatibility with multi-layer microfluidic devices32–34. Because of increased cell capture at the inlet, vertical inlet devices can also be used as flow-through systems for negative cell selection, enriching a target cell without capturing or labeling it. We also show that, while difficult to fabricate, parallel inlets are more suitable for large sample volumes and continuous flow cell separation. These results can serve to guide others in the design of affinity microdevices.
Experimental section
Cells and Cell Culture
Human T lymphocyte (Hut 78), and Mouse endothelial (RCL-2583) cell lines were obtained from American Type Culture Collection (ATCC). Mouse endothelial cells expressed green fluorescent protein, which was used for identification under microscope. Hut 78 cells were CD71+, while mouse endothelial cells did not express any human surface antigens. Cells were cultured in an incubator at 37 °C and 5% CO2. Culture medium RPMI 1640 medium (Hyclone) was supplemented with 10% fetal bovine serum (Hyclone) and 20 mL/L antibiotic (penicillin-streptomycin solution stabilized, Sigma-Aldrich, Inc.). Hut-78 cells were normally subcultured twice each week to maintain a moderate cell concentration in culture flasks. Mouse endothelial cells were subcultured before becoming fully confluent in culture flasks, normally one to two times each week. Before each experiment, cell concentration was determined by hemacytometer. Typical concentration range was from 2000 to 5000 cells/µL.
Surface conjugation chemistry
Surface modification was based on Flavell’s35 and Wang’s11 protocols. The microfluidic channel was first rinsed with deionized water. Biotin-conjugated bovine serum albumin (1mg mL−1 in 10mM Tris–HCl, pH 8.0, 50mM NaCl, Sigma-Aldrich) was loaded into the separation channel and incubated for 45 min under room temperature. The channel surface was then washed with 10 µL 10mM Tris–HCl buffer and incubated with neutravidin (0.2mg mL−1 in 10mM Tris–HCl buffer, Pierce) for 15 min. The channel was rinsed with 10 µL 10mM Tris–HCl buffer and 20 µL deionized water. Before each experiment, 5 µL biotinylated mouse anti-human CD71 (Becton-Dickinson) were loaded into channel and incubated for 20 min.
Microfluidic device fabrication
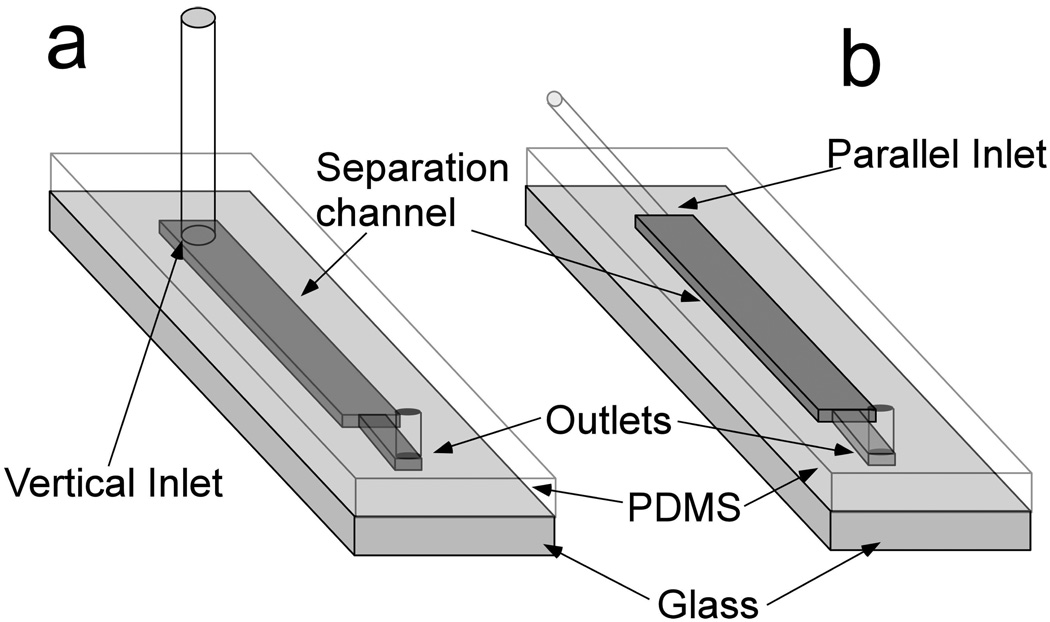
Microfluidic devices (Fig.1) were made based on standard soft lithography protocols36. Chip designs were first drawn on computer and then printed out as high resolution photomasks by CAD Art Services. The separation channel features were 40 µm height, 1 mm width and 3 cm length. Photoresist SU-8 2015 (Micro Chem) was spin coated onto a 4 inch silicon wafer (University Wafer) at 1000 rpm to form a 40 µm thick layer. The silicon wafer was then baked at 95°C for 5 min and exposed to UV for 15 s with the photomask. The silicon wafer was placed on a 95°C hot plate for 6 min, followed by development by SU-8 developer (Micro Chem) for 5 min and rinsed by isopropanol (Mallinckrodt Chemicals). After developing, the wafer was baked at 200°C for 30 min to make the features robust. Silanization was performed in a desiccator by adding perfluorooctyltrichlorosilane (Alfa Aesar) on a surface under the wafer.
Fig.1.
Schematic of microfluidic device a) Vertical inlet chip. Holes were punched from PDMS slab to form the inlet and outlet. 30-guage PTFE tubing was connected to the inlet hole to load buffer and cell sample into the separation channel. b) Parallel inlet chip. Capillary (O.D. =360 µm) was inserted into the separation channel to form parallel inlet (See Supporting Information for fabrication procedure). 30-guage PTFE tubing was then connected to the capillary to introduce the cell sample to the separation channel. Both devices were fabricated following standard soft lithography protocols. Separation channel dimensions are 40 µm × 1 mm × 3 cm (height × width × length). The channel is narrower near the outlet (300 µm in width).
PDMS prepolymer and curing agent was mixed at a ratio of 10:1 and degassed under vacuum for 30 min. To make vertical inlet devices, the PDMS mixture was poured onto the silicon mold and baked at 80°C for 1 h. Then the PDMS layer was peeled off of the silicon and holes were punched by an 18-gauge stainless steel blunt needle (Small Parts) to form inlets and outlets. The PDMS slab and a clean glass slide were treated by oxygen plasma for 60 s and then bonded together. 30 gauge PTFE tubing (I.D.=300 µm, Small Parts) was inserted to the punched hole and sealed by a small portion of PDMS mixture to form vertical inlets. To make the parallel inlet devices, three layers of Scotch tape were adhered to the channel near the inlet area. The PDMS mixture was then poured onto the silicon mold and baked at 80°C for 1 h. Inlets were formed by cutting part of the PDMS slab at the inlet end to expose the channel end to air. A diagram of the procedure is shown in Supporting Information (Fig. S1). The PDMS device was bonded with a piece of glass slide by plasma treatment. A short capillary (O.D. = 360 µm, I.D.=200 µm, Polymicro Technologies) was inserted to the end of the microchannel and sealed by small amount of PDMS liquid mixture, forming the inlet connections.
Device setup and operation procedure
A series of syringes and a T-junction flow system were used to introduce cells and wash buffer. Syringes containing either cell suspension or wash buffer were placed onto syringe pumps (KD Scientific). 3% bovine serum albumin (BSA, Sigma-Aldrich) in phosphate-buffered saline (PBS, Mediatech) was first introduced at 0.5 mL/h by the pump holding the buffer syringe to fill the device and exclude any bubble. Then the buffer loading pump was stopped and the sample loading pump was set to load cells into the channel at 0.5 mL/h. This flow rate was chosen to rapidly fill the injection tubing with cells and begin to introduce cells into the separation channel. When cell injection became constant, the flow rate was lowered to 0.05 mL/h to allow for cell separation. A Schematic of the experiment setup is shown in Supporting Information (Fig. S2).
Cell separation was observed using an inverted epifluorescence microscope (IX71, Olympus). All images and videos were recorded by a cooled CCD camera (Orca-285, Hamamatsu). A 100W Hg lamp (Olympus) was used to excite green fluorescent protein in mouse endothelial cells. Suitable filters and a 0.3 NA 10X objective were used to obtain white light and fluorescence imaging. Images and compressed videos were processed by ImageJ (Version 1.43u, National Institutes of Health).
Fluorescence correlation spectroscopy (FCS) experiment setup and operation procedure
FCS instrument setup in this study is based on previous reports37, 38 with slight modification. Briefly, excitation light was produced by a 637 nm laser diode (Edmund Optics). The laser beam passed through a variable neutral density filter and was attenuated to power of 150 µW. The attenuated laser beam was then directed to an inverted microscope (IX51, Olympus) through a two-mirror periscope. A 635 nm dichroic mirror (Semrock) was employed to reflect the incoming laser beam through the back aperture of the objective (60×, NA= 0.7, Olympus). The objective was adjusted to focus on interested spots in microchannel. Fluorescence emission passed through the same objective, the dichroic mirror, lenses, and a 700 nm interference filter (used to minimize Rayleigh and Raman scatter). A 100 µm pinhole was used to exclude out-of-focus light. Fluorescence was finally collected by a single-photon-counting avalanche photodiode detector (PerkinElmer). Signals acquisition was achieved by a counting board (Model 6602, National Instruments).
The flow experiment setup and procedure were the same as cell experiments mentioned above (Fig. S2). The only difference is the use of Allophycocyanin- Alexa Fluor 680 (APC680, Invitrogen) fluorophore in PBS solution instead of cells in buffer solution. A solution of 4 nM APC680 was first introduced into the flow channel and then theflow rate was adjusted to 0.05 mL/h and flow ran for 20 minutes before measurement. Data was acquired and monitored by a FCS control program (a gift from Rigler group39) at a flow rate of 0.05 mL/h for both vertical and parallel inlet devices. Collected data was further processed in Origin 6.0 (Origin Lab, USA) and the resulting FCS curves were fitted by a non-linear least-squares algorithm to calculate diffusion time.
Results and discussion
Cell Separations in Vertical Inlet and Parallel Inlet Devices
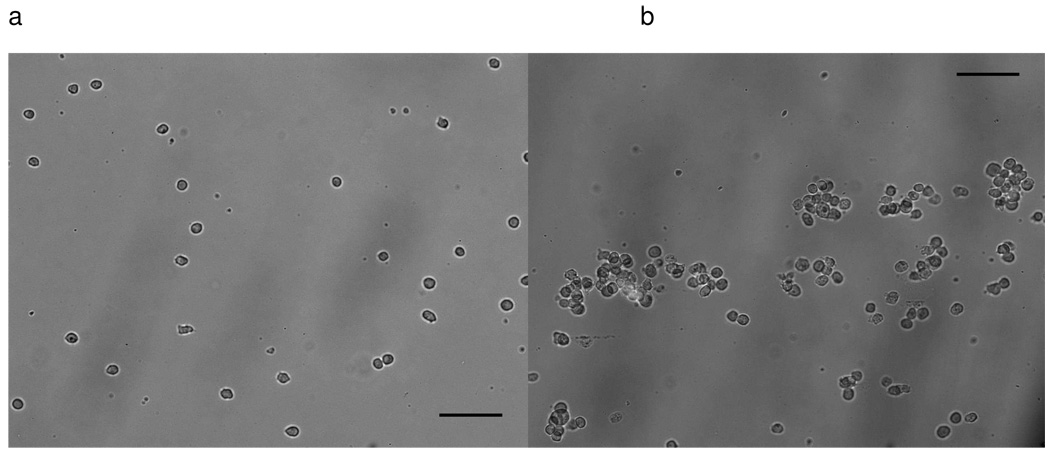
Cell separations were performed both in vertical inlet and parallel inlet chips. Cell mixtures of HuT 78 and mouse endothelial cells (5000±1000 cells/µL) were first introduced into the separation channel at 0.5 mL/h. When cell flow became uniform and constant in the channel, flow rate was changed to 0.05 mL/h to provide enough time for cell surface antigens to interact with surface antibodies, a step which is essential for cell capture under continuous flow conditions. About 10 µL of cell mixture were passed through the separation channel followed by a 0.5 mL/h flow rate wash step. Images (Fig.2a and 2b) of the middle of the separation channel were taken after a 10µL wash. The purity of target Hut 78 cells was 98.2%±1.6% and 99.1%±1.8% for the parallel inlet device and vertical inlet device, respectively. However, inconsistent flow (See Video S1 and 2, Supporting information) affected cell capture efficiency during the separation process in vertical inlet devices. Since the syringe pump provides nearly-constant pressure to the flow system, the inconsistent flow most likely arises from cell accumulation at the inlet area. Observations of cells flowing in parallel channels did not reveal the same pulsatile behavior.
Fig.2.
Fluorescence images in the middle part of anti-CD71 separation chips, each showing >98% purity. a) Hut 78 cells captured in vertical inlets device. b) Hut 78 cells captured in parallel inlets device, bright cells in the picture are mouse endothelial cells. Continuous flow was employed for both devices. Cells were loaded at 0.5 ml/h and the flow rate was then changed to 0.05 ml/h to allow cells to be captured on the channel surface. The total injected sample volume was 10 µL. Cell sample concentration (5000±1000 cells/µL) and mixture ratio (HuT 78: Mouse endothelial ≈ 1:2) were the same to each experiment. Scale bar is 100 µm.
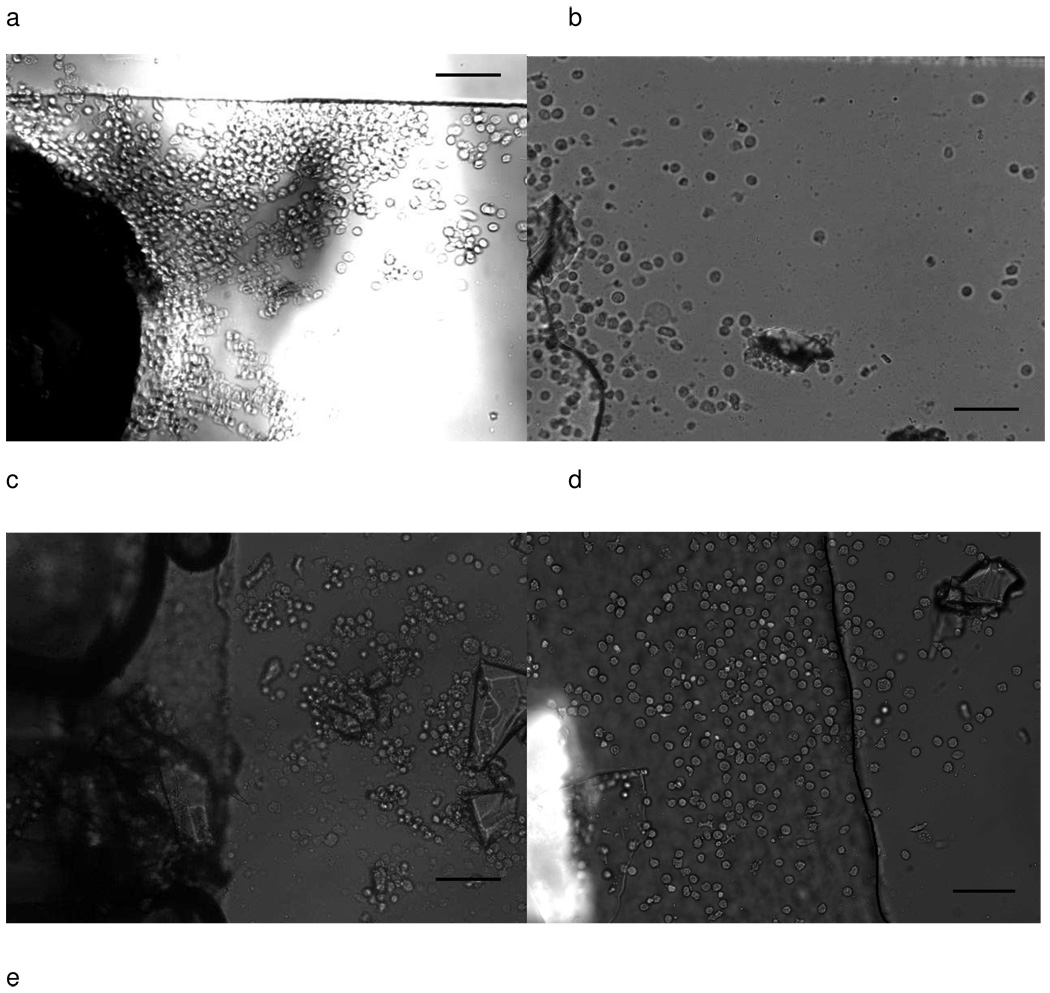
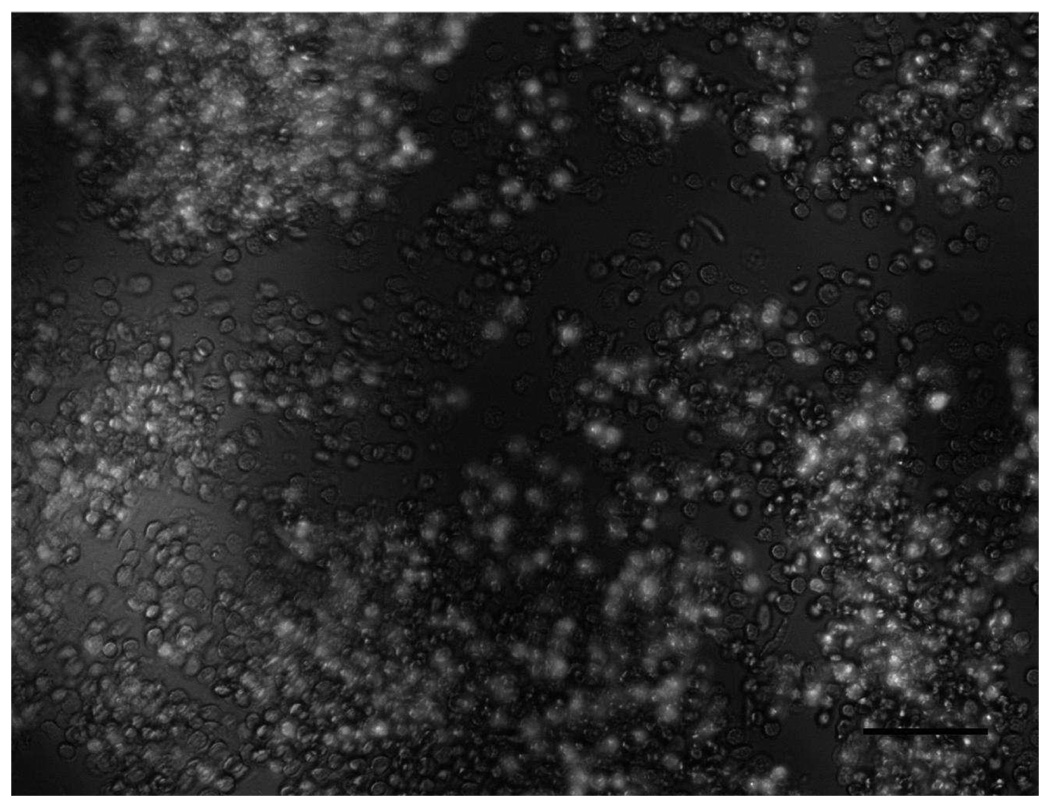
Cell capture near the channel inlet exhibited different behavior than further downstream in the channel. Cell mixtures of HuT 78 and mouse endothelial cells (~2000 cells/µL, 2:1 mixture) were separated in anti-CD71 coated devices. Cell blockage can be seen in the region near the vertical inlet after a 2.5 µL cell sample was introduced (Fig 3a). In contrast, parallel inlet devices showed reduced level of cell blockage at the inlet area (Fig. 3b). The cell density on the capture surface after 2.5 µL of cell mixture was 2600±110 cells/mm2 for vertical inlets and 500±140 cells/mm2 for parallel inlets. In addition, the cell density near the vertical inlet area was about 10 times higher than the rest of the channel. In the parallel inlet device, the inlet cell density was 4–6 times higher. It should also be noted that parallel inlet connections are more difficult to make due to the height of micro channel. Parallel inlet defects such as inconsistent channel height and debris at the inlet area may also lead to high cell density near the inlet (Fig.3c and d). However, cell accumulation and blockage with parallel inlets is not as severe as observed in vertical inlet channels under similar conditions. Cell density in a higher height channel (>360 µm) was 976±117 cells/mm2 (Fig. 3d) after a 10 µL sample was loaded (~5000 cells/µL), which was approximately 2.5 times less than at the vertical inlet area (Fig. 3a). At vertical inlets, nonspecific binding is worse than in the rest of the channel (Fig. 3e). As an analytical technique where the end result is the capture and counting of cells, avoiding counting the inlet will reduce error from nonspecific binding. However, in experiments where cells are purified and captured (or cultured in the separation chip), nonspecific binding at the inlet cannot be neglected.
Fig.3.
Images of Hut 78 cells captured by anti CD71 affinity surface a) Cell blockage near vertical inlet after 2.5 µL sample collection (large dark area is inlet and tubing). Captured cell density is 2586±111 cells/mm2. b) Cells captured near parallel inlet after 1.7 µL sample collection. Cell density was 427±170 cells/mm2. After 2.5 µL sample collection, cell density increased to 499±143 cells/mm2. Both a) and b) came from same day experiment and had the same sample concentration (~2000 cells/µL). c) Cell capture caused by debris on the surface. Debris can block flow pathway of cells, resulting in higher cell capture efficiency near inlet. d) Cell capture caused by different height in parallel inlet devices. Left part of dark line indicates channel with higher height (>360 µm), while right part has channel height 40 µm. Cell experienced less shear stress in taller channel, which leads to higher capture efficiency. Cell density at left part is 976±117 cells/mm2 after 10 µL sample collection (~5000 cells/µL). f) Non-specific binding near vertical inlets. Bright cells are mouse endothelial cells expressing green fluorescence protein. The image was taken after 25 µL of sample (2:1 mixture of Hut 78 cells and Mouse endothelial cells) was loaded at 0.05 mL/h. Cell blockage at vertical inlet area can trap non-specific cells on the surface, resulting in lower separation efficiency. Scale bar is 100 µm.
Theoretical Considerations
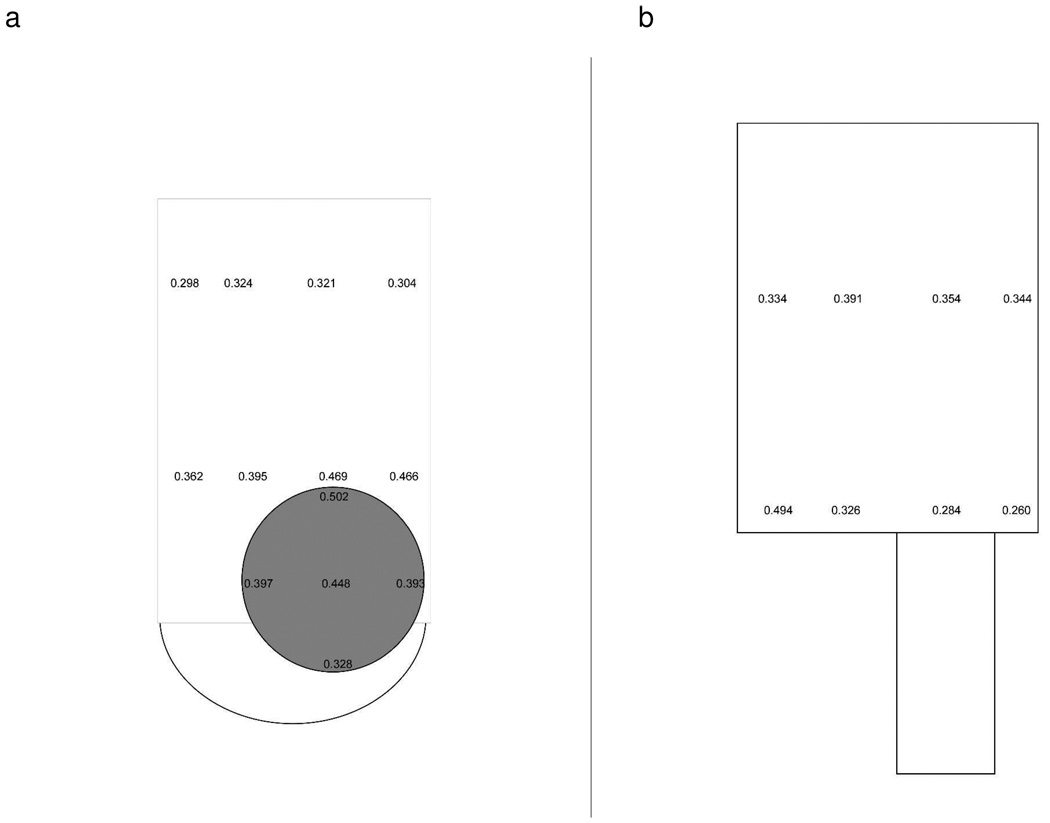
The different capture capacity at the inlet area is related to the different inlet geometry of two devices. The flow profile at vertical inlets is more complicated than parallel inlets due to the inlet geometry (flow channels perpendicular to each other) and imperfect connections caused by the hole punching process. Fluorescence correlation spectroscopy (FCS) experiments were conducted to describe the flow profile of the two devices (Fig. 4 a and b). The ability and principle of measuring diffusion and flow time in microfluidic device by FCS has been demonstrated previously39, 40. The diffusion time and flow time of fluorophore can be obtained using a model (Eq. 1, Eq.2, respectively) for the temporal autocorrelation function.
| (Eq. 1) |
and
| (Eq. 2) |
where N is the average number of fluorophres in the confocal volume, TD is the diffusion time and TF is the flow time. Wxy and Wz are the horizontal and vertical dimensions of confocal volume, respectively. It should be noted that the resultant autocorrelation curves failed to be fitted by flow model but can be fitted in simple diffusion model (Fig. S5 a–d)40. This failure of fitting may be caused by the low flow rate used in this experiment. Therefore, we chose static model to fit the points of measurement in the chips and compare the calculated diffusion times of the fluorophore. Though diffusion time cannot represent the exact velocity, it reflected relative mass transport and can be used to compare relative flow velocity at different spots. The calculated value of tD represents a transport time in this case, as small flow effects are also present. In parallel inlet devices, tD near the left channel wall at the inlet area is 0.494±0.083 ms. This spot should have a relatively slow mass transport, since the position is furthest to the inlet capillary. In vertical inlet device, seven spots, which are 77% of measured spots near the inlet area, have a comparable tD (≥ 0.4 ms, see Supporting Information) with the slowest spot at the parallel inlet area, indicating a larger dead volume compared to the parallel inlet device. Cells in the dead volume have smaller flow velocity and cannot be transported to the separation channel effectively. This prolonged the flow time near inlet area increased the chance of cells being captured. In contrast, the cell inlet area in the parallel inlet device maintains a relatively fast mass transport to reduce the capture effects at the inlet. Though there is a small dead volume at the left corner, it should not cause much capture since it is not the major pathway of the cells. The difference in dead volume is related to the cross section area of two inlet types. The vertical inlet diameter is about 600 µm (the hole punched by 18-gauge blunt needle), while the parallel inlet capillary has an internal diameter of 200 µm. Base on the law of the mass conservation, linear flow velocity is inversely proportional to the cross sectional area of the channel. Before entering the flow channel, cells flowed through a larger cross section at the vertical inlet than at the parallel inlet (about 9 times larger), which resulted in a smaller velocity at the vertical inlet area. The smaller velocity and perpendicular geometry at the vertical inlet increased cell-affinity surface interactions, leading to cell capture. For the parallel inlet device, enhanced cell capture near the inlet area was unlikely to occur, as it is hard to make a large cross section area due to the nature of parallel geometry.
Fig.4.
Transport time of a tracer fluorophore (APC680) (unit: ms) under 0.05 mL/h flow rate. a) Transport time of selected spots in the vertical inlet device (capillary connection shown in grey). Larger transport times indicate slower mass transport at selected area. Transport time at inlet center is 0.448±0.046 ms, which is larger than the measurement spot in the middle of flow channel (0.321±0.021 ms). b) Transport time of selected points in the parallel inlet device. The transport time at inlet center is 0.284±0.020 ms, which is smaller than spot in the middle of flow channel (0.354±0.054 ms). A full list of transport times and standard deviations and images of the actual devices are presented in the supporting information (Table S1 and, Fig. S4 a and b).
In addition, the direction of hydrodynamic force may contribute to the difference of the inlet capture effect of the two devices. Cells at both inlets experience the same forces of gravity, buoyancy and fluid resistance. However, hydrodynamic force on the cells in vertical inlet channels has two directions (vertical and horizontal), while cells in the parallel inlet channels only experience hydrodynamic force along the channel (horizontal). The additional direction of hydrodynamic force pushed the cells at vertical inlets to the affinity surface, which increases the likelihood of cells interacting with surface and being captured. Slower cell velocity and additional force towards the channel surface led to significant capture effects near vertical inlet area.
Capture effects were further enhanced by cells captured in earlier parts of the separation. These captured cells increased the possibility of collisions with moving cells. These collisions result in increased cell capture (See Video S3, Supporting information). If too many cells are captured at the inlet, they may block the flow of buffer solution. Though this blocking effect is very short, it can cause inconsistent flow in the channel. Moreover, non-targeted cells tend to be trapped by cells captured on the surface due to the large cell density near the inlets (Fig. 3e). Non-specific binding near inlets will degrade the separation experiment. In parallel inlet separation channels, cells trapped by already-captured target cells is also the main reason for decreased separation purity. However, parallel inlets allow larger separation sample volumes, because cell blockage was reduced near inlets.
Cell Velocity Comparison
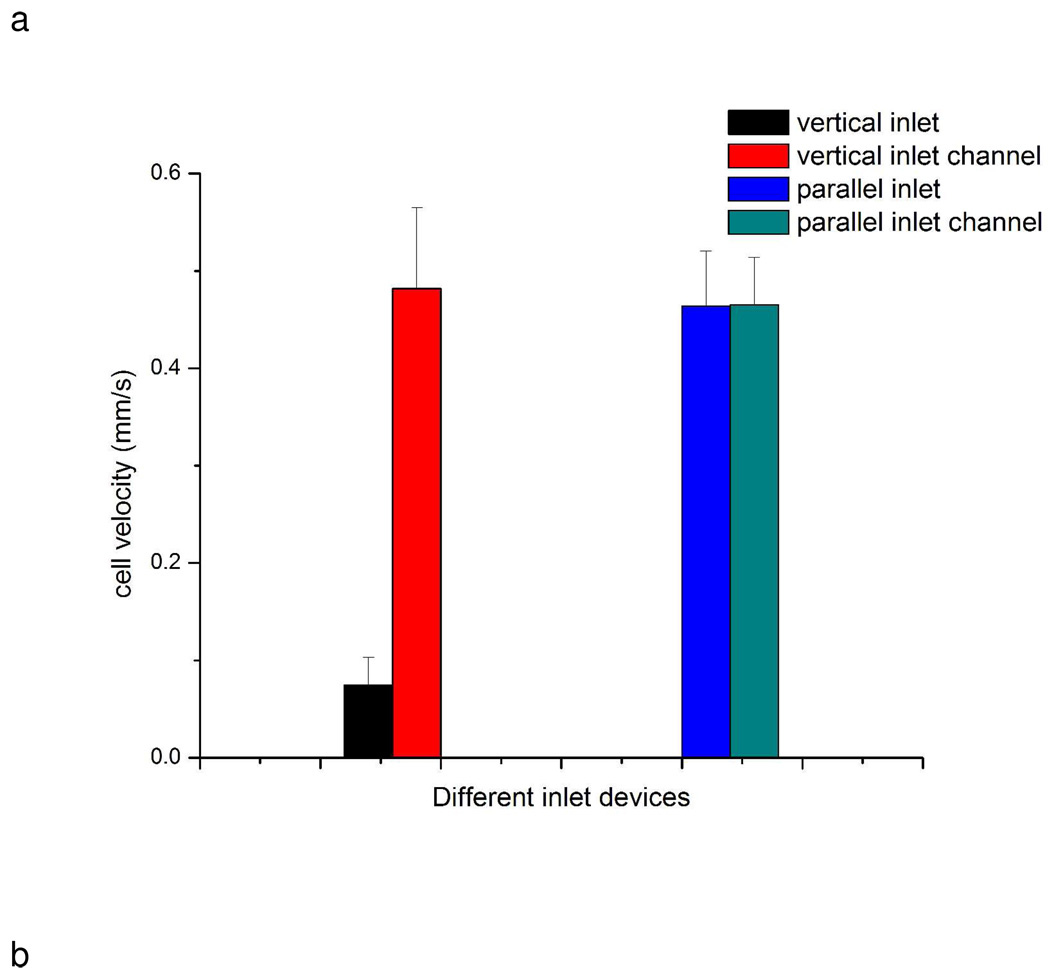
As indicated above, cells at vertical inlets should have slower velocity than at parallel inlets. To validate our hypothesis, cell horizontal velocities were measured for each type of device under a flow rate 0.05 mL/h. In vertical inlet devices, cell velocities were 0.07±0.03 mm/s at the inlet and 0.48±0.08 mm/s in the middle section of the channel, respectively (Fig. 5a). Cells moved slower at the inlet area, which facilitated cell capture on the affinity surface. In parallel inlet devices, cell velocities at the inlet and middle of the channel were 0.46±0.06 mm/s and 0.47±0.05 mm/s, respectively (Fig. 5a), showing no significant difference (a t-test was performed at the 95% confidence level for all comparisons).
Fig.5.
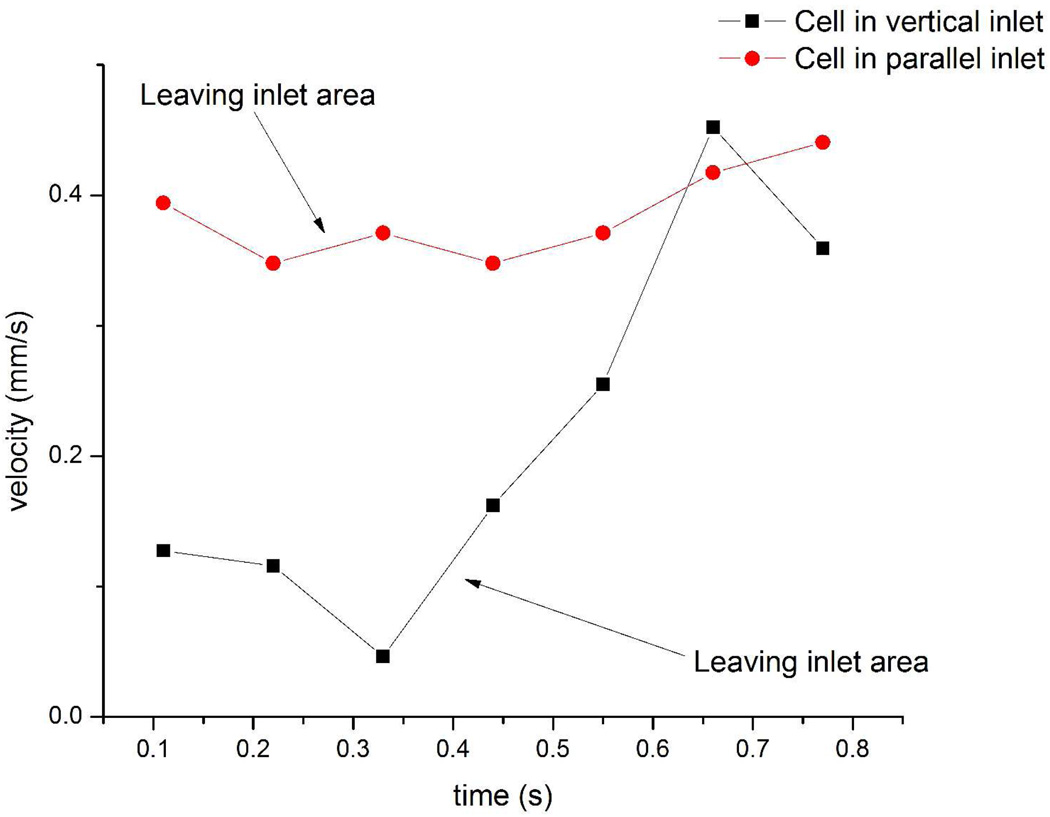
Cell velocity comparison between two different inlet devices. a) Cell velocity comparison. Cell velocity at vertical inlet area was smaller than in the channel (0.07±0.03 mm/s vs. 0.48±0.08 mm/s). There was no significant difference (compared by t test) for the parallel inlet device (0.46±0.06 mm/s vs. 0.47±0.05 mm/s). Error bars represent standard deviation of cell velocity. b) Typical cell velocity changes over time in two devices. Cell velocity was tracked frame by frame. The cell in the parallel inlet device moved out of inlet area between 0.22 and 0.33 second, while the cell in the vertical inlet device moved out of the inlet area between 0.33 and 0.44 second. The velocity of the cell in the vertical inlet increased after moving out of the inlet area. Cell velocity was measured from videos recorded during the experiments at camera speed 9 frame/s. Videos were analyzed by imageJ to measure cells displacement in pixels between each frame. 1 pixel in the videos represents 0.001288 mm in actual scale.
Cell velocity changes were also tracked for each device (Fig. 5b). Fig. 5b shows the change in velocity for two typical cells between the inlet area and the separation channel in each device. The cell in the vertical inlet device showed a velocity increase from 0.09 mm/s (at inlet) to 0.36 mm/s (in channel), while the cell velocity in the parallel inlet was maintained at a stable level (0.38 mm/s). These two representative cells reflected typical cell moving pattern near each inlet area. Cells in the vertical inlet device moved slowly at the inlet area until they entered the separation channel, which has smaller cross section area compared to the inlet area. Slower horizontal velocity and an initial vertical direction increased the chance of cells interacting with the affinity surface in the vertical inlet device, which led to increased cell capture. In contrast, cells moved smoothly from the inlet area to the rest of the channel in parallel inlet devices. Cell velocity comparison indicated that dead volume around vertical inlet area and different hydrodynamic forces applied to cells resulted in the high capture efficiency at the vertical inlet.
Quantitative Characterization of Inlet Capture Effects
To characterize the effects of inlet type on cell capture behavior and validate our hypothesis, we examined cell numbers that passed through right after the inlet area in a confined time period. When cells were loading into the separation channel at a flow rate of 0.5 mL/h, no affinity capture occurred and cell throughput for both inlet types was similar. After changing flow rate to 0.05 mL/h to allow cell capture to ensue, cells initially maintained a high flow rate as the system pressure equilibrated. As cells decelerated and were captured on the surface, fewer cells passed through our observation region as a function of time. To describe this observation quantitatively, we define P as the ratio of cells passing through the observation region in 30s at several intervals after changing the flow rate to 0.05 mL/h (It), to cells passing through the observation region in 30s just after changing flow rate from 0.5 mL/h to 0.05 mL/h, (I0).
| (Eq. 3) |
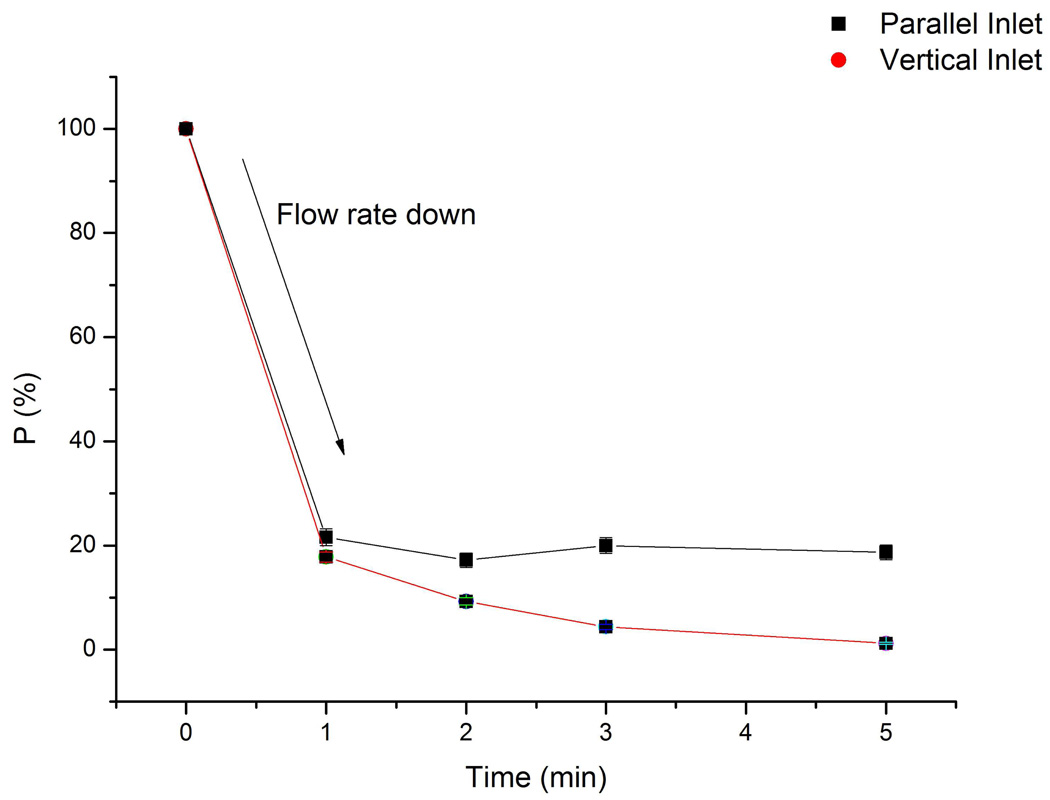
The P value reflects changes in cell throughput in a channel. In the case where no cell capture occurs, (i.e. for a non target cell), P should remain 100% throughout the course of the separation. In our separation setup, three factors contribute to the throughput decrease. These factors are the decrease in flow rate, the capture or trapping of cells near inlets, and cell capture on the channel surface downstream from the inlet. Among these reasons, the decrease in flow rate impacts both inlet types equally and cells captured on the channel surface can be minimized by fixing the detection window adjacent to the inlet area (~1mm downstream). Therefore, the P value can be employed as an indicator to compare cells captured or trapped near inlets for different inlets types. P values were determined by passing Hut 78 cells through an anti-CD71 coated surface. A 30-second video was recorded every 1 minute after changing the flow rate to 0.05 mL/h (Fig. 6). At the first minute, both devices showed a significant drop in the number of cells that passed through as the flow rate decreased to 0.05 mL/h. The P values at that time point for vertical inlet devices (17.8%±1.0%) start to be statistically different (95% confidence level) with parallel inlet devices (21.6%±1.6%), though the difference is still small. After 1 minute, the P value for parallel inlet devices was 19.4%±1.9%, while in vertical inlets, the value decreased as a function of time. At 5 min, P values for the vertical inlet device was 1.2%±0.2%. To exclude the possibility that flow pathways (vertical vs. parallel) affected cell throughput in these devices, we also performed experiments where Hut 78 cells were passed through a channel without an affinity surface. The P values at 15 minute for vertical inlet devices and parallel inlet devices were 21.8%±2.0% and 21.5%±1.5%, respectively. We can conclude that there is no significant difference between P values in this case, and that flow pathways do not affect cell throughput. These observations further confirm our hypothesis that the combination of slower flow rate at the inlet, vertical hydrodynamic force and capture on the affinity surface caused cell blockage near inlets. Also, as stated above, cell velocity in the channel showed no significant difference for the two devices. As a result, differences in inlet geometry can be neglected when designing a microfluidic device not involving an affinity surface. However, for cell capture and isolation, the design of the inlet is a critical parameter to be considered with the choice of affinity surface, channel design, etc.
Fig.6.
P value comparison between two types of devices over time. Flow rate was changed from 0.5 mL/h to 0.05 mL/h at time 0 minute. After 1 minute, the flow rate in channel became stable. Cell throughput in the parallel inlet device maintained at a constant level (19.4%±1.9%), while it decreased from 17.8%±1.0% (1 min) to 1.2%±0.2% (5 min) in the vertical inlet device. Error bar represents relative counting error (n = 2000 cells for vertical inlet, n = 1000 for parallel inlet).
Vertical Inlet Effects for Negative Selection
The area around the vertical inlet showed significant cell capture efficiency, which is detrimental in some positive-selection affinity cell separation experiments. However, this effect may serve as a good feature for negative-selection cell separation. As indicated by P value for vertical inlet systems, only 1.2% of cells passed through the anti-CD71 separation channel in 30 s, which means only 27 cells passed through comparing with 2178 cells passed in the first 30 s. Using HuT 78 cells as the background cell and mouse endothelial cells as the target cell, we depleted HuT 78 cells from the sample using an anti-CD71 coated chip. The initial mouse endothelial cell percentage was 31.1%. Cell concentrations were measured on the chip at the channel outlet. At 8 minutes and 20 minutes after changing the flow rate to 0.05 mL/h, 30 seconds of videos were recorded (See Video S4 in supporting information for the video at 20 min). The purity of mouse endothelial cells was 81.0% and 83.0%, respectively. This preliminary experiment demonstrates that chip geometry can be exploited to enhance separation efficiency in different modes. The benefits of negative selection separation are higher separation throughput, the target cells are not labeled in any way, and easy integration with other on-chip cell analysis. For example, when integrated cell separation and apoptosis induction/detection is needed, negative selection allows purified cells to be transported to the next functional area of the chip without labels or the need for elution. In positive selection, captured target cells must be removed from the surface before proceeding to the next step. Bubble induced detachment is an ideal way (high efficiency and high viability) to recover cells from the affinity surface11, but it’s not suitable in this case, as the introduction of bubbles into a microfluidic system can degrade performance. Elution of captured cells using high shear force overcomes the bubble problems but causes cell damage and excessive dilution. Since negative selection avoids the dilemma of target cell elution, it is a better choice for integration into more complex cell analysis systems.
Conclusion
We compared the effects of differences in inlet geometries on microfluidic affinity surface cell separation experiments. Vertical inlets showed significant tendency to retain cells near the inlet, while parallel inlets did not exhibit this initial capture. Non-specific binding caused by cell blockages near vertical inlets is especially detrimental to experiments that require recovery of purified cells. If experiments only require observation of captured cells on the chip, the initial capture effect in vertical inlet devices can be minimized since other parts of the channel still exhibit high purity. Also, stop flow is still a viable option to vertical inlets. In stop flow experiments, a high loading flow rate (which is not suitable for continuous flow capture) can avoid initial capture near the inlet area and unbound cells can be washed away at high flow rates. However, the high degree of cell capture can be a good feature for negative-selection separations. A preliminary study showed the mouse endothelial cell concentration in a mixture with HuT 78 cells increased from 31.1% to 83.0% by a device described in this work without any optimization. This result can be further improved with refinement of the microfluidic device design. Capture near the vertical inlet is a potential way to enhance cell capture and binding by applying additional force towards the surface. This work has illustrated the difference between cell loading methods and contributes to the current knowledge of microfluidic affinity cell separation. This work can serve as reference for those designing affinity microfluidic devices for cell separation, both in positive and negative selection modes.
Supplementary Material
Acknowledgements
Microfluidic chips were fabricated in the Department of Chemistry and Biochemistry Microfluidics Facility. This work was supported by grants from the National Institutes of Health (Grant RR025782) and the Robert A. Welch Foundation (Grant D-1667).
Footnotes
Supporting Information Available
Additional data, graphs and videos of inconsistent flow and cells captured at vertical inlets are presented in Supporting Information. This material is available free of charge via the Internet at http://pubs.acs.org.
Reference
- 1.Pappas D, Wang K. Anal. Chim. Acta. 2007;601:26–35. doi: 10.1016/j.aca.2007.08.033. [DOI] [PubMed] [Google Scholar]
- 2.Springston SR, Myers MN, Giddings JC. Anal. Chem. 1987;59:344–350. [Google Scholar]
- 3.Hawkins BJ, Smith AE, Syed YA, Kirby BJ. Anal. Chem. 2007;79:7291–7300. doi: 10.1021/ac0707277. [DOI] [PubMed] [Google Scholar]
- 4.Vahey MD, Voldman J. Anal. Chem. 2008;80:3135–3143. doi: 10.1021/ac7020568. [DOI] [PubMed] [Google Scholar]
- 5.Avridsson P, Plieva FM, Savina IN, Lozinsky VI, Fexby S, Bulow L, Galaev IY, Mattiasson M. J. Chromatogr. A. 2002;977:27–38. doi: 10.1016/s0021-9673(02)01114-7. [DOI] [PubMed] [Google Scholar]
- 6.VanDelinder V, Groisman A. Anal. Chem. 2007;79:2023–2030. doi: 10.1021/ac061659b. [DOI] [PubMed] [Google Scholar]
- 7.Hertz CM, Graves DJ, Lauffenburger DA, Serota FT. Biotechnol. Bioeng. 1985;27:603–612. doi: 10.1002/bit.260270509. [DOI] [PubMed] [Google Scholar]
- 8.Lara O, Tong X, Zborowski M, Farag SS, Chalmers JJ. Biotechnol. Bioeng. 2006;94:66–80. doi: 10.1002/bit.20807. [DOI] [PubMed] [Google Scholar]
- 9.Kato T, Yoshizuka K, Park EY. J. Biotechnol. 2010;147:102–107. doi: 10.1016/j.jbiotec.2010.03.011. [DOI] [PubMed] [Google Scholar]
- 10.Herzenberg LA, Parks D, Sahaf B, Perez O, Roederer M, Herzenberg LA. Clin. Chem. 2002;48:1819–1827. [PubMed] [Google Scholar]
- 11.Wang K, Marshall MK, Garza G, Pappas D. Anal. Chem. 2008;80:2118–2124. doi: 10.1021/ac702553w. [DOI] [PubMed] [Google Scholar]
- 12.Wang K, Cometti B, Pappas D. Anal. Chim. Acta. 2007;601:1–9. doi: 10.1016/j.aca.2007.08.029. [DOI] [PubMed] [Google Scholar]
- 13.Peskoller C, Niessner R, Seidel M. J. Chromatogr. A. 2009;1216:3794–3801. doi: 10.1016/j.chroma.2009.02.041. [DOI] [PubMed] [Google Scholar]
- 14.Gutierrez E, Groisman A. Anal. Chem. 2007;79:2249–2258. doi: 10.1021/ac061703n. [DOI] [PubMed] [Google Scholar]
- 15.Cao X, Eisenthal R, Hubble J. Enzyme Microb. Technol. 2002;31:153–160. doi: 10.1016/s0141-0229(01)00329-5. [DOI] [PubMed] [Google Scholar]
- 16.Pappas D. Practical Cell Analysis. John Wiley and Sons; 2010. pp. 137–144. [Google Scholar]
- 17.Xu Y, Phillips JA, Yan JL, Li Q, Fan ZH, Tan W. Anal. Chem. 2009;81:7436–7442. doi: 10.1021/ac9012072. [DOI] [PMC free article] [PubMed] [Google Scholar]
- 18.Phillips JA, Xu Y, Xia Z, Fan ZH, Tan W. Anal. Chem. 2009;81:1033–1039. doi: 10.1021/ac802092j. [DOI] [PMC free article] [PubMed] [Google Scholar]
- 19.Cheng X, Irimia D, Dixon M, Sekine K, Demirci U, Zamir L, Tompkins RG, Rodriguez W, Toner M. Lab Chip. 2007;7:170–178. doi: 10.1039/b612966h. [DOI] [PMC free article] [PubMed] [Google Scholar]
- 20.Dharmasiri U, Balamurugan S, Adams AA, Okagbare PI, Obubuafo A, Soper SA. Electrophoresis. 2009;30:3289–3300. doi: 10.1002/elps.200900141. [DOI] [PMC free article] [PubMed] [Google Scholar]
- 21.Lillehoj PB, Tsutsui H, Valamehr B, Wu H, Ho C. Lab Chip. 2010;10:1678–1682. doi: 10.1039/c000163e. [DOI] [PMC free article] [PubMed] [Google Scholar]
- 22.Cho SH, Chen CH, Tsai FS, Godinc JM, Lo Y. Lab Chip. 2010;10:1567–1573. doi: 10.1039/c000136h. [DOI] [PMC free article] [PubMed] [Google Scholar]
- 23.Fredrickson CK, Fan HZ. Lab Chip. 2004;4:526–533. doi: 10.1039/b410720a. [DOI] [PubMed] [Google Scholar]
- 24.Oh KW, Park C, Namkoong K, Kim J, Ock K, Kim S, Kim Y, Cho Y, Ko C. Lab Chip. 2005;5:845–850. doi: 10.1039/b503437j. [DOI] [PubMed] [Google Scholar]
- 25.Mair DA, Geiger E, Pisano AP, Fre´chet JMJ, Svec F. Lab Chip. 2006;6:1346–1354. doi: 10.1039/b605911b. [DOI] [PubMed] [Google Scholar]
- 26.Kortmann H, Blank LM, Schmid A. Lab Chip. 2009;9:1455–1460. doi: 10.1039/b820183h. [DOI] [PubMed] [Google Scholar]
- 27.Snakenborg D, Perozziello G, Geschke O, Kutter JP. J. Micromech. Microeng. 2007;17:98–103. [Google Scholar]
- 28.Sabourin D, Snakenborg D, Dufva M. J. Micromech. Microeng. 2009;19 035021. [Google Scholar]
- 29.Sabourin D, Snakenborg D, Dufva M. Microfluid. Nanofluid. 2010;9:87–93. [Google Scholar]
- 30.Zhu L, Peh XL, Ji MH, Teo YC, Feng HH, Liu W. Biomed Microdevices. 2007;9:745–750. doi: 10.1007/s10544-007-9085-z. [DOI] [PubMed] [Google Scholar]
- 31.Cooper R, Lee L. Lab Chip, Chips & Tips: Preventing suspension settling during injection. 2007 Aug 21; [Google Scholar]
- 32.Li MW, Huynh BH, Hulvey MK, Lunte SM, Martin RS. Anal. Chem. 2006;78:1042–1051. doi: 10.1021/ac051592c. [DOI] [PubMed] [Google Scholar]
- 33.Fu AY, Chou H, Spence C, Arnold FH, Quake SR. Anal. Chem. 2002;74:2451–2457. doi: 10.1021/ac0255330. [DOI] [PubMed] [Google Scholar]
- 34.Cellar NA, Burns ST, Meiners J, Chen H, Kennedy RT. Anal. Chem. 2005;77:7067–7073. doi: 10.1021/ac0510033. [DOI] [PubMed] [Google Scholar]
- 35.Jing R, Bolshakov VI, Flavell AJ. Nat. Protoc. 2007;2:168–177. doi: 10.1038/nprot.2006.408. [DOI] [PubMed] [Google Scholar]
- 36.Duffy DC, McDonald JC, Schueller OJA, Whitesides GM. Anal. Chem. 1998;70:4974–4984. doi: 10.1021/ac980656z. [DOI] [PubMed] [Google Scholar]
- 37.Tian Y, Pappas D. Appl. Spectrosc. 2010;64:324–327. doi: 10.1366/000370210790918391. [DOI] [PubMed] [Google Scholar]
- 38.Martinez MM, Reif RD, Pappas D. Anal. Bioanal. Chem. 2010;396:1177–1185. doi: 10.1007/s00216-009-3298-3. [DOI] [PubMed] [Google Scholar]
- 39.Gosch M, Blom H, Holm J, Heino T, Rigler R. Anal. Chem. 2000;72:3260–3265. doi: 10.1021/ac991448p. [DOI] [PubMed] [Google Scholar]
- 40.Liu K, Tian Y, Burrows SM, Reif RD, Pappas D. Anal. Chim. Acta. 2009;651:85–90. doi: 10.1016/j.aca.2009.08.007. [DOI] [PubMed] [Google Scholar]
Associated Data
This section collects any data citations, data availability statements, or supplementary materials included in this article.


