Abstract
This paper describes a microfluidic-based assay capable of measuring gap-junction mediated dye diffusion in cultured cells. The technique exploits multi-stream laminar flow to selectively expose cells to different environments, enabling continuous loading of cells in one compartment while monitoring, in real time, dye diffusion into cells of a neighboring compartment. A simple one dimensional diffusion model fit to the data extracted the diffusion coefficient of four different dyes, 5-(6)-carboxyfluorescein (CFDA), 5-chloromethylfluorescein (CMFDA), Oregon green 488 carboxylic acid and calcein. Different inhibitors were assayed for their ability to reduce dye coupling. The chip can screen multiple inhibitors in parallel in the same cell preparation, demonstrating its potential for high throughput. The technique provides a convenient method to measure gap junction mediated diffusion and a screen for drugs that affect gap junction communication.
Keywords: Gap junction, lab on a chip, diffusion, high throughput, assay
Introduction
Intercellular communication is mediated by gap junction channels that connect the cytosolic compartments of adjoining cells allowing for the transfer of ions, metabolites, and other small molecules between cells. Physiological roles include the synchronization of electrical and metabolic activity in cell populations, cytoplasmic buffering of transient signals and the transfer of signaling molecules between cells.1,2 Aberrant gap junction communication is implicated in an increasing number of pathophysiological states and mutations in gap junction genes are associated with disease.3,4
Studying the specific roles of gap junction communication has proven difficult due to the diversity of channel types and the unavailability of specific blockers. The vertebrate gap junction channel is composed of proteins of the connexin family, encoded by at least 22 different genes.5 The biochemical and biophysical characteristics of a gap junction channel, including regulatory mechanisms, gating mechanisms, selectivity, and permeability properties are dependent on the connexin composition of the channel. Most cells express more than one type of connexin, and while gap junction channels are generally composed of a single type of connexin, heteromeric and heterotypic gap junction channels exist.5 Diversity in channel type makes it difficult to dissect out the individual roles that different gap junction channels have in different physiological systems. Gap junction communication can only be inhibited by nonselective channel blockers such as heptanol and octanol6-8 and other compounds such as 2-aminoethyl diphenylborate (2-APB)9 (that blocks IP3 receptors) and meclofenamic acid (MFA) that also inhibits voltage sensitive ion channels.10 We need agonists and antagonists that act specifically on gap junction channels, to understand the functional roles of gap junctions and their potential as targets for therapeutic intervention.
A variety of techniques are used to assay gap junction communication, but none are suitable for the high throughput screens necessary to identify specific modulators. Electrical coupling is assayed using intracellular electrophysiological techniques that are tedious and cumbersome, especially given the complexity of having to voltage clamp two adjacent cells. Alternatively, metabolic coupling is typically assayed by following the diffusion of small fluorescent dyes between cells. Fluorescence techniques are diverse and include microinjection11 and fluorescence recovery after photobleaching (FRAP).12 All have their advantages and disadvantages, but none are suitable for high throughput screens based on either the requirement of micromanipulation to load specific cells with dye or the limited cell number that can be assayed. In addition, extracting diffusion coefficients in the complex geometries that arise using these techniques can be numerically limiting.
Microfluidic systems containing multiple parallel streams have been used for chemotaxis studies of cell growth, differentiation and migration, and selective delivery of reagents.13-16 17 Similar flow configurations have also been used to study Ca2+ wave propagation in parallel cell chains by local stimulation of cells at one end of the chain.18,19 Concurrent with the present study, Chen and Lee20 have recently reported a microfluidic method for non-invasive dye loading and measurement of diffusion via gap junctions. However, the noninvasive dye loading involves two cross-membrane diffusion processes: first, the dye must be loaded from an extracellular solution into the cells and then the dye must be transferred from the cells in the loading zone to cells in the dye-free zone. To quantitatively extract the diffusion coefficient from the measured data, a diffusion model is required in order to account for both cross-membrane processes. Additionally, demonstrated in the present study is one of the major advantages of the microfluidic chip. That is multiple solutions can be tested in parallel so that the effects of different drugs can be compared directly on one preparation, reducing the variation between cell batches, passages and culture conditions.
We developed a tri-stream microfluidic system that enables microscopic observation of dyes diffusing in one-dimensional (1D) geometry. This chip allows for observation of two dyes diffusing in opposite directions in one preparation and enables assays of multiple reagents in parallel providing a potential high throughput platform. The 1D diffusion model incorporates the diffusion component of the dye loading. The diffusion coefficient is determined for several dye molecules moving through Cx43 channels in NRK cells. The data show that the diffusion of Cx43 depends on the size of the dye. Also shown is that 2-APB is an effective inhibitor of Cx43 channels.
Experimental Section
Sensor design and construction
The chip consists of three inlet channels that merge into a main channel to form a tri-stream laminar flow. Sharp concentration boundaries are created by using maximal flow rates that do not disturb the cells thereby minimizing the time for transverse diffusion between flow streams.21 Cells in a specific stream are loaded with membrane permeant fluorescence dyes under continuous flow, leading to a time dependent increase in intracellular dye concentration. Diffusion between the loaded cells and adjacent unloaded cells of a neighboring stream is observed using fluorescence microscopy.
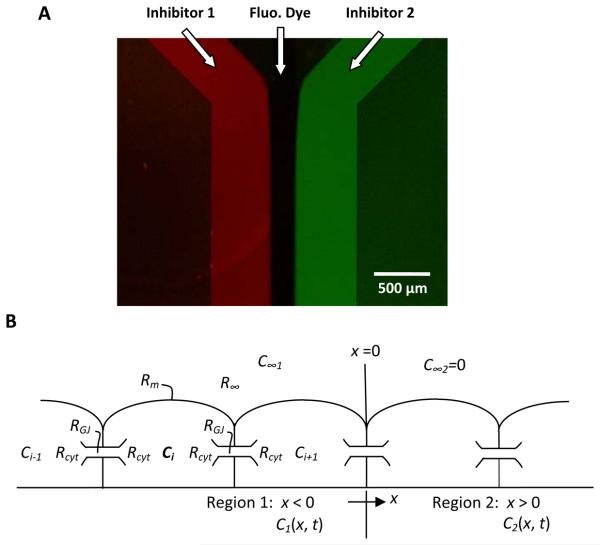
The chip was fabricated using SU-8 to define the fluid path on a Pyrex glass substrate. The main fluid channel was 1300 μm wide and 3600 μm long, connected to a middle inlet channel of 200 μm and two side inlet channels of 450 μm. The angle between the side inlets and the central channel was 45°. The channel height was 20 μm as defined by the thickness of the SU-8. The geometry of the chip and the flow path are shown in Fig. 1A. We used standard processing procedures for SU-8.22 The chip was mounted on a Plexiglass stage with connections to inlet and outlet tubing. Flow rate was set by gravity feed. Under microscopic observation, the lateral positions of the flow interfaces could be adjusted by changing the relative height of the solution reservoirs to alter perfusion pressure. Coverslips containing adherent cells were placed on the chip with cells facing the channel, and clamped in place with a metal frame.
Figure 1.
(A) A fluorescence image of a chip showing the geometry and fluidic paths with two fluorescent dyes in the side streams and a clear solution in the middle stream. (B) Diagram of the diffusion pathways used in the quantitative model of dye diffusion.
Flow characterization
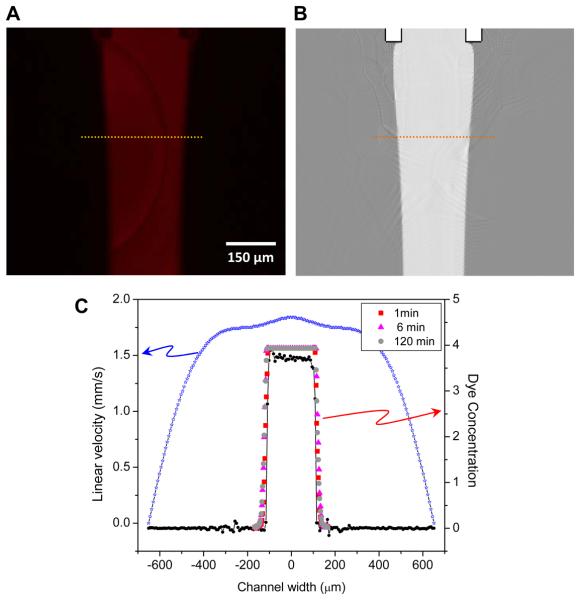
The performance of the chip relies on the precisely defined boundary between the streams. We optimized the design and flow parameters focusing on two factors, (1) limiting the flow rate to avoid noxious effects of flow shear stress, and (2) maintaining a stable interface of minimum width. The interface profile and stability were characterized experimentally using a non permeant fluorescent dye (rhodamine) and the data was compared to theoretical models calculated with finite element fluid dynamic models (Comsol Multiphysics®). For flow definition, rhodamine in the central stream was perfused at 1.2 μl/min into the main channel (corresponding to shear stress of 0.3 dyn/cm2), and the fluorescence intensity profiles collected every 30s for 70 min. Fig. 2A shows an image of the flow streams; 2B shows the theoretical distribution; 2C shows profiles taken along the dashed line. The experimental width of diffusion region 300 μm downstream from the merge point shows a concentration gradient of 80% to 20% in approximately 6.3 (±1.8) μm. Each profile was fit with the Boltzmann equation to define an inflection point. The standard deviation of the midpoint of the gradient at different positions down the flow stream defined in this manner was about 1.7 μm (n=2) over 120 min (Fig. 2C), and the position of the interfaces was stable for the entire experiment.
Figure 2.
Flow characterization of tri-stream chip. (A) Profile of rhodamine in the central stream at average flow of 1.2 μL/min corresponding to a wall shear stress of 0.3 dyn/cm2. The dotted line 300 μm downstream from the merge marks the location of the transverse intensity profile shown in panel C. (B) CFD simulation using the same geometry and mean flow conditions. The gradients are much sharper suggesting that in detail, the experimental model is more complicated. (C) Measured fluorescence profiles for rhodamine (red, magenta, and gray, right axis) at 1, 60, and 120 min after perfusion showing that the interface is stable for long term perfusion. Panel C also shows the profile from the simulation results (black, right axis) showing that the deviation of the model from the experimental results is small. The calculated flow velocity profile is shown in blue (left axis) illustrating that at the boundaries near the central stream the flow velocities are nearly identical. The velocity falls to zero at the sides since that is the no slip boundary condition of the walls. The velocity field across the central stream is quite flat since the side streams have been tuned to provide the same local velocity as the central stream.
The CFD model for flow velocity and dye concentration predicted a much sharper diffusion gradient, less than 1 μm at 300 μm from the merge (Fig. 2C). The difference between the measured data and simulation may be due to the imperfections of channel walls and the presence of cells that creates inhomogeneities in the flow field.
Cell culture
Normal Rat Kidney (NRK-49F) cells, known for their endogenous expression of Cx43 gap junction channels, were purchased from ATCC and cultured in high glucose DMEM medium containing 5% bovine calf serum, 1.5% sodium bicarbonate and 1% penicillin and streptomycin. Glass slides were cut to fit the chip dimension and UV sterilized. Cells were grown to confluence and rinsed in isotonic solution prior to each experiment.
Fluorescence dyes
Membrane permeant fluorescent dyes, 5-(6)-carboxyfluorescein diacetate (CFDA) (MW: 460.4), 5-chloromethylfluorescein diacetate (CMFDA) (MW: 464.86), Oregon green 488 carboxylic acid diacetate (MW: 496.38) and calcein AM (MW: 994.87) (Molecular Probes, Eugene, OR) were dissolved in DMSO to concentration of 5 to 10 mM and stored at −5 °C. Stock solutions were diluted in appropriate running buffer to the following concentrations: CFDA: 5 μM, CMFDA: 5 μM, Oregon green 488: 20 μM, and calcein AM: 10 μM.
The membrane-impermeant fluorescent dye, 5-(6)-carboxytetramethylrhodamine (rhodamine) (Molecular Probes) was dissolved in DMSO to 20 mM and stored at −5°C. Rhodamine was freshly mixed with isotonic solution to 2.3 μM before experiments.
Chemicals and reagents
Isotonic buffer contained 75 mM NaCl, 5 mM KCl, 2 mM MgCl2, 1 mM CaCl2, 10 mM HEPES, and pH 7.4 was used for all experiments. The osmolarity was then adjusted to 331 mOsm with mannitol. For solutions of different osmolarity, mannitol concentration was adjusted while maintaining constant ionic strength. Putative gap junction inhibitors 1-heptanol, 2-APB and MFA were prepared as 0.4 M stocks in DMSO, and diluted in appropriate running buffer to the following concentrations: 1-heptanol: 6 mM, 2-APB: 100 μM, MFA: 100 μM.
Fluorescence measurement
We used a Zeiss upright fluorescence microscope, AxioImager M1 (Zeiss, Germany) with a CCD camera (AxioCam MRm, Zeiss) to record the images and Zeiss software (AxioVision, Zeiss) to control the two-channel time-lapse series. We used two filter sets: a Cy3 filter (Ex: 550±25 nm and Em: 605±70 nm) and a GFP filter (Ex: 470±40 nm and Em: 525±50 nm). A 10x objective lens had a field of view sufficiently wide to monitor all three streams.
The relative fluorescence intensity was calculated using Eqn. 1, where F0 and Ft are the measured intensity at t=0 and t, respectively.
| (1) |
Diffusion analysis
To calculate the diffusion coefficients of different dyes we created a 1D differential equation model. The mass balance for the dye in cell i as dye is exchanged with that of the fluid flow (∞) and with adjacent cells i-1 and i+1 according to:
| (2) |
where V is the cell volume, Ci = concentration of dye in cell i (moles/liter) and the R's are mass transfer resistances (sec/liter) in which the subscripts are: ∞ = flow stream to cell surface, m = cell membrane, cyt = cytoplasm, GJ = Gap Junction. Multiplying the last two terms by (δx)2/(δx)2 and then combining them, the above equation is seen to be the finite difference representation of the partial differential equation:
| (3) |
This modified form of Fick's 2nd Law is identical to that for heat transfer. Noting that R∞ is generally negligible compared to the other resistances, h and D are then given by:
| (4) |
| (5) |
Fig. 1B is a schematic of the cells and the two fluids. It indicates that the initial and boundary conditions are:
| (6a) |
| (6b) |
| (7a,b) |
| (8a) |
| (8b) |
Far from the origin, the transport of dye molecules from the ‘edge’ cells is assumed negligible:
| (9a) |
| (9b) |
An analytical solution may be obtained by the method of Laplace transform:
| (10a) |
| (10b) |
The measured fluorescence profiles were fit using the above equations, assuming the fluorescence intensity is proportional to concentration of dye. Note that the values thereby deduced for D characterize the diffusion path (cytoplasm)i → (gap junction)ij → (cytoplasm)j , while those for h characterize the transport (membrane)i →(cytoplasm)i.
Results and Discussion
The interface positions of the parallel streams were defined and adjusted by visualizing 2.3 μM rhodamine in the central stream. The rhodamine solution was then switched to contain both rhodamine and the membrane permeable dye that is subsequently cleaved into an impermeable dye by esterases in the cytosol. Hence, only the cells in the central stream, as defined by the rhodamine boundary, become loaded with intracellular dye. Due to the steep concentration gradients between solution streams, fluorescence in unloaded cells of a neighboring stream is the result of diffusion through gap junctions. Cells in the central stream are continuously loaded with dye to provide a steady source of intracellular dye enabling visualization of diffusion into distant cells of both side streams.
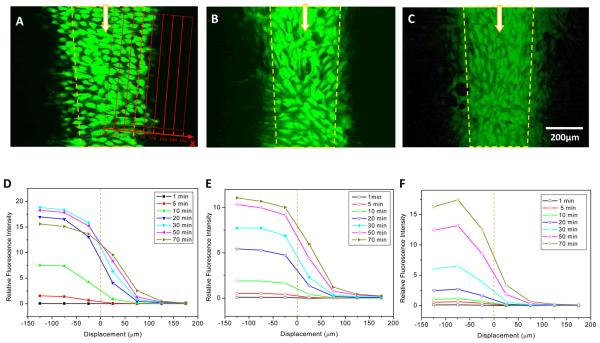
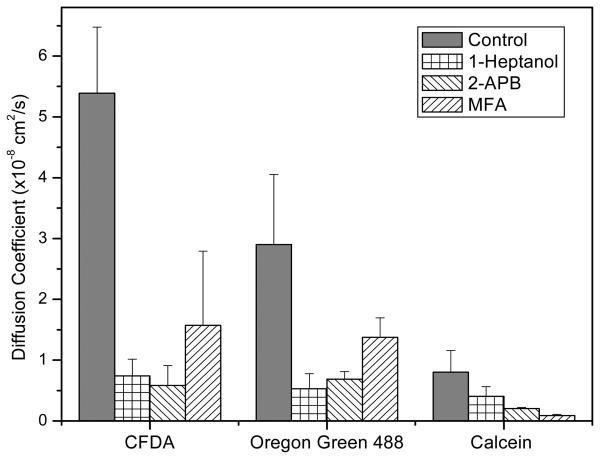
To assay for selectivity based on dye size, we tested three dyes that cover a range of molecular weights; 5-(6)-carboxyfluorescein (MW: 376.32), Oregon green 488 (MW: 368.29) and calcein (MW: 622.54). A typical time lapse record of diffusion through gap junction channels is shown in Supplementary Materials movie SM-1. Figure 3A-C shows the images of carboxyfluorescein, Oregon green 488 and calcein, respectively, after 70 min of continuous loading in the central stream. The yellow dashed lines outline the interface positions observed simultaneously using rhodamine. The average fluorescence intensity within each 50 × 600 μm band parallel to the interface (Fig. 3A, grid) is plotted in Fig. 3D-F. The concentration of CFDA defined in the center of the mid stream reached saturation in ~20 min (x<0). A visible diffusion of the dye beyond the boundaries of the loading region developed within 10 min, and extended to >175 μm from the stream boundary (Fig. 3A,D). Fitting the data to Eqn. 10a,b showed that CFDA had a faster loading and a diffusion coefficient of 5.38×10⁻⁸ cm2/s (n=4) in contrast to calcein, the dye with highest molecular weight and lowest diffusion coefficients of 0.8×10⁻⁸ cm2/s (n=4) (Fig. 3C, F). The effect of dye charge state on diffusion appeared not significant. This data is in agreement with other studies showing that the permeability of Cx43 to dyes depends more on the probe size than its charge.23 Note that Oregon green has similar molecular weight as CFDA but slower diffusion, indicating that other factors may also affect diffusion.24,25
Figure 3.
Diffusion via gap junction channels in NRK cells. (A)-(C) Fluorescence images of CFDA (A), Oregon green 488 (B), and calcein (C), measured after 70 min of perfusion of dyes in the central stream. The yellow dashed lines indicate the center of the 20-80% concentration profile boundary between the central stream and the side streams. (D)-(F) the lateral distribution of dyes at different times obtained by averaging the intensities of the different grid boxes shown in red in Panel A. Panel D, CFDA; Panel E, Oregon green 488; and Panel F, calcein.
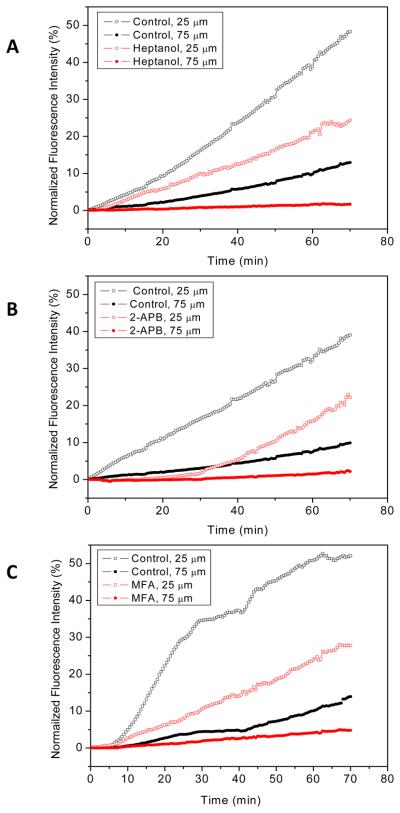
Using the same chip, we tested three known inhibitors of NRK Cx43 gap junctions: 1-heptanol, 2-APB and MFA.9,10,26,27 The experimental design was to apply the drugs to the two side streams for a sufficiently long time to ensure maximal inhibition of gap junction communication, then we added a dye to the central stream while monitoring the diffusion into adjacent streams. In the presence of 6 mM 1-heptanol, the relative intensity of CFDA 125 μm from the interface was reduced by 87±5.8% (n=4) relative to controls (Fig. 4A). 2-APB (100 μM, Fig. 4B) and MFA (100 μM, Fig. 4C) showed inhibition of 89±7.4% (n=4) and 71±21% (n=3), respectively. The effect of the three inhibitors on reducing the diffusion constants is shown in Fig. 5. Heptanol and 2-APB inhibited all three dyes equally while MFA blocked calcein more extensively than the other two dyes. Calcein has the highest charge of −4, compared to CFDA and Oregon green 488 with charges of −2 and 0 respectively. This may suggest that MFA bound to or near gap junction channels can result in the electrostatic hindrance of calcein passage.
Figure 4.
Time dependence of diffusion of CFDA dye at two distances downstream from the merge: 25 and 75 μm, in the presence of 6 mM 1-heptanol (A), 100 μM 2-APB (B), and 100 μM MFA (C). The dyes were begun perfusion at time zero. The controls are shown in black and assay for inhibitors in red.
Figure 5.
The effective diffusion coefficient of three different dyes: CFDA, Oregon green, and calcein, in the presence of three different inhibitors: 6 mM 1-Heptanol, 100 μM 2-APB, and 100 μM MFA. The error bars represent the standard deviation of n>3 experiments. The data shows that all three inhibitors affect the diffusion of Cx43.
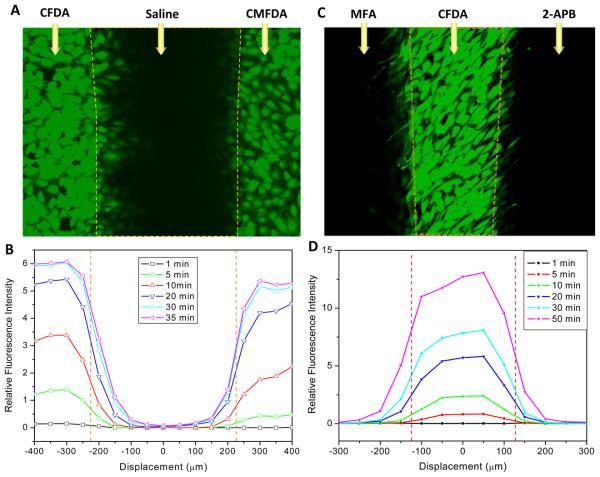
To demonstrate the feasibility of the chip for high throughput assay, we devised an experiment to directly compare the diffusion of two dyes with similar molecular weights but different chemical groups. CMFDA (MW: 380.78) is similar to CFDA (MW: 376.32), except that a CH2Cl group replaces the carboxyl group in CFDA (Fig. 6A,B). We loaded the two dyes into the opposing side streams and simultaneously quantified the diffusion of dye from both side streams into the unloaded central stream. CMFDA shows slower loading kinetics and a slower diffusion rate (D = 2.64×10⁻⁸ cm2/s vs. 5.38×10⁻⁸ cm2/s, n=3). Following the same strategy, we further measured the effects of two blockers in parallel in a single experiment. MFA (100 μM) and 2-APB (100 μM) were simultaneously applied in left and right streams, respectively, CFDA-AM (5 μM) were perfused into the central stream. As shown in Fig. 6C,D, 2-APB showed greater potency than MFA on the diffusion of Cx43 channels, consistent with the results shown in Fig. 4B,C.
Figure 6.
Parallel assays on the chip. (A) Diffusion of two dyes, CFDA and CMFDA. Image taken after 70 min perfusion of 5 μM CFDA in the left stream and 5 μM CMFDA in the right stream. (B) Intensity profiles of CFDA and CMFDA at different times after dyes loading. The concentrations were averaged as in Fig. 3A (red inset). CFDA diffusion is noticeable ~175 μm away from the interface in central region, while CFMDA was observed at ~125 μm, suggesting CFDA has a faster diffusion rate than CMFDA. (C) Screens of two inhibitors, MFA and 2-APB. MFA (100 μM) and 2-APB (100 μM) were simultaneously applied in left and right streams, while CFDA-AM (5 μM) was perfused into the central stream. The image was taken 50 min after dye loading. (D) Intensity profiles of CFDA at different times after dyes loading, showing 2-APB affected the diffusion of gap junction channels more than MFA in NRK cells.
Discussion
This device has proven to be a useful tool to study gap junctions and it works well with fluid shear stresses < 16 dyn/cm2, well below the threshold known for generating measurable effects on gap junctions in NRK cells.28 We compared our results with the commonly used microinjection method. We cultured NRK cells on coverglasses and measured the diffusion of CFDA and Oregon green 488 microinjected into a single cell. The fluorescence intensity of the injected cell and the first and second adjacent cells was recorded every 10 sec. Using the simplified Fick's law equation described previously,29 the diffusion coefficients were estimated to be 0.9 × 10⁻⁸ and 1.6 ×10⁻⁸ cm2/s, respectively, consistent with the present results.
The size of the dye molecules clearly plays a role in diffusion through Cx43 channels (Fig. 3), consistent with the previous report.23 However, CMFDA diffused much slower than CFDA despite similar molecular sizes (Fig. 6A,B). While suggesting that the difference might be in channel permeability, CMFDA can covalently react with cytosolic proteins. This would reduce the concentration of mobile dye, although the effective concentration could not have been reduced by much since the dye was available to diffuse through the junctions at nearly half of the rate of CFDA.
Different groups of inhibitors may affect channel function in different ways. Heptanol, 2-APB and MFA are known inhibitors of Cx43.9,26,30,31 Heptanol, and other long chain alcohols, alter membrane structure suggesting a mechanism involving the boundary lipids.32 2-APB is reported to reversibly block electrical coupling through Cx43 in NRK cells.9,33 In this work, 1-heptanol and 2-APB showed homogeneous blocking effects for all dyes regardless of their molecular weight (Fig. 5). However, MFA is reported to inhibit a variety of different connexin channels such as Cx26, Cx32, Cx40, Cx43, Cx46 as well as some voltage-gated ion channels.34,35 MFA inhibition showed a strong dependence on the charge of the dye molecules. For example, calcein with four negative charges showed a higher sensitivity to MFA in comparison to CFDA (z=−2) and Oregon green (z=0) (Fig. 5). This suggests that the charge on MFA within the channel may be the limiting factor.
In conclusion, this microfluidic method can assay gap junction intercellular communication. The technique is versatile allowing for multiple drugs to be tested simultaneously on the same preparation by applying different drugs or drug pools to separate side compartments, and reversible drugs can be screened sequentially. As appropriate, the system can be built with many parallel side streams to allow higher throughput.
Supplementary Material
The diffusion of calcein measured using microfluidic chip. The central stream contained 10 μM calcein AM and 2.3 μM rhodamine, and the side streams contained buffer solution. Two-channel images were recorded every 2 min for total 85 min, the images were overlapped. Time has been compressed by 14 fold.
Acknowledgements
This work was supported by National Institute of Health grant NS062657 and National Science Foundation Grant CMMI-0825707. We thank Dr. Thomas Suchyna for helping on microinjection measurements. The microfabrication work was performed in part at the Cornell NanoScale Facility, a member of the National Nanotechnology Infrastructure Network, supported by the National Science Foundation (Grant ECS-0335765).
References
- 1.Evans WH, Martin PE. Mol Membr Biol. 2002;19:121. doi: 10.1080/09687680210139839. [DOI] [PubMed] [Google Scholar]
- 2.Spray DC, Bennett MV. Annu Rev Physiol. 1985;47:281. doi: 10.1146/annurev.ph.47.030185.001433. [DOI] [PubMed] [Google Scholar]
- 3.Xia JH, Liu CY, Tang BS, Pan Q, Huang L, Dai HP, Zhang BR, Xie W, Hu DX, Zheng D, Shi XL, Wang DA, Xia K, Yu KP, Liao XD, Feng Y, Yang YF, Xiao JY, Xie DH, Huang JZ. Nat Genet. 1998;20:370. doi: 10.1038/3845. [DOI] [PubMed] [Google Scholar]
- 4.Kelsell DP, Dunlop J, Stevens HP, Lench NJ, Liang JN, Parry G, Mueller RF, Leigh IM. Nature. 1997;387:80. doi: 10.1038/387080a0. [DOI] [PubMed] [Google Scholar]
- 5.Beyer EC, Paul DL, Goodenough DA. J Membr Biol. 1990;116:187. doi: 10.1007/BF01868459. [DOI] [PubMed] [Google Scholar]
- 6.Guan X, Cravatt BF, Ehring GR, Hall JE, Boger DL, Lerner RA, Gilula NB. J Cell Biol. 1997;139:1785. doi: 10.1083/jcb.139.7.1785. [DOI] [PMC free article] [PubMed] [Google Scholar]
- 7.de Roos AD, Willems PH, Peters PH, van Zoelen EJ, Theuvenet AP. Cell Calcium. 1997;22:195. doi: 10.1016/s0143-4160(97)90013-0. [DOI] [PubMed] [Google Scholar]
- 8.Toyofuku T, Yabuki M, Otsu K, Kuzuya T, Hori M, Tada M. J Biol Chem. 1998;273:1519. doi: 10.1074/jbc.273.3.1519. [DOI] [PubMed] [Google Scholar]
- 9.Harks EG, Camina JP, Peters PH, Ypey DL, Scheenen WJ, van Zoelen EJ, Theuvenet AP. FASEB J. 2003;17:941. doi: 10.1096/fj.02-0786fje. [DOI] [PubMed] [Google Scholar]
- 10.Harks EG, de Roos AD, Peters PH, de Haan LH, Brouwer A, Ypey DL, van Zoelen EJ, Theuvenet AP. J Pharmacol Exp Ther. 2001;298:1033. [PubMed] [Google Scholar]
- 11.Loewenstein WR, Kanno Y. J Cell Biol. 1964;22:565. doi: 10.1083/jcb.22.3.565. [DOI] [PMC free article] [PubMed] [Google Scholar]
- 12.Wade MH, Trosko JE, Schindler M. Science. 1986;232:525. doi: 10.1126/science.3961495. [DOI] [PubMed] [Google Scholar]
- 13.Walker GM, Sai J, Richmond A, Stremler M, Chung CY, Wikswo JP. Lab Chip. 2005;5:611. doi: 10.1039/b417245k. [DOI] [PMC free article] [PubMed] [Google Scholar]
- 14.Groisman A, Lobo C, Cho H, Campbell JK, Dufour YS, Stevens AM, Levchenko A. Nat Methods. 2005;2:685. doi: 10.1038/nmeth784. [DOI] [PubMed] [Google Scholar]
- 15.Chung BG, Flanagan LA, Rhee SW, Schwartz PH, Lee AP, Monuki ES, Jeon NL. Lab Chip. 2005;5:401. doi: 10.1039/b417651k. [DOI] [PubMed] [Google Scholar]
- 16.Lucchetta EM, Lee JH, Fu LA, Patel NH, Ismagilov RF. Nature. 2005;434:1134. doi: 10.1038/nature03509. [DOI] [PMC free article] [PubMed] [Google Scholar]
- 17.Takayama S, Ostuni E, LeDuc P, Naruse K, Ingber DE, Whitesides GM. Chem Biol. 2003;10:123. doi: 10.1016/s1074-5521(03)00019-x. [DOI] [PubMed] [Google Scholar]
- 18.Klauke N, Smith G, Cooper JM. Lab Chip. 2007;7:731. doi: 10.1039/b706175g. [DOI] [PubMed] [Google Scholar]
- 19.Kaji H, Nishizawa M, Matsue T. Lab Chip. 2003;3:208. doi: 10.1039/b304350a. [DOI] [PubMed] [Google Scholar]
- 20.Chen S, Lee LP. Integrative Biology. 2010;2:130. doi: 10.1039/b919392h. [DOI] [PubMed] [Google Scholar]
- 21.Takayama S, Ostuni E, LeDuc P, Naruse K, Ingber DE, Whitesides GM. Nature. 2001;411:1016. doi: 10.1038/35082637. [DOI] [PubMed] [Google Scholar]
- 22.Pennell T, Suchyna T, Wang J, Heo J, Felske JD, Sachs F, Hua SZ. Anal Chem. 2008;80:2447. doi: 10.1021/ac702169t. [DOI] [PubMed] [Google Scholar]
- 23.Heyman NS, Burt JM. Biophys J. 2008;94:840. doi: 10.1529/biophysj.107.115634. [DOI] [PMC free article] [PubMed] [Google Scholar]
- 24.Weber PA, Chang HC, Spaeth KE, Nitsche JM, Nicholson BJ. Biophys J. 2004;87:958. doi: 10.1529/biophysj.103.036350. [DOI] [PMC free article] [PubMed] [Google Scholar]
- 25.Cao F, Eckert R, Elfgang C, Nitsche JM, Snyder SA, DF H. u., Willecke K, Nicholson BJ. J Cell Sci. 1998;111(Pt 1):31. doi: 10.1242/jcs.111.1.31. [DOI] [PubMed] [Google Scholar]
- 26.Takens-Kwak BR, Jongsma HJ, Rook MB, Van Ginneken AC. Am J Physiol. 1992;262:C1531. doi: 10.1152/ajpcell.1992.262.6.C1531. [DOI] [PubMed] [Google Scholar]
- 27.Russo RE, Reali C, Radmilovich M, Fernandez A, Trujillo-Cenoz O. J. Neurosci. 2008;28:3298. doi: 10.1523/JNEUROSCI.5736-07.2008. [DOI] [PMC free article] [PubMed] [Google Scholar]
- 28.Cheng B, Zhao S, Luo J, Sprague E, Bonewald LF, Jiang JX. J Bone Miner Res. 2001;16:249. doi: 10.1359/jbmr.2001.16.2.249. [DOI] [PubMed] [Google Scholar]
- 29.Safranyos RG, Caveney S, Miller JG, Petersen NO. Proc Natl Acad Sci U S A. 1987;84:2272. doi: 10.1073/pnas.84.8.2272. [DOI] [PMC free article] [PubMed] [Google Scholar]
- 30.Nelson WL, Makielski JC. Circ Res. 1991;68:977. doi: 10.1161/01.res.68.4.977. [DOI] [PubMed] [Google Scholar]
- 31.Daleau P, Deleze J. Can J Physiol Pharmacol. 1998;76:630. doi: 10.1139/cjpp-76-6-630. [DOI] [PubMed] [Google Scholar]
- 32.Juszczak GR, Swiergiel AH. Prog Neuropsychopharmacol Biol Psychiatry. 2009;33:181. doi: 10.1016/j.pnpbp.2008.12.014. [DOI] [PubMed] [Google Scholar]
- 33.Bai D, del Corsso C, Srinivas M, Spray DC. Journal of Pharmacology and Experimental Therapeutics. 2006;319:1452. doi: 10.1124/jpet.106.112045. [DOI] [PubMed] [Google Scholar]
- 34.Srinivas M, Spray DC. Mol Pharmacol. 2003;63:1389. doi: 10.1124/mol.63.6.1389. [DOI] [PubMed] [Google Scholar]
- 35.Veruki ML, Hartveit E. J Neurophysiol. 2009;101:2339. doi: 10.1152/jn.00112.2009. [DOI] [PubMed] [Google Scholar]
Associated Data
This section collects any data citations, data availability statements, or supplementary materials included in this article.
Supplementary Materials
The diffusion of calcein measured using microfluidic chip. The central stream contained 10 μM calcein AM and 2.3 μM rhodamine, and the side streams contained buffer solution. Two-channel images were recorded every 2 min for total 85 min, the images were overlapped. Time has been compressed by 14 fold.


