

Abstract
Aptamer-conjugated nanoparticles (ACNPs) have been used for a variety of applications, particularly dual nanoparticles for magnetic extraction and fluorescent labeling. In this type of assay, silica-coated magnetic and fluorophore-doped silica nanoparticles are conjugated to highly selective aptamers to detect and extract targeted cells in a variety of matrices. However, considerable improvements are required in order to increase the selectivity and sensitivity of this two-particle assay to be useful in a clinical setting. To accomplish this, several parameters were investigated, including nanoparticle size, conjugation chemistry, use of multiple aptamer sequences on the nanoparticles, and use of multiple nanoparticles with different aptamer sequences. After identifying the best-performing elements, the improvements made to this assay’s conditional parameters were combined to illustrate the overall enhanced sensitivity and selectivity of the two particle assay using an innovative multiple aptamer approach, signifying a critical feature in the advancement of this technique.
INTRODUCTION
The goal of personalized medicine is to ultimately craft the most effective treatment for an individual patient based on that patient’s specific disease, minimizing possible side effects. Cancer is typically a disease associated with personalized medicine, due to the need for more effective treatments and the wide ranges of efficacy between patients with the same type of cancer. Related cancers can exhibit significant molecular differences, which can have a large impact on patient outcomes. These molecular differences can result in cancer responding better or worse to treatments and can indicate disease progression. Understanding these molecular differences is critical to characterizing disease states, particularly in cancers associated with specific biomarkers. The proteins that are selectively expressed by different cancers can provide the basis for screening techniques1–3 and treatment options.4,5 However, the relative scarcity of specific biomarkers has limited the twin clinical exigencies of diagnosis and treatment. Biomarker discovery is a time-consuming task which requires the systematic separation and identification of biological molecules from complex bodily fluids or tissues. In order to achieve the paradigm of personalized medicine, molecular tools must be developed that not only differentiate between subsets of cancer to reveal the most efficacious treatment options, but additionally allow for the early detection to ensure that the effectiveness of the treatment is maximized.
Due to their specificity and high binding affinities, polyclonal and monoclonal antibodies have long been the workhorses for biomolecular recognition. The integration of nanotechnology into applications of biosensors, assays, and diagnostic tools, has exposed certain limitations inherent with antibodies. Immobilizing large proteins on the surface of the nanoparticles (NPs) can result in aggregation and impair the performance of the nanomaterials. In addition, the complexity and expense of antibody production and more difficult routes of bioconjugation affect the ultimate utility of antibodies paired with nanomaterials. The development of aptamers for molecular recognition addresses several of these issues: aptamers possess a low molecular weight, exhibit easy and reproducible synthesis, easy modification,6 fast tissue penetration, low toxicity or immunogenicity,7,8 easy storage, and high binding affinity and selectivity.9,10 To produce probes for the molecular profiling of tumor cells, researchers in our lab have developed a novel method known as cell-based selection of ligands by exponential enrichment, or Cell-SELEX.11 Expanding the use of aptamers for recognition of unique biomarkers on the cell surface, Cell-SELEX uses whole cells as targets to select single-stranded DNA aptamers with the ability to distinguish target from control cells. The panel of aptamers generated is ideal for profiling and personalized medicine, as different aptamers recognize different molecular targets on the surface of the cell which could be subsequently be correlated to advancing patient and treatment outcomes. Panels of aptamers targeting leukemia cell lines11, lung cancer cell lines12, liver cancer cell lines13, and lymphoma cell lines14 have previously been described. In addition, aptamers generated through Cell-SELEX have previously demonstrated to bind selectively to multiple related cell lines and clinical patient samples, while being able to discriminate against non-cancerous and non-targeted cell lines.15,16 The use of cell-SELEX aptamers in diagnostic assays is especially relevant to cancer detection, as a consequence of the behavior of a tumor’s tendency to exfoliate cells spontaneously into bodily fluids like blood and sputum. The exfoliated cells are generally far outnumbered by normal cells in bodily fluids. Distinguishing these cells requires a method that can accurately detect and differentiate such a small sub-population of cells in extremely complex matrices.
Identifying such a small sub-population of cells requires extraction, enrichment, and detection of the rare cancer cells from bodily fluids. To accomplish this, we generated a panel of cancer cell-specific aptamers and conjugated these aptamers to NPs a to allow not only the collection, enrichment, and preservation of cancer cells, but also the rapid detection of these cells directly from bodily fluids.17,18 The method involved the use of two separate aptamer-conjugated nanoparticles (ACNPs) one magnetic and one fluorescent. The magnetic nanoparticle (MNPs) permitted the collection and enrichment of the cancer cells, while the fluorescent nanoparticle (FNPs) clearly marked the cell for fluorescence detection. Initial proof-of-concept experiments demonstrated the potential of this methodology. However these approaches have not demonstrated sufficient sensitivity to detect cells at the level of exfoliated tumor cells. This paper looks to achieve that sensitivity and expand the applicability of the two particle assay by using multi-aptamers functionalized to a single particle set for the recognition of potential variation possibilities from sample-to-sample, while investigating a number of parameters that impact the nanoparticles’ performance as a clinical diagnostic tool.
In previous publications, we set out to demonstrate the feasibility of the two particle assay. In the first attempt,17 we performed a proof-of-concept study of the capabilities of the aptamer-conjugated two particle assay approach. The results indicated the utility and potential of selectively targeting cancer cells of interest in simple cell and more complex mixed cell media, including spiked whole blood samples.17 This work was followed by expanding the two particle assay to extract and detect multiple cell lines in simple cell media, as well as in serum matrices.18 Dissatisfied with the performance of this assay for personalized treatment applications, we focused on the aspects of the aptamer-conjugated two particle assay that limited its performance for the expressed purpose of improved selectivity and sensitivity. In this paper, we investigate the fluorophores used to construct the FNPs, the size of MNPs used for cell extractions, and the conjugation chemistries. Building on these improvements, we have utilized a strategy whereby multiple aptamers are immobilized on the NPs surface in order to achieve ultra-sensitivity and –selectivity of this assay. The multiple aptamer approach has not been attempted for this or any other method in a personalized treatment capacity for improved assay performance. The improvements made to this two particle assay approach illustrate an overall enhancement of sensitivity and selectivity for cancer cell applications centered around the involvement of multiple aptamers conjugated to magnetic and fluorescent NPs. The use of the multiple aptamer approach provides the critical recognition process necessary for the improved detection capability. Utilizing the combination of aptamers and nanotechnology will allow for a screening assay empowered with the ability to characterize individual patient profiles which is the first step to achieving real personalized cancer therapies.
METHODS AND MATERIALS
Materials
Unless otherwise specified, chemicals were of reagent grade and used as received. All materials were purchased from Sigma-Aldrich (St. Louis, MO), unless otherwise noted. The substances purchased from Fisher Scientific (Fair Lawn, NJ) were hydrochloric acid (HCl), ammonium hydroxide (NH4OH), and the glass screw cap reaction vials. Carboxyethylsilanetriol sodium salt (monocarboxyl-silane), N-(trimethoxysilylpropyl)-ethelenediamine triacidic acid trisodium salt (tricarboxyl-silane), and 3-(trihydroxyl)propyl methyl phosphonate (phosphonate-silane) were purchased from Gelest, Inc. (Morrisville, PA). 1-Ethyl-3-[3-dimethylaminopropyl] carbodiimide hydrochloride (EDC), N-hydroxysuccinimide (NHS), and streptavidin were purchased from Pierce Biotechnology, Inc. (Rockford, IL). The 5-(and-6)-carboxytetramethylrhodamine succinimidyl ester (TMR), fluorescein 5-isothiocyanate (FITC), and avidin were purchased from Molecular Probes (Eugene, OR). Cy5-NHS (cy5) was purchased from Amersham Biosciences. Larger streptavidin-modified polystyrene magnetic particles were purchased from Bang’s Laboratories (Fishers, IN); sizes include 350nm, 830nm, 2600nm, and 8030nm.
Nanoparticle Synthesis and Surface Modifications
The synthesis procedures used for the FNPs and MNPs have been described in previous publications.17, 18 Detailed descriptions of the synthesis of FNPs and MNPs, various NPs surface modifications, and various bioconjugation protocols of the silica NPs are available in the Supporting Information section (Methods).
Aptamer Synthesis
An ABI3400 DNA/RNA synthesizer (Applied Biosystems, Foster City, CA) was used for the synthesis of all aptamer sequences. A ProStar HPLC (Varian, Walnut Creek, CA) with a C18 column (Econosil, 5u, 250 × 4.6 mm) from Alltech (Deerfield, IL) was used to purify all fabricated DNA. A Cary Bio-300 UV spectrometer (Varian, Walnut Creek, CA) was used to measure absorbances to quantify the manufactured sequences. All oligonucleotides were synthesized by solid-state phosphoramidite chemistry at a 1 μmol scale. The completed sequences were then deprotected in concentrated ammonia hydroxide at 65 °C overnight and further purified twice with reverse phase high-pressure liquid chromatography (HPLC) on a C-18 column.
Cells
CCRF-CEM cells (CCL-119 T-cell, human acute lymphoblastic leukemia) and Ramos cells (CRL-1596, B-cell, human Burkitt’s lymphoma) were obtained from ATCC (American Type Culture Association). The cells were cultured in RPMI medium supplemented with 10% fetal bovine serum (FBS) and 100 IU/mL penicillin-Streptomycin. The cell density was determined using a hemocytometer prior to any experiments. Afterwards, approximately one million cells dispersed in RPMI cell media buffer were centrifuged at 920 rpm for five minutes and redispersed in dye-free cell media three times and then redispersed in 5 mL dye-free cell media. The actual cell numbers were then extrapolated based on the cell density. During all experiments, the cells were kept in an ice bath at 4°C to prevent internalization of any of the materials. Unless otherwise specified, approximately 25,000 cells are used in each of the experiments.
Plate Reader Measurements
Fluorescence measurements were taken using a Tecan Safire Microplate Reader in a 384-well small volume plate. 20μL aliquots from each sample were deposited in the wells, and sample fluorescence intensities at defined wavelengths were measured at a constant gain at 5nm slit widths. TMR-based NPs were measured with 550nm light excitation, and emission was measured at 575nm. Cy5-based NPs were measured by 633 nm light excitation and 660 nm emissions. Fluorescein-based NPs were excited at 488nm, and emission was measured at 520nm. RuBpy-based NPs were excited at 458nm, and emission was collected at 610nm.
Fluorescence Imaging
All cellular fluorescent images were collected using the confocal microscope. The confocal microscope consists of an Olympus IX-81 automated fluorescence microscope with a Fluoview 500 confocal scanning unit using a 20X air objective. The TMR NPs were excited at 543nm with emissions collected at 570nm. Images were taken after a five- to ten-second period during which the instrument was focused to yield the highest intensity from the fluorescence channel.
RESULTS AND DISCUSSION
Utilizing a dual-nanoparticle system to rapidly extract and detect specific cells provided distinct advantages. These included the utilization of the assay in any matrix where the cells of interest were found, including serum and whole blood samples. Fluorescence detection provided sensitivity to the method, while the aptamers afford excellent selectivity. As shown in Figure 1B, the targeted cells were magnetically extracted after labeling with the FNPs, while non-target cells (Figure 1A) were not since the MNPs do not bind in the absence of the aptamer’s binding epitope. These results were similar to those reported in previous publications.17 However, in order to be an effective screening tool for cancer cells, the assay requires an extremely low quantitation limit in order to detect exfoliated cancer cells in the blood or other bodily fluid samples allowing for earlier diagnosis and treatment, which could result in increased patient survival rates.
Figure 1.

Confocal microscopy images of control (A) and target cells (B) after extraction with MNPs and labeling with TMR FNPs.
Magnetic Nanoparticle Size Evaluation
The first parameter to be evaluated was the effect of MNPs size on the efficiency magnetic cell extraction. Smaller particles resulted in a significantly larger number of particles in a given volume of sample available for binding to the cell and would minimize any steric hindrance between particles, whether magnetic or fluorescent. However, smaller particles could also contain less magnetically active material per particle, which hindered the nanoparticle’s ability to extract the cell. The 60nm MNPs were made in house, while the larger streptavidin-coated particles (350nm, 830nm, 2600nm, 8030nm) were purchased (Bang’s Laboratories, Fishers, IN). For these experiments, equal masses of each magnetic particle size were used to extract 20,000 cells. With the exception of the magnetic particle, the rest of the ACNP extraction protocol remained constant. The final fluorescence intensity after extraction was measured for the 20,000 target cells and the 20,000 control cells for each magnetic particle size. The average intensities (n = 6) for each size were plotted in Figure 2. Fluorescence intensity was used to evaluate the NPs because it incorporated both the collection efficiency of the cells and the ability of the FNPs to bind to the cells after extraction, as opposed to directly measuring the collection efficiency. Using only the collection efficiency to evaluate the particle size would have indicated the particles that could most effectively extract the cells. However, such particles might block the FNPs used for detection, thus limiting the overall sensitivity of the assay.
Figure 2.

Effect of magnetic particle size on the extraction of target and control cells by the same total mass of particles, including 60nm, 350nm, 830nm, 2600nm, and 8030nm diameter particles.
The smallest particle size of 60nm demonstrated the highest fluorescence intensity of all the samples tested. The % RSDs for the different particle sizes ranged from 5.3% for the 60nm NPs to 6.6% for the 830nm NPs, indicating little or no impact on reproducibility by either decreasing or increasing the particle size. However, it is interesting to note that as the particle size increased, the fluorescence intensity decreased. It was anticipated that the larger particles could extract multiple cells at the same time, while the smaller sizes required multiple particles to extract a single cell, thus resulting in comparable extraction efficiencies, but this was not supported by the final experimental results. There were several possible explanations for this trend. The larger particle size blocked binding sites for the FNPs, resulting in overall decreased fluorescence intensity. It was also possible that the larger particle sizes simply cannot bind a sufficient number of cells simultaneously to keep pace with the smaller particle sizes. The cells likely caused steric hindrance that prevented additional cells from binding, thus it was unlikely that more than a few cells were captured with a single particle. Since the experiment looked at the effect of particle size using the same mass of particles, the larger particles had a lower number of individual particles per sample. It was possible that due to the steric hindrance, the number of available binding sites were saturated resulting in fewer cells being extracted. As the evidence showed for this aptamer-cell set, the 60 nm magnetic NPs provided the largest signal difference between the target and control cells. Therefore, the 60 nm magnetic NPs were used for the remainder of this investigation. These NPs were used and tested for selectivity with additional aptamer-cell pairings in a previous publication.18
Optimization of the Fluorophore in the Nanoparticles
In this assay, FNPs provided the means of detection. For optimal fluorescence sensitivity, several different fluorophores were doped inside of a silica nanoparticle, including TMR, RuBpy, FITC, and Cy5. The TMR based particles possessed the optimal performance and were utilized in the subsequent experiments. Details of this investigation can be found in the Supporting Information section (Table S-1).
Optimization of Nanoparticle Conjugation
One of the more fundamental aspects of ACNPs involved the engineering of functionalized aptamer-nanoparticle conjugations. While it was initially thought that the conjugation method would have little impact on the assay, it was later found that certain conjugation methods resulted in a higher degree of nonspecific binding than other. This was not a consequence of the conjugation method or aptamer, but rather the nanoparticle modifications required for bioconjugation. The nanoparticle surface imbued the entire ACNP with certain properties, such as increased or decreased surface charge or functional groups that nonspecifically interact with the cell surface. Therefore, to fully realize the capability of the assay, the optimal conjugation method was determined. However, it was important to understand that selectivity cannot be the only determining factor, as excellent sensitivity was also required for the assay to be applicable to clinical samples. Therefore, the conjugation schemes were evaluated using both selectivity and sensitivity as primary criteria.
In order to evaluate the selectivity of the ACNPs, changes were made to the FNPs only. Therefore, if more binding or less binding occurred it would be reflected through a change in fluorescence intensity while theoretically not affecting the total number of cells extracted from the sample. Selectivity was therefore determined by examining the largest differences between the target and control aptamer sequences. For this experiment, various conjugation chemistries were evaluated along with different levels of carboxylation and phosphonate groups. Adding phosphonate groups involved modifying the surface of the nanoparticle with unreactive phosphonate-silane molecules to preserve the negative charge on the nanoparticle surface once bioconjugation has occurred. The conjugation schemes studied include the following chemistries as illustrated in Figure 3: A) avidin-coated NPs and biotinylated aptamers (A/Biotin), B) NPs that were modified with streptavidin through EDC/NHS chemistry and conjugated with a biotinylated aptamer (SA-COOH), C) carboxylic acid-coated NPs prepared with a tricarboxylic acid-modified silane conjugated to an amine-labeled aptamer through EDC/NHS chemistry (3-COOH), D) carboxylic acid-coated NPs prepared with a monocarboxylic acid-modified silane conjugated to an amine-labeled aptamer through EDC/NHS chemistry (1-COOH), and E) amine-coated NPs prepared with an amine-modified silane and conjugated to a thiol-labeled aptamer through GMBS linker chemistry (NH2).
Figure 3.

Scheme of the major conjugation chemistries evaluated including A) avidin-coated NPs conjugated to biotinylated aptamers. B) Streptavidin modified NPs attached to biotinylated aptamers. C) Tricarboxyl silane modified NPs linked to amine modified aptamers through EDC chemistry. D) Monocarboxyl silane modified NPs conjugated to amine modified aptamers using EDC chemistry. E) Amine silane modified NPs coupled to thiol modified aptamers using GMBS.
Several of these chemistries were further evaluated with additional surface modifications and variations in nanoparticle preparation. The most common alteration was phosphonation in which a phosphonated silane was integrated into the preparation to maintain the surface charge of the nanoparticle even after bioconjugation has been performed and noted by a percentage due to the conjugation designation, not the actual surface composition. Other modifications included carboxylic acid-coated NPs prepared with a tricarboxylic acid-modified silane washed with BSA to block nonspecific associations conjugated to an amine-labeled aptamer through EDC/NHS chemistry noted as 3-COOHV. In addition, carboxylic acid-coated NPs prepared through microemulsion conjugated to an amine-labeled aptamer through EDC/NHS chemistry designated ME-COOH were also evaluated.
The results of the labeling step for the various FNPs with the target and control aptamer are shown in Figure 4. Based on the results shown in Figure 4, the A/Biotin (Fig. 3A) FNPs had the highest selectivity with the phosphonated NPs also showed the ability to discriminate between target and control cells. Non-phosphonated particles typically varied slightly between target and control response, this indicated that their binding was likely from nonspecific interactions as opposed to selective binding of the aptamer. In the sense of personalized medicine, a more selective NP modification would be desired for treatment of disease cells without affecting nondisease cells.
Figure 4.
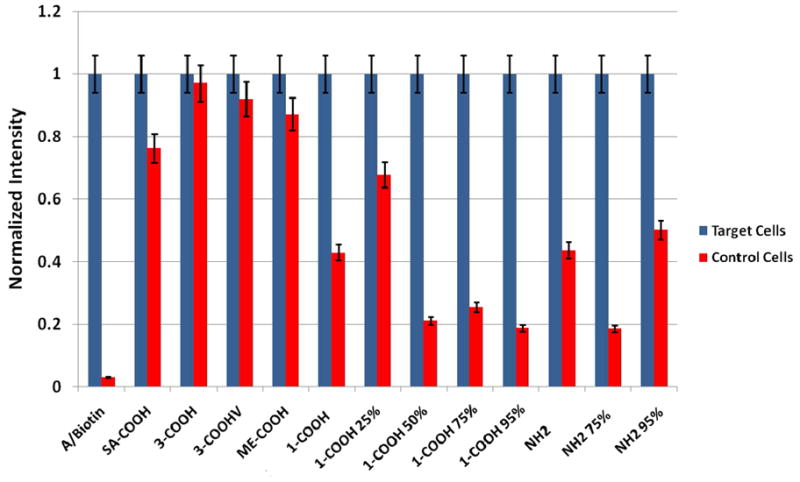
Each conjugation chemistry was evaluated with a target and control aptamer to determine the selectivity of the FNP component. Conjugation chemistries evaluated include 1) avidin-coated NPs with biotinylated aptamers, 2) streptavidin-coated NPs with amine-labeled aptamers, 3) several varieties of carboxyl-modified NPs with amine-labeled aptamers, 4) amine-coated NPs linked to thiol-modified aptamers and 5) several combinations of phosphonate-modified NPs to reduce nonspecific associations, where the 25%, 50%, 75%, and 95% indicate the percentage of carboxyl or amine used in the NP surface modification reaction.
In addition to selectivity, the intensity of the fluorescent signal was critical to the assay’s performance. An investigation of the FNP output was performed and the details of this study can be found in the Supporting Information section (Figure S-1). The 3-COOH modified NPs provided the greatest overall signal, but poorer selectivity.
Multi-Aptamer Nanoparticles
Variations in gene and protein expression, even in homogeneous cell populations, make it unlikely that any two cells are ever exactly the same. These variations become even more significant in cancer cells which are known for their frequency of mutation and abnormal protein expression not only within a patient, but additionally the variation possibilities from individual patients. Such abnormal expression does aid in their detection, as aptamers and antibodies are found that differentiate between normal and abnormal cells. Nevertheless, those same traits make detection difficult if different strains or samples of the same disease, which are used for diagnostics, have different expression levels of the proteins. In this regard, the cell-SELEX methodology has a significant advantage since it is generally feasible to develop a panel of aptamers that can selectively recognize different targets on the cancer cell surface. To take advantage of this property, we developed a strategy to incorporate multiple aptamers into this ACNP assay for specific cancer cell recognition. Utilizing multiple aptamer sequences also can make ACNPs more widely applicable. Even in cancer cells from the same patient, there will be variations in protein expression from cell to cell. These variations will only increase from patient to patient. Therefore, the necessity for a more “universal” recognition scheme is vital to the advancement of disease diagnosis and treatment. Multiple aptamers should increase the amount of cells collected, as some cells in the sample will likely not have as high expression of the single aptamer target making them difficult to extract from the sample. The use of multiple aptamers represents a pivotal advancement to cancer cell detection by the two particle assay, and could lead to advancements in treatment options beyond detection. In previous investigations, a single aptamer was used for both the MNPs and FNPs for the purpose of evaluating the two particle assay.17–18 However, since that time a panel of multiple dependable aptamers for the CEM cell line have become available, and this investigation of multiple aptamer conjugated NPs has become an essential component to the two particle method. Additionally, the ability of ACNPs to recognize several different proteins characteristic of a specific cancer type will provide a far more useful tool in clinical diagnostics. Even if one protein was relatively under expressed, the ACNPs will still bind to other proteins allowing detection of the cancer.
Two strategies for investigating the use of multiple aptamers were explored. The first used multiple NPs, each with a different aptamer sequence immobilized to target multiple sites on every cancer cell (Supporting Information: Alternative Strategy). The second involved conjugating multiple aptamer sequences to a single nanoparticle. In this arrangement, the different aptamer sequences were mixed in equal ratios prior to conjugation to the NPs, resulting in one type of MNP that had multiple aptamer sequences conjugated to its surface. This enabled the multiple aptamer sequences to be used while retaining the optimized amount of NPs for the analysis, determined in previous investigations.17 This method was first used to test the effectiveness of an increasing number of different sequences with the same amount of cells. For this experiment, MNPs were prepared with one, two, three, and four different aptamer sequences that were selective for the target cells. The same amount of MNPs was added to 25,000 target cells, and the standard extraction and labeling protocol were followed. The results in Figure 5A show the fluorescence intensity of that resulted from the extracted cell samples. The results indicated that increasing the number of different sequences on the MNPs led to an overall higher fluorescence intensity compared to a single aptamer sequence on the nanoparticle surface. When this experiment was repeated with control cells (data not shown), the additional sequences did not bind to the control cells, which indicated that all of the sequences were selective for the target cells. As a final comparison between the single and multiple aptamer MNPs, a calibration curve for each of the one-, two-, three-, and four-aptamer conjugated MNPs sequences were prepared to determine the limit of detection for each nanoparticle set.
Figure 5.

A) The overall fluorescence intensity of the assay utilizing MNPs with different aptamer sequences selected against the target cells, including NPs with one (blue diamonds), two (red squares), three (green triangles), and four (orange circles) distinct aptamer sequences conjugated. B) Response curves generated by extracting an increasing amount of target cancer cells (0, 1,000, 2,000, 5,000, 10,000, 20,000, and 40,000 cells) with a constant amount of NPs with one (blue diamonds), two (red squares), three (green triangles), and four (orange circles) distinct aptamer sequences conjugated.
The limit of detection (LOD) was calculated by adding the blank standard deviation multiplied by 3 to the blank signal and determining the LOD from the equation of the line generated by Microsoft Excel. Additionally, regression analysis of the error associated with the y-intercept and slope of the response curves was performed by Microsoft Excel. The errors in the blank sample and the errors calculated using regression analysis were comparable, but the estimated number of cells in the tested samples led to a greater uncertainty associated with the number of cells used per sample. Therefore, determination of the LOD by the method described was used for comparison purposes of improvements made to the two particle assay. The amounts of cells used in this investigation were consistent with the LOD determination performed in a previous publication.18 This study held the parameters consistent to the published protocol to allow for accurate comparison of the results. However, it should be noted that the LODs used are theoretical calculated values and utilized only as a guide for evaluating the changes made to the two particle assay. Each point of the calibration curve was an average of three extractions with the blank consisting of five extractions in the absence of cells. The results are shown in Figure 5B. All sets of NPs demonstrated a good linear dynamic range with R2 values above 0.997. The limits of detection were calculated based on three times the standard deviation of the blank measurement. The multiple aptamer NPs with four different aptamer sequences had the lowest calculated limit of detection at 6.6 cells, compared to the single aptamer NPs at 152 cells, with the two- and three-aptamer particle sequences at 45 and 97 cells, respectively. In comparison, the original limit of detection of this assay for the CEM cells was 250 cells18, which supported the validity of the multiple aptamer approach to improve the detection capability of this approach. A slight improvement was made for the single aptamer nanoparticle set, which incorporated the improved nanoparticle conditions without the use of multiple aptamers. However, an improvement of more than 35 times was made to the assay when the four aptamer system was used, which indicated that the critical aspect of this assay was aptamer recognition provided by the use of multiple aptamers. This demonstrated that the use of multiple aptamer NPs increased the sensitivity of the assay by accounting for the varying levels of surface protein expression inherent in living cell populations. The assay will be widely applicable for detection in other cell lines and patient samples, as protein expression levels would likely vary from the cell line used for selection, but should still express many of the same proteins.
Overall Nanoparticle System
With improvements made to several individual assay parameters, the final goal was to combine all the improvements and evaluate what combination of conjugation chemistry and aptamer number produced the most sensitive assay. Four sets of NPs were compared, both in terms of sensitivity and selectivity. Sensitivity was determined by preparing a response curve for each set of NPs, while selectivity was determined by comparing the responses of each set of NPs to a non-targeted cell line. The four sets of NPs compared were 1) avidin-coated FNPs with biotinylated aptamers with a single aptamer sequence on the MNPs, 2) avidin-coated FNPs with biotinylated aptamers with four aptamer sequences on the MNPs, 3) carboxyl-modified FNPs with amine-labeled aptamers with a single aptamer sequence on the MNPs, and 4) carboxyl-modified FNPs with amine-labeled aptamers with four aptamer sequences on the MNPs. All of the MNPs were avidin-coated with aptamers conjugated through biotinylated aptamers. These sets of NPs represented the best examples of selectivity and sensitivity with two intermediate conditions to determine the best overall combination of factors to maximize the sensitivity and selectivity of the assay. First, a response curve was generated for each set of NPs by using a constant amount of particles with an increasing number of target cells. The results for the response curves are shown in Figure 6. Each set of NPs showed a linear relationship to the amount of target cells in their linear range with R2 values greater than 0.994; however, the avidin/biotin particles had a much smaller linear range and exhibited a leveling of the fluorescent intensity at the higher numbers of cells, which indicated that the MNPs and FNPs were competing for binding sites. The higher cell numbers were not included in calculating the R2 values. The two highly selective particle sets, those with the avidin-biotin conjugation on the FNPs had, as expected, much lower overall fluorescent signals. However, their fluorescence background was similar to the other particle sets, which resulted in a less sensitive assay. The avidin/biotin particles with four aptamer sequences, at a limit of detection of 734 cells, did show a higher fluorescence signal and had an improved sensitivity over the single aptamer variety at 1,891 cells. They were below the sensitivity of the less selective carboxyl-amine-based particles at 6.6 and 152 cells for the four- and one-aptamer particle sequences. These results indicated the important role of the conjugation chemistry on the performance of the two particles assay, while the multiple aptamer approach remained the critical effect on this detection scheme. Both carboxyl-amine-labeled particle sets had much higher fluorescence intensities, while the less selective FNPs had similar backgrounds to the other nanoparticle sets. For clinical applications, the more selective particle sets would be more attractive for a more “universal” targeting of treatment agents, while the more sensitive NP sets could be more attractive for diagnosis applications.
Figure 6.

A) Response curves generated by extracting an increasing amount of target cancer cells (0, 1,000, 2,000, 5,000, 10,000, 20,000, and 40,000 cells) with different optimized sets of aptamer-conjugated NPs. These include one aptamer sequence conjugated to MNPs with one aptamer sequence to avidin-biotin-conjugated FNPs (orange circles) and carboxyl-amine conjugated NPs (blue squares) and four aptamer sequences conjugated to the MNPs with avidin/biotin conjugated FNPs (green triangles) and carboxyl-amine based NPs (red diamonds). B) Insert focused on the lower region of the response curve.
While the different sets of particles showed similar background levels in the blank, the true test of selectivity was to measure the response against a large amount of control cells where nonspecific associations would be detected. Therefore, each set of particles was incubated with 40,000 control cells. The levels of the control cells were compared to the response of 40,000 target cells, and the results are shown in Table 1. The %RSDs for the different particle types ranged from 2% to 5%. The less selective carboxyl-amine particles demonstrated a response to the control cells similar to the more selective avidin-biotin conjugated NPs. This indicated that the selectivity of the MNPs was sufficient to create a highly selective assay. Based on these results, the multiple aptamer conjugated carboxyl-amine-modified NPs served as the most appropriate agent for the detection of the cancer cells.
Table 1.
Extraction of 40,000 Target and Control Cells with different nanoparticle types
| Nanoparticle Sample | Target Cell Signal | Control Cell Signal | Signal to Background |
|---|---|---|---|
| 1AMNP AB FNP | 4200 (±2%) | 980 (±4%) | 4.3 |
| 4AMNP AB FNP | 5600 (±5%) | 1080 (±4%) | 5.2 |
| 1AMNP COOH FNP | 37700 (±5%) | 810 (±4%) | 47 |
| 4AMNP COOH FNP | 56900 (±2%) | 1000 (±3%) | 57 |
CONCLUSION
Detecting exfoliated tumor cells represents a distinct challenge for any analytical method. Exfoliated tumor cells in the blood are present at extremely low numbers, while being surrounding by countless other cell types, proteins, and other species. Therefore, an approach that offers a selective extraction and enrichment of the cells from this complicated matrix, along with subsequent sensitive detection, is necessary to achieve success in this endeavor. The use of ACNPs to extract, enrich, and then label the cells with highly FNPs is an approach that can achieve this goal. ACNPs have demonstrated significant utility for the extraction and detection of cancer cells from complex matrices such as blood and serum samples.17–18 However, making the technology more applicable to the screening and detection of exfoliated tumor cells requires optimization and further advancements of the methodology to increase the sensitivity.
The work detailed herein investigated and confirmed several parameters which, when combined, achieve significant advancement in this technology for cancer cell detection. The parameters included particle size, fluorophore selection, conjugation chemistry, and the number of aptamer sequences conjugated to the particles, with the use of multiple aptamers being an innovative improvement made to this system. The multiple aptamer concept could be implemented in numerous detection and treatment formats. The results demonstrate that 60nm MNPs were the most efficient means of extraction from mass perspective versus larger-sized particles. It was demonstrated that the TMR-doped FNPs produced the greatest signal-to-background difference and that the most sensitive conjugation chemistry utilized the avidin/biotin conjugation for the MNPs, while having the least selective tricarboxyl-modified FNPs. The excellent discriminatory power of the avidin/biotin MNPs permitted the use of fluorescent particles with the highest overall intensity, yielding the assay with the highest sensitivity, while maintaining the overall selectivity. The use of multiple aptamer sequences on the NPs was demonstrated to further increase the sensitivity without impacting the selectivity of the NPs against the control cells. The multiple aptamer approach represented the aspect of this investigation that contributed most to the advancement of this technology. When the different parameters were combined, the most sensitive and selective ACNP system was determined, and demonstrated an extremely low theoretical limit of detection of 6.6 cells with the multiple aptamer system. Additionally, the aptamer conjugation protocol played an important role for the selectivity of this technique. Future directions for this line of research include testing additional target and control cell lines, leading to the testing of patient samples, if experiments with additional cell lines prove successful. This approach can be adapted for different types of cancer to further demonstrate the potential of ACNPs for the extraction and detection of cancer cells.
Supplementary Material
Acknowledgments
We would like to thank NIH and NSF for the funding. This work was supported by NIH grants R01 CA 133086 and R01 GM066137.
Footnotes
“Supporting Information Available: This material is available free of charge via the Internet at http://pubs.acs.org.”
References
- 1.Mor G, Visintin I, Lai Y, Zhao H, Schwartz P, Rutherford T, Yue L, Bray-Ward P, Ward DC. Serum protein markers for early detection of ovarian cancer. Proceedings of the National Academy of Sciences, USA. 2005;102:7677–7682. doi: 10.1073/pnas.0502178102. [DOI] [PMC free article] [PubMed] [Google Scholar]
- 2.Houillier C, Lejeune J, Benouaich-Amiel A, et al. Prognostic impact of molecular markers in a series of 220 primary glioblastomas. Cancer. 2006;106:2218–23. doi: 10.1002/cncr.21819. [DOI] [PubMed] [Google Scholar]
- 3.Heimberger AB, Hlatky R, Suki D, et al. Prognostic effect of epidermal growth factor receptor and EGFRvIII in glioblastoma multiforme patients. Clin Cancer Res. 2005;11:1462–6. doi: 10.1158/1078-0432.CCR-04-1737. [DOI] [PubMed] [Google Scholar]
- 4.Heimberger AB, Sampson JH. The PEPvIII-KLH (CDX-110) vaccine in glioblastoma multiforme patients. Expert Opin Biol Ther. 2009;9(8):1087–98. doi: 10.1517/14712590903124346. [DOI] [PMC free article] [PubMed] [Google Scholar]
- 5.Tjoa B, Boynton A, Kenny G, Ragde H, Misrock SL, Murphy G. Presentation of prostate tumor antigens by dendritic cells stimulates T-cell proliferation and cytotoxicity. Prostate. 1996;28(1):65–69. doi: 10.1002/(SICI)1097-0045(199601)28:1<65::AID-PROS9>3.0.CO;2-N. [DOI] [PubMed] [Google Scholar]
- 6.Li J, Fang XH, Tan W. Biochem Biophys Res Commun. 2002;292:31–40. doi: 10.1006/bbrc.2002.6581. [DOI] [PubMed] [Google Scholar]
- 7.Knox KK, Brewer JH, Henry JM, Harrington DJ, Carrigan DR. Clin Infectious Diseases. 2000;31(4):894–903. doi: 10.1086/318141. [DOI] [PubMed] [Google Scholar]
- 8.Cerchia L, Hamm J, Libri D, Tavitian B, Franciscis V. FEBS Letters. 2002;528:12–16. doi: 10.1016/s0014-5793(02)03275-1. [DOI] [PubMed] [Google Scholar]
- 9.Gold L. J Biol Chem. 1995;270:13581–13584. doi: 10.1074/jbc.270.23.13581. [DOI] [PubMed] [Google Scholar]
- 10.Hermann T, Patel D. J Science. 2000;287:820–825. doi: 10.1126/science.287.5454.820. [DOI] [PubMed] [Google Scholar]
- 11.Shangguan D, Li Y, Tang Z, Cao ZC, Mallikaratchy P, Sefah K, Yang CJ, Tan W. Proc Natl Acad Sci USA. 2006;103:11838. doi: 10.1073/pnas.0602615103. [DOI] [PMC free article] [PubMed] [Google Scholar]
- 12.Chen H, Medley CD, Sefah K, Shangguan D, Tang Z, Smith JE, Meng L, Tan W. Chem Med Chem. 2008;3:991. doi: 10.1002/cmdc.200800030. [DOI] [PMC free article] [PubMed] [Google Scholar]
- 13.Shangguan D, Meng L, Cao ZC, Xiao Z, Fang X, Li Y, Cardona D, Witek RP, Liu C, Tan W. Anal Chem. 2008;80:721. doi: 10.1021/ac701962v. [DOI] [PubMed] [Google Scholar]
- 14.Tang Z, Shangguan D, Wang K, Shi H, Sefah K, Mallikaratchy P, Chen WH, Li Y, Tan W. Anal Chem. 2007;79:4900. doi: 10.1021/ac070189y. [DOI] [PubMed] [Google Scholar]
- 15.Shangguan D, Cao ZC, Li Y, Tan W. Clinical Chemistry. 2007;53:1153–1155. doi: 10.1373/clinchem.2006.083246. [DOI] [PubMed] [Google Scholar]
- 16.Tang Z, Shangguan D, Wang K, Shi H, Sefah K, Mallikaratchy P, Chen HW, Li Y, Tan W. Analytical Chemistry. 2007;79(13):4900–4907. doi: 10.1021/ac070189y. [DOI] [PubMed] [Google Scholar]
- 17.Herr JK, Smith JE, Medley CD, Shangguan D, Tan W. Anal Chem. 2006;78:2918. doi: 10.1021/ac052015r. [DOI] [PubMed] [Google Scholar]
- 18.Smith JE, Medley CD, Tang Z, Shangguan D, Lofton D, Tan W. Anal Chem. 2007;79:3075. doi: 10.1021/ac062151b. [DOI] [PubMed] [Google Scholar]
Associated Data
This section collects any data citations, data availability statements, or supplementary materials included in this article.