

Abstract
The RNA-directed RNA polymerase P2 from cystovirus φ6 catalyzes the de novo synthesis of positive and negative strands of the viral double-stranded RNA genome. P2 is mobile on the slow, μs-ms timescale with various motional modes putatively assisting in RNA translocation and catalysis. Here we investigate the influence of the extreme 3′-end sequence of the single-stranded RNA templates and the nature of the substrate nucleotide triphosphates on these motional modes using multiple-quantum NMR spectroscopy. We find that P2, in the presence of templates bearing the proper genomic 3′-ends or the preferred initiation nucleotide, displays unique dynamic signatures that are different from those in the presence of non-physiological templates or substrates. This suggests that dynamics may play a role in the fidelity of recognition of the correct substrates and template sequences to initiate RNA polymerization.
The 75 kDa RNA-directed RNA polymerase (RdRP) P2 from the bacteriophage φ6 lies at the heart of the four protein polymerase complex (PX) (1). The PX encloses the three-segmented (small - S, medium - M and large - L) double-stranded RNA (dsRNA) genome and functions as the infectious particle in the host cytoplasm. P2 has an overall fold (see Figure 1) common to DNA and RNA polymerases and consists of fingers, palm, thumb domains (2, 3) and additional loops (fingertips) connecting the fingers and the thumb forming an enclosed template tunnel that accommodates single but not double-stranded RNA (4). P2 contains the conserved polymerase sequence motifs A-F (3) and acts both as a replicase, synthesizing minus-strand RNA from plus-strand templates, and as a transcriptase generating plus-strand RNA using minus-strand templates (5-8).
Figure 1.
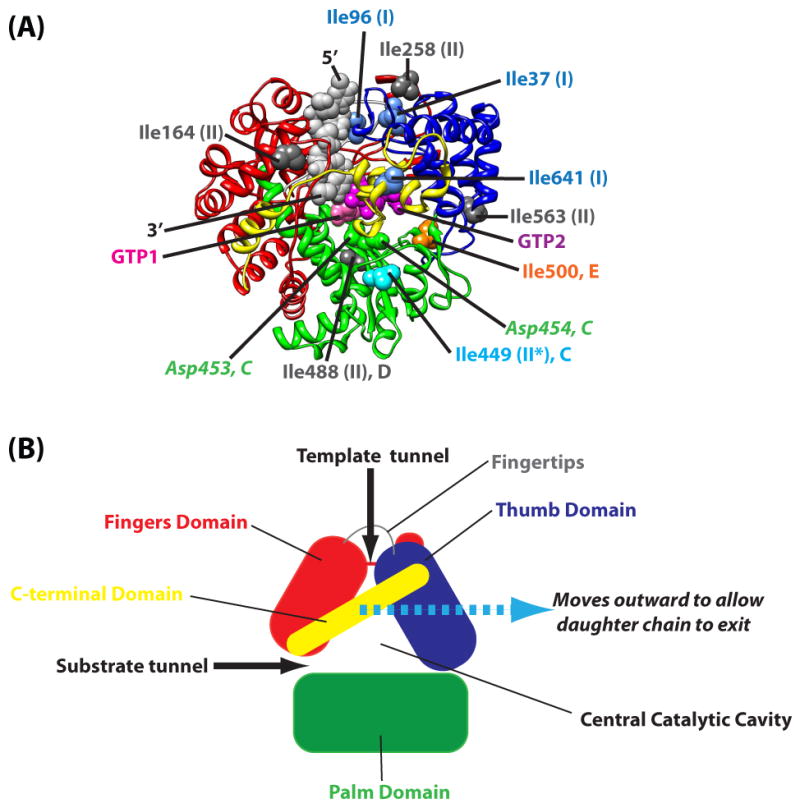
(A) φ6 P2 showing the conserved polymerase fold (4). The fingers domain (red; 1-30, 104-276, 333-397), thumb domain (blue; 37-91, 518-600), palm domain (green; 277-332, 398-517) and C-terminal domain (yellow; 601-664) are shown. Key Ile residues that are shown to undergo slow, μs-ms timescale dynamics in apo-P2 characterized previously (19) are labeled. Ile residues that undergo Group I and Group II are represented by blue and dark grey spheres respectively and labeled accordingly. Ile449 (motif C) undergoes slow dynamics (group II) only under certain circumstances (indicated by a “*”) and is depicted by a light blue sphere. Ile500 (motif E) that switches between the fast (group I) and slow motional (group II) modes is shown in orange. The two bound GTP molecules (pink and purple) are shown, as is the template single-stranded RNA (grey, 5′- and 3′-ends labeled). The conserved Asp residues, Asp453 and Asp454 (a part of the G/SDD motif found in DNA and RNA polymerases), that lie on motif C are represented by green spheres and labeled. (B) Schematic representation of P2 structure showing the structural domains and template and substrate channels.
Several structures of P2, representing complexes with nucleotide triphosphate (NTP) substrates and single-stranded RNA (ssRNA) templates, are available (4, 9-11). These structures provide detailed insight into the nature of the initiation complex, template requirement and metal ion specificity. In spite of the availability of a large amount of crystallographic information, a substantial degree of conformational dynamics is required (as discussed below) to interpret these static snapshots in mechanistic/functional terms (4). For RdRPs such as the poliovirus 3Dpol for which both structural as well as kinetic data are available (12), the need for significant conformational rearrangements to reconcile structural and biochemical information is evident. For example, as revealed by biochemical studies, a basic residue (Lys359) on the highly dynamic motif D, functions as a general acid protonating the pyrophosphate product (13). However, this residue has not been crystallographically trapped in a conformation consistent with this role (14). Indeed, the rate-limiting step for phosphodiester bond formation has been suggested to be a conformational change (12, 15). In addition, there exists a large amount of evidence hinting that catalysis by RNA polymerases may be influenced by effects transmitted from distant sites e.g. a remote site that has been demonstrated to exert allosteric control over transcriptional fidelity in 3Dpol (16, 17). Similar effects have also been seen in a close structural homolog of P2, hepatitis C virus polymerase (HCVpol). HCVpol contains a surface GTP-binding site which though distant (∼ 30 Å) from the catalytic center can be targeted by small molecule inhibitors of catalytic activity (18).
Given these indications suggesting a role played by dynamics in RNA polymerase function (14), the need to characterize these effects in representative RNA polymerases in atomistic detail at specific steps along the catalytic pathway to complement available structural and biochemical information cannot be overstated. Towards this goal, we recently characterized dynamics of φ6 P2 on the fast (ps-ns) and slow (μs-ms) timescales using the 25 Ile residues, that are more-or-less evenly distributed over its structural domains and conserved sequence motifs, as probes (19). We found that, for apo P2, on the fast timescale, the entrances to both the template and substrate entry portals (see Figure 1) were highly dynamic; the catalytic motifs were rigid, becoming more ordered in the presence of ssRNA. More importantly, on the slow timescale considered to be relevant for catalysis, two broadly classified dynamic regimes (Figure 1, Table 1) were seen represented - a faster timescale (Group I with an effective rate constant, kex∼1200-1500 s-1) and a slower timescale (Group II with kex∼500-800 s-1) (19). The Group I motional timescale, involving the template entry portal (probed by Ile37 and Ile96) and the C-terminal domain (CTD, probed by Ile641), was coincident with that predicted for template translocation from kinetic analyses of RNA (12) and DNA (15) polymerases. Indeed, their locale was in line with current models for template translocation by motions of the thumb and the fingertips (20) and exit of the daughter chain by motion of the CTD (4). However, motions that involve RNA translocation have been shown not to be rate limiting in DNA (15) and RNA (12) polymerases.
Table 1. Residues that show slow μs-ms timescale dynamicsa.
| Residue | Location | Slow Motional Timescale |
|---|---|---|
| Ile37 | Thumb, template entry portal | I |
| Ile96 | Fingertips, template entry portal | I |
| Ile164b | Fingers, plough region | II |
| Ile258 | Fingers | II |
| Ile449c | Palm, motif C | II |
| Ile488 | Palm, motif D | II |
| Ile500 | Palm, motif E | Switches between I and II |
| Ile563 | Base of thumb | II |
| Ile641d | C-terminal domain | I |
These are the motional timescale seen for most of the states analyzed (19).
The plough region is known to be coupled to transcriptional efficiency i.e. catalysis (11).
Motif C bears the conserved 452S(G)DD454 motif.
The motion of the C-terminal domain seems to assist in the exit of the daughter chain (4).
An analysis of the nucleotide addition cycle in the homologous RNA polymerase 3Dpol used three kinetic processes to model the slow steps of the nucleotide addition cycle – (1) the ternary complex between polymerase, RNA and substrate nucleotides undergoes a conformational change to form an activated complex (kforward = 300 s-1, kreverse = 500 s-1; expected kex in dispersion experiments = 800 s-1), (2) single nucleotide addition occurs through formation of a new phosphodiester bond between two substrate nucleotides (kforward = 520 s-1, kreverse = 375 s-1; expected kex in dispersion experiments = 895 s-1) and (3) deactivation of the product complex (with the product pyrophosphate bound) occurs (kforward = 500 s-1, kforward ≫ kreverse; expected kex in dispersion experiments ∼ 500 s-1) (12). These steps are followed by faster pyrophosphate release and RNA translocation. While similar measurements are not available for P2, the overall similarities between 3Dpol and P2 would suggest that similar functional mechanisms and rates could be expected for the nucleotide addition cycle of P2. This puts the kex values relevant to catalysis in the same time regime as those seen for the slower, Group II motions (19). Therefore we sometimes refer to Group II motions as occurring on the “catalytic timescale” suggesting only a coincidence of dynamic rates determined by NMR with those proposed to be relevant for catalysis. These Group II motions were reported by Ile residues (Table 1) near the catalytic site (Ile449 on motif C, Ile488 on motif D), at remote sites shown to be coupled to transcriptional efficiency (Ile164 on the “plough” region) (11) and additional residues located on the outer edge of the template tunnel (Ile258 on the fingers) and Ile563 (on the base of the thumb). In addition, Ile500 that lies on motif E (palm) seemed to switch between timescales I and II depending on the complexes analyzed representing different points along the catalytic pathway. That work (19) represented the first instance of a comprehensive analysis of the dynamics of a full-length canonical RdRP by NMR. Recently, Yang et. al. (17) utilized a similar coarse-grained approach, using the 17 Met residues in 3Dpol to demonstrate very long-range effects on catalytic fidelity by NMR relaxation measurements in solution.
In order to obtain further insight into the role of motion in P2 function, here we analyze the conformational dynamics of P2 using relaxation dispersion measurements of 13C,1H multiple-quantum coherences (21) at the 25 Ile δ1 positions in P2, focusing specifically on the influence of the substrate NTPs, the sequence of the template ssRNA, thereon. Thus, combining results from our previous publication (19) with new data obtained for P2 in the presence of a set of template ssRNAs, an additional NTP substrate and for a non-physiological initiation complex (to contrast its differences with a correct physiological one), we find additional support for the motion that dynamics may indeed play a role in RNA processing by P2. Our results indicate that the nature of dynamics in P2 in the presence of the physiologically correct substrates and ssRNA templates is distinct from that in the presence of non-optimal substrates and non-genomic template sequences.
Materials and Methods
Expression, purification, sample preparation and resonance assignment of φ6 P2
The detailed protocol for expression and purification of φ6 P2 has been described in depth in our recent paper (19) and is not reproduced here. In brief, the φ6 P2 plasmid was constructed from the pLM687 plasmid (22) as described, and sub-cloned into a pET28a(+) (Strategene) vector between the NdeI and EcoRI sites. The P2 protein was expressed as an N-terminal His6 fusion using E. coli BL21-DE3 (Agilent) cells pre-adapted for growth in D2O using M9 media prepared in 100 % D2O containing 3 g/L of U-[12C,2H]-glucose and 1 g/L of 15NH4Cl as the sole carbon and nitrogen sources respectively, followed by addition of 50 mg of 2-keto-3-d2-4-13C-butyrate (Cambridge Isotope Laboratories) at an OD600 of 0.6 and induction using 1 mM IPTG after 1 hour of growth. The uniformly-15N,2H-Ile-δ1-13C,1H-labeled P2 protein was purified using a nickel affinity (Ni-NTA agarose, Qiagen) chromatography and exchanged into a buffer containing 20 mM bis-tris, 400 mM NaCl, 4 mM DTT and 5 mM MgCl2 at pH 6.5. This buffer was taken to be the reference state in determining chemical shift perturbations and in the relaxation dispersion experiments. Note that this corresponds to Mg+2-bound state described by Ren et. al. (19). The P2 concentration in the NMR experiments varied from 250-300 μM.
Spectral Analyses
All NMR experiments were performed at 25° C on a Varian Inova 600 MHz spectrometer equipped with a triple-resonance {1H,13C}-cryogenic probe capable of applying pulsed field gradients along the z-axis. Sweep-widths of 9000 and 1600 Hz in the direct (1H, 512 complex points) and indirect (13C, 32 complex points) dimensions respectively, were used for all NMR experiments. The 13C carrier was positioned at 13.15 ppm (the center of the Ile 13Cδ1 resonances for P2).
The 13C,1H resonances corresponding to the δ1 positions of the 25 Ile residues in φ6 P2 were assigned using a combination of 13 single and 12 triple Ile→Leu mutants using a strategy that has been described in detail elsewhere (19). Resonances corresponding to Ile211 and Ile283 could not be assigned with confidence and therefore chemical shift perturbations and relaxation dispersion data corresponding to these resonances were not analyzed.
Chemical shift changes (with respect to the reference state, Δδ in Hz) in the presence of template ssRNA or substrate NTPs or in the ternary complexes were calculated using:
| (1) |
δref,C/H and δC/H are the 13C/1H chemical shifts (in 13C,1H HMQC spectra) in the reference state and particular complexes, respectively. The spectrometer frequency ν0 was 600 MHz in the present case. AMPCPP (purchased from Sigma) and GMPCPP (custom synthesized by Jena Biosciences), the non-hydrolysable analogs of the substrates ATP and GTP respectively, were obtained commercially. The AMPCPP and GMPCPP concentrations were kept at 5 mM in all states that required their use. ssRNA constructs for the NMR studies were purchased PAGE purified from Integrated DNA Technologies Inc. The ssRNA concentration in NMR experiments was kept at least 5 times that of P2. All NMR samples contained 1 unit/μL of an RNAse inhibitor (New England Biolabs).
Fluorescence anisotropy measurements
Fluorescence anisotropy measurements were performed using ssRNA oligos 5′-labeled with 6-carboxyfluorescein. The HPLC purified oligos were purchased from Dharmacon RNAi Technologies. All experiments utilized a Panvera Beacon 2000 fluorescence anisotropy system with excitation at 490 nm and analysis of the emitted fluorescence after passage through a 520 nm cutoff filter. 4 combinations of the horizontal and vertical polarization filters were used with a 10 second averaging time. The measured intensities for the 4 polarizer settings in the presence of increasing amounts of P2, were converted into anisotropy (A) values and the dissociation constants (Kd) were obtained from the following equation:
| (2) |
A(C) is the anisotropy when the concentration of P2 is C and A∞ is the limiting anisotropy value. The concentration of RNA (CRNA) was kept constant at 5 nM. All experiments were performed at pH 6.5 in the NMR buffer containing 1 unit/μL of RNAse inhibitor (New England Biolabs). The reduced absolute fluorescence of the carboxyfluorescein moiety at this pH does not lead to any complications as demonstrated previously (19).
All fits to experimental data (Equations 2, 4) were performed using in-house programs that utilize the ODRPACK subroutines (23). Errors in the fitted parameters were obtained from the inverse covariance matrices of the fits and included both the random as well as the model selection errors.
Multiple-quantum dispersion measurements
13C,1H multiple quantum relaxation dispersion curves were obtained using pulse sequences developed by Korzhnev et. al. (21). 15 values of the RF-field strength (ν1 = 1/2τCPMG, where τCPMG is the spacing between successive π pulses): 31.25, 62.5, 93.75, 125.0, 156.25, 187.5, 250.0, 312.5, 375.0, 437.5, 500.0, 625.0, 750.0, 875.0 and 1000 Hz, were used with a constant relaxation delay of 32 ms, collecting 128 transients per t1 point. Data for each ν1 value were acquired in an interleaved fashion with all ν1 values collected prior to t1 incrementation in order to minimize possible errors resulting from sample heating and/or precipitation and to increase the accuracy of the fitted exchange parameters. The peak intensities (I(ν1)), and errors thereof, for each of the resonances corresponding to the 25 Ile residues was obtained by a non-linear least squares analysis of the 2-dimensional lineshapes for spectra collected for each value of ν1. The reference spectrum used for peak picking was missing the relaxation delay (T=0) and was collected in triplicate to assess spectrometer and sample stability. The 2-dimensional least squares fits were carried out using the nlinLS module of the NMRpipe software package (24). The measured intensities I(ν1) were converted into effective multiple-quantum relaxation rates (ΓMQ,eff(ν1)) using the following formula
| (3) |
Where I0 is peak intensity averaged over the three measurements of the reference spectrum. The errors in (ΓMQ,eff(ν1) were obtained by using standard error propagation (for Equation 3) utilizing the errors in I0 and I(ν1) from the non-linear least square analysis of the 2-dimensional lineshapes.
All dispersion data were fitted assuming the fast-exchange regime (see below) using Equation 4 (21, 25). The (ΓMQ,eff(ν1) values in this regime are given by
| (4) |
kex is the sum of the forward and reverse rates assuming a two-state exchange model (A B); ξ=2pA(1-pA)ΔωHΔωC; pA is the fractional occupancy of state A (the fractional occupancy of state B, pB = 1-pA); and ΓMQ(∞) is the limiting value of the multiple-quantum relaxation rate i.e. the value of ΓMQ,eff in the absence of chemical exchange. The condition of small ΔωHΔωC in addition to the fast exchange condition (ΔωHΔωC)1/2 ≪ kex is required for Equation 4 to hold (19). In the present case, this is expected to be valid even for states that involve tighter binding since we are not directly probing the specific residues directly involved in the binding process, a fact borne out by the relatively small chemical shift perturbations seen. The approach utilized here allows only the kex values, obtained as one of the parameters in a three-parameter (kex, ΓMQ(∞) and ξ) fit of the experimental dispersion curves to Equation 4, to be interpreted quantitatively.
In almost all of the cases, data for all 15 ν1 values were used in the individual fits. In a small number of cases, 1-2 data points for which the errors in the I(ν1) values were greater than 50 % (resulting from low signal-to-noise ratio) more than the average error for all points in that series, were excluded from the final fits. The points that fulfilled this criterion were Ile500 for the reference state (2 points) and Ile449 for TCA (2 points) (as explicitly stated in Tables 3-5) both from data collected for our previous publication (19). The new kex values obtained in these cases were unchanged within error bounds.
Table 3. kex values (in sec-1) of P2 in the presence of different single-stranded RNA templatesa,b.
| State | Ile37 | Ile96 | Ile164 | Ile258 | Ile488 | Ile500 | Ile563 | Ile641 |
|---|---|---|---|---|---|---|---|---|
| Referencec | 1292±86 | 1537±142 | 210±109 | 311±74 | 577±61 | 1613±232d | 418±241 | X |
| C1 | 1535±382 | 1132±257 | X | ND | 491±176 | 1450±274 | ND | X |
| C2 | 1140±265 | 1007±104 | X | ND | 547±157 | 1193±284 | ND | X |
| C5 | 1145±98 | 1287±95 | 306±116 | 734±192 | 403±174 | 1486±248 | ND | 580±112 |
ND implies that the relaxation rate (ΓMQ,eff) was independent of the applied ν1 field. X implies that the quality of the data did not allow quantitative kex values to be extracted.
Data for Ile449 is not shown in Tables 3 and 4 (below) since the states characterized either do not show field dependent relaxation rates (i.e. ND) or the quality of the data did not allow quantitative estimation of the kex values (i.e. X).
P2 in the NMR buffer containing 5 mM Mg+2 was taken as the reference state. Data for the reference state is from Ren et. al. (19).
Data for Ile500 in the reference state was refitted excluding two points with large errors. The kex value obtained was unaltered within confidence bounds to that obtained previously (19).
Table 5. kex values of P2 in two stable initiation complexesa.
| State | Ile37 | Ile96 | Ile164 | Ile258 | Ile449 | Ile488 | Ile500 | Ile563 |
|---|---|---|---|---|---|---|---|---|
| TCAb | 1811±522 | ND | ND | ND | 381±95c | 671±145 | 972±186 | ND |
| TCBd | 1166±130 | 2273±372 | ND | ND | ND | X | 1411±326 | ND |
Data for Ile641 is not shown since the quality of the data for the two ternary complexes did not allow quantitative estimation of the kex values.
TCA is a ternary complex between P2, GMPCPP and template C1 (5′-UUUCC-3′) (see Figure 6A). Data for TCA taken from Ren at. al. (19).
Data for Ile449 in TCA was refitted excluding two points with large errors. The kex value obtained was unaltered within confidence bounds to that obtained previously (19).
TCB is a ternary complex between P2, AMPCPP and template C5 (5′-UUUUU-3′) (see Figure 6B).
In additional to the individual fits, we also performed global fits for residues that displayed the fast (Group I) and slow (Group II) dynamic modes. This was accomplished by using a grid-search over the kex values (a common value was used for all residues within the group) combined with an orthogonal distance regression for individual ΓMQ(∞) and ξ values (Equation 4). The boundaries of the grid-space were defined by the upper and lower bounds of the kex values obtained by the fits of individual residues in the group and adjusted if required, using a grid size of 50 s-1. The level of theory and experimental precision here, cannot justify use of a finer grid.
Another point to note is that the exchange processes determined here arise from true conformational dynamics given that the ligand binding/unbinding i.e. on/off processes are expected to be at least an order of magnitude faster (for the highest Kd value) than the fastest rate measured here, assuming a diffusion controlled on-rate. Therefore these on/off processes are unlikely to contribute to the kex values obtained in the present case.
Results and Discussion
Influence of Template 3′-ends
It has been shown that for φ6 P2, the efficiency of RNA polymerization depends on the sequence at the extreme 3′-ends of the ssRNA template especially with respect to the two penultimate bases (6, 8). The 3′-ends of the minus strands of the S (s-) and M (m-) genomic segments that contain a 5′-…UUUCC-3′ sequence are utilized more efficiently than the minus strand of the L segment (l-) that contains 5′-…UUUAC-3′ or the 3′-ends of the genomic plus strands (s+, m+, l+) containing a 5′-…UCUCU-3′ sequence. We first tested whether this difference in template utilization could be attributed to the affinity with which P2 recognizes the 3′-end sequence. We measured the affinities towards P2 of five 5-nt templates (C1-C5, see Table 2) with varying 3′-end sequences, by monitoring the change in fluorescence anisotropy of these constructs bearing a 5′-carboxyfluorescein-tag in the presence of increasing amounts of protein. The affinities of two additional 7-nt templates were also measured (Table 2). The Kd values (Table 2) thus obtained varied from 1.2 ± 0.1 μM (C5) to 295.9 ± 15.2 μM (C2) with those corresponding to the 3′-segments of the genomic minus-strands (C1, C6 - s-, m- and C2 - l-) binding with the lowest affinity (Figure 2). Based on our analysis, it appears that P2 prefers U over C at the 3′-ends for stronger binding. The greatly reduced affinity for the sequence corresponding to the 3′-end of l- (C2) may be explained by the presence of a larger purine base (A) as previously suggested (4). Interestingly, sequences containing a UU (C5) or a CU (as in the genomic s+, m+ and l+; C3 and C7) at their 3′-ends that have a substantial higher affinity towards P2 but are processed less efficiently compared to the CC sequence (as in s- and m-; C1 and C6). Thus, the affinity follows the trend (strongest to weakest binding) UU > UC > CU > CC > AC, while the template efficiency is CC > UC > AC > CU (6, 8). It is also known that templates bearing a UU at the 3′-end are less efficiently utilized than those terminated with a UC sequence (6). Thus, template utilization and by inference formation of a stable functional initiation complex cannot be related in a simple way to binding affinity and is likely a more complex function of affinity and changes in structure and dynamics of P2 resulting from template and substrate binding.
Table 2. Apparent binding affinity of φ6 P2 towards single-stranded RNA sequencesa.
| Template | Sequence | Kd (μM) |
|---|---|---|
| C1 | 5′-UUUCC-3′b | 53.2 ± 3.5e |
| C2 | 5′-UUUAC-3′c | 295.9 ± 15.2 |
| C3 | 5′-UUUCU-3′d | 15.3 ± 1.4 |
| C4 | 5′-UUUUC-3′ | 6.6 ± 0.4e |
| C5 | 5′-UUUUU-3′ | 1.2 ± 0.1 |
| C6 | 5′-UUUUUCC-3′b | 129.9 ± 4.4 |
| C7 | 5′-UUUUUCU-3′d | 15.0 ± 0.7 |
Relaxation data were collected for P2 in the presence of templates that are indicated in boldface (see Table 3).
3′-end of the minus strands of the M (m-) and S (s-) genomic segments.
3′-end of the minus strands of the L (l-) genomic segment.
3′-end of the plus strands of the L (l+), M (m+) and S (s+) genomic segments.
In agreement with that reported by Ren et. al. (19).
Figure 2.

Representative binding curves demonstrating the affinities of several ssRNA constructs towards φ6 P2, determined by fluorescence anisotropy measurements using 5′-carboxyfluorescein tagged ssRNA. Only a few binding curves are shown for ease in illustrating their differences.
Next, we tested whether the nature of ssRNA sequence plays a role in modifying the dynamics of P2 on the slow μs-ms timescale by measuring the RF-field (ν1) dependence of the Ile-Cδ1 13C,1H MQ relaxation rates. We collected data for three constructs C1, C2 and C5 that span the range of Kd values (Table 2) with the first representing the genomic s- and m- 3′-ends and the second the 3′-end of the genomic l- segment, the two weakest binders and the third (C5) being the strongest binder to P2. Representative examples of experimental dispersion curves and the corresponding fits to Equation 4 are depicted in Figure 3. Overlay of 13C, 1H HMQC spectra of P2 in the presence of the three constructs is shown in Figure 4 to illustrate the spectral quality.
Figure 3.

Representative dispersion curves with experimental data depicted by circles and fits to Equation 4 by solid lines. (A) Data for the fingertips residue Ile96. (B) Data for the motif C residue Ile449. (C) Data for the motif E residue Ile500. (D) Data for Ile641 that lies in the C-terminal domain. The blue line in (A) and the red line in (B) are drawn to guide the eye and do not represent fits. These correspond to situations where the dispersion curves are flat i.e. ΓMQ,eff values are independent of ν1. Data for only a small number of states are shown for visual convenience.
Figure 4.

Overlay of the reference spectra (φ6 P2 in the NMR buffer, black) with each of three templates C1 (5′-UUUCC-3′, 3′-ends of the genomic s- and m- strands, orange), C2 (5′-UUUAC-3′, 3′-end of the genomic l-, green) and C5 (5′-UUUUU-3′, purple).
The common feature of the influence on the slow dynamics of P2 for the three ssRNAs tested (Table 3) was the complete suppression of slow motion in the Group II residue Ile563 that lies at the base of the thumb domain (Figure 1). However, the correct genomic 3′-ends (C1 and C2) also resulted in a complete suppression of slow dynamics in the Group II Ile258 (on the fingers domain) while this motion persisted for C5. Ile641 that has been shown to be dynamic on the Group I timescale (quantitative data could not be obtained for this residue in the reference state, a kex value of 1358 ± 109 s-1 was found in the apo state (19)) seemed to display dynamics on a much slower timescale (kex= 580 ± 112 s-1, see Figure 3D) in the presence of the non-physiological template C5, suggesting a decoupling of the motions of the CTD and the edge of the template entry portal and the fingertips. In addition to these perturbations in dynamics, significant differences in chemical shift perturbations (Figure 5A) induced by the genomic constructs (C1, C2) and C5, were seen. Notably, Ile641 displayed comparable shift changes for C1 (47 Hz) and C2 (42 Hz), while the changes for C5 were much more modest (13 Hz). A marginally smaller chemical shift change was also seen in Ile164 for C5 (13 Hz) compared with C1 (19 Hz) and C2 (18 Hz). This suggests that the proper genomic 3′-ends elicit specific and unique changes in structure and dynamics compared with the non-physiological (C5) template in spite of having a 44-fold (C1) and 247-fold (C2) less affinity for P2. No significant differences in the dynamic timescales or chemical shifts were noted for any of the residues that lie near the catalytic site - Ile449 (motif C), Ile488 (motif D) and Ile500 (motif E).
Figure 5.

(A) Scaled chemical shift changes shown for each of the three templates (reference – black, C1 – yellow, C2 – green and C5 – purple). (B) Scaled chemical shift changes for the substrate analogs (GMPCPP – yellow, AMPCPP – green). Scaled chemical shift changes, with respect to the reference, for (A) and (B) were calculated using Equation 1.
Influence of Substrate Purine Nucleotide Triphosphates
Next we tested the influence of the substrate NTPs on slow dynamics in P2 (in the absence of RNA). The purine nucleotides GTP and ATP, are required initially in φ6 given the pyrimidine-rich 3′-end of the genomic segments. Indeed, GTP is the preferred initiation nucleotide for φ6 and a host of other viral RNA polymerases that initiate RNA synthesis de novo, including those from bovine diarrhea virus (BVDV), HCV, broom mosaic virus (BMV) among others (26). This is especially important since the exact order of substrate and RNA binding to P2 is not precisely known and pre-binding of the initiation nucleotide (GTP) cannot be ruled out, as suggested by Choi et. al. (20). For the present studies, we utilized AMPCPP and GMPCPP, the α–β non-hydrolysable analogs of ATP and GTP respectively, to allow complex formation but not catalysis in the ternary complexes discussed below. The overall differences in chemical shift changes induced were quite modest (Figure 5B), though some of the largest changes were localized near the active site. Ile449 (motif C) and Ile500 (motif E) showed larger chemical shift changes for GMPCPP – 13 and 16 Hz respectively compared to AMPCPP – 5 and 10 Hz respectively, indicating larger conformational changes around the active site for the GTP-analog. In contrast, a much larger chemical shift change for Ile641 (CTD) was noted for AMPCPP (36 Hz) compared with GMPCPP (20 Hz).
Differences in dynamic timescales were more pronounced (summarized in Table 4). In the presence of GMPCPP, the motion of Ile500 on motif E changed from a faster timescale (Group I, see Table 1) in the reference state to a catalytic timescale (Group II) (Figure 3C). AMPCPP induced no such change. Additionally, for AMPCPP (as in the case of template C5 discussed above), the dynamics of Ile641 (CTD) seemed to shift towards a slower timescale (kex = 336 ± 84 s-1) (Figure 3D) around the Group II range rather than Group I type dynamics characteristic of this region (19) (Table 1). While the quality of data for this residue in the presence of GMPCPP did not allow us to extract a quantitative kex value, a kex value of 1344 ± 110 s-1 (19) was found for this residue in the presence of GMPPNP, indicative of Group I dynamics. Here too, as in C5 (above), the incorrect ligand leads to a decoupling of the motion of the template entry portal with the CTD.
Table 4. kex values of P2 in the presence of substrate NTPs.
Ternary Complexes
Finally, we analyzed two ternary complexes that should form stable initiation platforms based on proper complementarity between template 3′-end sequence and substrate NTPs. These were TCA: P2/GMPCPP/C1 (for which data is available from (19), Figure 6A) and TCB: P2/AMPCPP/C5 (Figure 6B). Significant differences in dynamics were noted between TCA representing the initiation platform formed during the transcription of the genomic s- and m- strands, and TCB that is non-physiological in the context of φ6. The most striking difference was the complete suppression of slow dynamics of Ile96 (fingertips, at the template entry portal) in TCA (Figure 3A, Table 5).
Figure 6.

(A) Ternary complex TCA forms between 5′-UUUCC-3′ (template C1), the non-hydrolysable GTP-analog GMPCPP and φ6 P2. The template bases T1 and T2 (numbered 3′ to 5′) base pair with the substrate bases D1 and D2 (numbered 5′ to 3′) forming a stable initiation complex (based on base-pairing considerations alone). The first phosphodiester bond forms between D1 and D2 creating the daughter chain and releasing pyrophosphate. In TCA, D2 (and D1) is the substrate GMPCPP that cannot be hydrolyzed between the α– and β–phosphates and the reaction cannot proceed, though the initiation complex forms. TCA is physiologically relevant since template 1 corresponds to the 3′-ends of the s- and m- genomic segments. (B) TCB the ternary complex between template C5 (5′-UUUUU-3′) and the non-hydrolysable ATP-analog AMPCPP, also allows proper base-pairing between T1:D1 and T2:D2, as in TCA above, but C5 does not correspond to 3′-ends of any of the φ6 genomic segments. (C) Scaled chemical shift changes (with respect to the reference state) shown for the ternary complexes (TCA – blue, TCB – pink).
Near the catalytic site, the motion of Ile500 in TCA (Figure 3C) seemed to be shifted slightly towards the catalytic timescale (kex= 972±186 s-1, Table 5) from a faster timescale. However, the most significant difference between the two complexes was the detection of slow motion on a catalytic timescale for Ile449 (kex =381 ± 95 s-1, Table 5, Figure 3B) that lies on motif C (bearing Asp453 and Asp454 from the conserved DD motif) in TCA but not in TCB. These differences in dynamics between the physiological (TCA) and non-physiological (TCB) complexes were also reflected in the chemical shifts. The chemical shift changes seen in TCA were also significantly larger than those seen in TCB (Figure 6C) with the largest differences being at the plough (Ile164 – TCA, 30 Hz; TCB, 17 HZ), near the catalytic site (Ile488 – TCA, 22 Hz; TCB, 10 Hz) and at the CTD (Ile641 – TCA, 58 Hz; TCB, 32 Hz). This suggests that TCA, the correct initiation complex was both structurally and dynamically distinct from the non-physiological TCB.
Conclusions
From the present analysis it appears that different RNA templates affect dynamics on the slow timescale in P2 in a fashion that is not correlated to their relative affinities in a straightforward way. ssRNA templates corresponding to the proper genomic 3′-ends have similar effects on structure and dynamics that are distinct from higher-affinity non-genomic RNA constructs. The effects of the substrates ATP (AMPCPP) and GTP (GMPCPP), the latter being the correct initiation nucleotide, on the dynamics are also distinct.
In the presence of AMPCPP or the non-physiological ssRNA (C5), the motion of Ile641 moves to a slower timescale, decoupling the motion of the CTD from that of the template portal likely disrupting the coordinated motion of the template into and the daughter chain out of the catalytic pore (4, 19). In the non-physiological ternary complex TCB, residues around the catalytic site also do not show dynamics on the catalytic timescale as in the proper initiation complex, TCA. Additionally in TCA, motions of the motif C bearing the conserved catalytic Asp residues (reported by Ile449) on the catalytic timescale get activated.
The case of the motif E residue Ile500 is most intriguing. In all of the complexes with template RNA in the absence of substrate, motion of this residue is fast, on the Group I timescale. However, in the presence of the correct initiation NTP (GTP), even in the absence of template, this motion switches to a catalytic timescale (Group II) that persists in physiological complex TCA. This residue is spatially proximal to Glu491 and Ala495 that are shown to coordinate a structural Mn+2 (4, 9, 10). Mutation of Glu491 results in a polymerase that has a lower thermal stability and crystallizes in two forms, one of which has a modified catalytic site geometry, suggesting significant conformational dynamics (9). This mutant is also compromised both in the formation of the initiation complex as well in chain elongation. This suggests its influence both on catalysis as well as RNA translocation i.e. on both Group I and II motions. It is therefore likely that motif E needs to sample both Group I and Group II type motions depending on the stage of the catalytic cycle. Thus it would be expected that Group II timescale motions would be activated in this region in the presence of the correct substrate and subsequently upon formation of the proper initiation complex and commencement of catalysis. This hypothesis is in line with our data. The Group II timescale motions of Ile164 were damped in the presence of both AMPCPP and GMPCPP and no motions were activated for this residue in either of the ternary complexes. The role of the plough region (reported by Ile164) in catalysis has been documented (11). From our present results it seems that bound substrate molecules have to be present to damp the motion of the plough but this damping does not depend on the precise nature of the substrate. Additionally, Group II motions involving Ile258 (except for C5) and Ile563 were completely suppressed in the presence of all ligands we studied. The role of the motions reported by these residues, Ile258 that lies extreme end of the fingers, and Ile563 that lies at the base of the thumb, are not immediately clear. Further studies are required to ascertain the role of these regions, if any, on catalysis.
The results of the present study combined with those of our previous one (19) reflects a network of fast (Group I) and slow (Group II) dynamic modes, broadly classified, on the μs-ms timescale involving several regions of the protein. We also find that recognition of the correct genomic 3′-ends, the proper initiation NTP substrate GTP, to form the correct initiation complex activates distinct changes in structure and dynamics in φ6 P2 to initiate RNA synthesis. On the other hand, non-optimal NTP substrates or non-physiological templates in spite of having a higher affinity towards P2 fail to elucidate these changes.
As stated earlier (19), it is highly plausible that Group I and Group II motions could have an additional hierarchy of timescales within them as implied by the broad timescale range in our simple classification. Multi-step processes, with multiple rates, have been used in the analysis of the catalytic process for the homologous 3Dpol (as described before)(12). The presence of this hierarchy becomes clear in attempting to perform global fits on the residues within the Group I and II classification. For example, for the reference state, residues Ile37, Ile96 and Ile500, all classified as Group I (Tables 3,4) can be fit in a statistically significant way to a common kex value of ∼1400 s-1. Also for the reference state, Ile164, Ile258 and Ile563, all classified as Group II (Tables 3,4) can also be fit to a common kex value of ∼350 s-1. However, inclusion of Ile488 also classified as Group II in this global fit leads to a common kex of ∼450 s-1 with a substantial increase in the residual variance and the global fit can no longer be considered to be statistically significant. This hints towards common origin for motions involving Ile164, Ile258 and Ile563 and a distinct one for Ile488, within the Group II timescale. However, a detailed interpretation of this hierarchy is not possible at the level of precision, both theoretical and experimental, of the present experiments. Global fitting also provides some insight into the timescale switching as shown by the residue Ile500, for example. This residue that could be fitted using the Group I timescale together with Ile37 and Ile96 (as described above) using a common kex value of 1400 s-1 for the reference state, can be fit with a common kex value of 750 s-1 with Ile488 in the GMPCPP-bound state (Table 4). Additional experiments at multiple fields coupled with single quantum dispersion measurements2 should allow the determination of the underlying sub-structure of the motional modes broadly classified as Group I and Group II timescales. Further, a definitive picture of the influence of motion in residue-by-residue detail also awaits the availability of complete or near complete assignment of backbone resonances. However, for a system as large as P2 coupled with the difficulty in solubilizing it at the high concentrations required for standard triple-resonance experiments used for backbone-directed assignment strategies, makes this is an extremely slow and tedious process. The almost uniform distribution of the 25 Ile residues over the structural domains and most of the conserved polymerase sequence motifs, together with the ease in labeling of the Ile-δ1 position (27) and the excellent spectral dispersion afforded by the corresponding resonances (see Figure 4), make these residues excellent probes to analyze large scale dynamics and obtain insight into the finely-tuned molecular machine that is P2 while awaiting backbone resonance assignments. As recently suggested by Cameron (14), it is becoming more and more obvious that dynamics certainly seems to be the missing link between structure and function in polymerase based on our present and earlier (19) results, and those from the elegant study on 3Dpol (17). Measurement and interpretation of NMR relaxation is likely to play a pivotal role in fully elucidating this connection. However, it should be remembered that mere overlap of dynamic timescales measured by NMR with catalytic timescales does not necessarily prove causality. These studies have to be coupled with rational mutations that affect the dynamics as measured by NMR and also have an influence on catalytic rates and timescales measured from kinetic analyses to definitively establish their correlation.
Acknowledgments
We thank Drs. Lewis Kay and Dimitri Korzhnev (University of Toronto) for the pulse sequences to measure multiple quantum relaxation rates, Dr. Hsin Wang (The City College of New York) for help with NMR spectroscopy, Dr. Aneel Aggarwal (Mt. Sinai School of Medicine) for use of the Beacon spectrofluorometer. We are grateful to Dr. Leonard Mindich (PHRI), Dr. Andrea Piserchio (The City College of New York) and Dr. Kaushik Dutta (New York Structural Biology Center) for useful comments and suggestions.
Abbreviations
- AMPCPP
adenosine-5′-[(α,β)-methyleno]triphosphate
- CPMG
Carr-Purcell-Meiboom-Gill
- CTD
C-terminal domain
- dsRNA
double-stranded RNA
- GMPCPP
guanosine-5′-[(α,β)-methyleno]triphosphate
- HMQC
heteronuclear multiple quantum correlation
- MQ
multiple-quantum
- PX
polymerase complex
- SQ
single-quantum
- ssRNA
single-stranded RNA
- RF
radio frequency
- RdRP
RNA-directed RNA polymerase
Footnotes
This work is supported by the following grants: NSF MCB0843141; NIH 5G12 RR03060 (partial support of the NMR facilities at CCNY).
Note that unlike relaxation dispersion for single-quantum (SQ) coherences (R2 dispersion), an exact analysis yielding interpretable ΔωH and ΔωC in addition to kex values, cannot, in general, be obtained for MQ dispersion even if data at multiple fields are available (except perhaps if the data are highly precise, an unlikely situation in the case of a protein like P2) given the extremely complex nature (21) of MQ dispersion curves (compare the simplified Equation 4 that is valid only for fast exchange and when the product ΔωCΔωH is small). In order to perform the complete analysis, MQ dispersion measurements need to be combined with SQ data (21).
References
- 1.Poranen MM, Tuma R. Self-assembly of double-stranded RNA bacteriophages. Virus Res. 2004;101:93–100. doi: 10.1016/j.virusres.2003.12.009. [DOI] [PubMed] [Google Scholar]
- 2.Ferrer-Orta C, Arias A, Escarmis C, Verdaguer N. A comparison of viral RNA-dependent RNA polymerases. Curr Opin Struct Biol. 2006;16:27–34. doi: 10.1016/j.sbi.2005.12.002. [DOI] [PubMed] [Google Scholar]
- 3.Bruenn JA. A structural and primary sequence comparison of the viral RNA-dependent RNA polymerases. Nucleic Acids Res. 2003;31:1821–1829. doi: 10.1093/nar/gkg277. [DOI] [PMC free article] [PubMed] [Google Scholar]
- 4.Butcher SJ, Grimes JM, Makeyev EV, Bamford DH, Stuart DI. A mechanism for initiating RNA-dependent RNA polymerization. Nature. 2001;410:235–240. doi: 10.1038/35065653. [DOI] [PubMed] [Google Scholar]
- 5.Makeyev EV, Bamford DH. Replicase activity of purified recombinant protein P2 of double-stranded RNA bacteriophage phi6. EMBO J. 2000;19:124–133. doi: 10.1093/emboj/19.1.124. [DOI] [PMC free article] [PubMed] [Google Scholar]
- 6.Makeyev EV, Bamford DH. The polymerase subunit of a dsRNA virus plays a central role in the regulation of viral RNA metabolism. EMBO J. 2000;19:6275–6284. doi: 10.1093/emboj/19.22.6275. [DOI] [PMC free article] [PubMed] [Google Scholar]
- 7.Makeyev EV, Grimes JM. RNA-dependent RNA polymerases of dsRNA bacteriophages. Virus Res. 2004;101:45–55. doi: 10.1016/j.virusres.2003.12.005. [DOI] [PubMed] [Google Scholar]
- 8.Yang H, Makeyev EV, Bamford DH. Comparison of polymerase subunits from double-stranded RNA bacteriophages. J Virol. 2001;75:11088–11095. doi: 10.1128/JVI.75.22.11088-11095.2001. [DOI] [PMC free article] [PubMed] [Google Scholar]
- 9.Poranen MM, Salgado PS, Koivunen MR, Wright S, Bamford DH, Stuart DI, Grimes JM. Structural explanation for the role of Mn2+ in the activity of φ6 RNA-dependent RNA polymerase. Nucleic Acids Res. 2008;36:6633–6644. doi: 10.1093/nar/gkn632. [DOI] [PMC free article] [PubMed] [Google Scholar]
- 10.Salgado PS, Makeyev EV, Butcher SJ, Bamford DH, Stuart DI, Grimes JM. The structural basis for RNA specificity and Ca2+ inhibition of an RNA-dependent RNA polymerase. Structure. 2004;12:307–316. doi: 10.1016/j.str.2004.01.012. [DOI] [PubMed] [Google Scholar]
- 11.Sarin LP, Poranen MM, Lehti NM, Ravantti JJ, Koivunen MR, Aalto AP, van Dijk AA, Stuart DI, Grimes JM, Bamford DH. Insights into the pre-initiation events of bacteriophage φ6 RNA-dependent RNA polymerase: towards the assembly of a productive binary complex. Nucleic Acids Res. 2009;37:1182–1192. doi: 10.1093/nar/gkn1035. [DOI] [PMC free article] [PubMed] [Google Scholar]
- 12.Arnold JJ, Cameron CE. Poliovirus RNA-dependent RNA polymerase (3Dpol): pre-steady-state kinetic analysis of ribonucleotide incorporation in the presence of Mg2+ Biochemistry. 2004;43:5126–5137. doi: 10.1021/bi035212y. [DOI] [PMC free article] [PubMed] [Google Scholar]
- 13.Castro C, Smidansky ED, Arnold JJ, Maksimchuk KR, Moustafa I, Uchida A, Gotte M, Konigsberg W, Cameron CE. Nucleic acid polymerases use a general acid for nucleotidyl transfer. Nature Struct Mol Biol. 2009;16:212–218. doi: 10.1038/nsmb.1540. [DOI] [PMC free article] [PubMed] [Google Scholar]
- 14.Cameron CE, Moustafa IM, Arnold JJ. Dynamics: the missing link between structure and function of the viral RNA-dependent RNA polymerase? Current Opin Struct Biol. 2009;19:768–774. doi: 10.1016/j.sbi.2009.10.012. [DOI] [PMC free article] [PubMed] [Google Scholar]
- 15.Patel SS, Wong I, Johnson KA. Pre-steady-state kinetic analysis of processive DNA replication including complete characterization of an exonuclease-deficient mutant. Biochemistry. 1991;30:511–525. doi: 10.1021/bi00216a029. [DOI] [PubMed] [Google Scholar]
- 16.Arnold JJ, Vignuzzi M, Stone JK, Andino R, Cameron CE. Remote site control of an active site fidelity checkpoint in a viral RNA-dependent RNA polymerase. J Biol Chem. 2005;280:25706–25716. doi: 10.1074/jbc.M503444200. [DOI] [PMC free article] [PubMed] [Google Scholar]
- 17.Yang X, Welch JL, Arnold JJ, Boehr DD. Long-range interaction networks in the function and fidelity of poliovirus RNA-dependent RNA polymerase studied by nuclear magnetic resonance. Biochemistry. 2010;49:9361–9371. doi: 10.1021/bi100833r. [DOI] [PMC free article] [PubMed] [Google Scholar]
- 18.Di Marco S, Volpari C, Tomei L, Altamura S, Harper S, Narjes F, Koch U, Rowley M, De Francesco R, Migliaccio G, Carfi A. Interdomain communication in hepatitis C virus polymerase abolished by small molecule inhibitors bound to a novel allosteric site. J Biol Chem. 2005;280:29765–29770. doi: 10.1074/jbc.M505423200. [DOI] [PubMed] [Google Scholar]
- 19.Ren Z, Wang H, Ghose R. Dynamics on multiple timescales in the RNA-directed RNA polymerase from the cystovirus φ6. Nucleic Acids Res. 2010;38:5105–5118. doi: 10.1093/nar/gkq210. [DOI] [PMC free article] [PubMed] [Google Scholar]
- 20.Choi KH, Groarke JM, Young DC, Kuhn RJ, Smith JL, Pevear DC, Rossmann MG. The structure of the RNA-dependent RNA polymerase from bovine viral diarrhea virus establishes the role of GTP in de novo initiation. Proc Natl Acad Sci USA. 2004;101:4425–4430. doi: 10.1073/pnas.0400660101. [DOI] [PMC free article] [PubMed] [Google Scholar]
- 21.Korzhnev DM, Kloiber K, Kanelis V, Tugarinov V, Kay LE. Probing slow dynamics in high molecular weight proteins by methyl-TROSY NMR spectroscopy: application to a 723-residue enzyme. J Am Chem Soc. 2004;126:3964–3973. doi: 10.1021/ja039587i. [DOI] [PubMed] [Google Scholar]
- 22.Mindich L, Qiao X, Onodera S, Gottlieb P, Frilander M. RNA structural requirements for stability and minus-strand synthesis in the dsRNA bacteriophage φ6. Virology. 1994;202:258–263. doi: 10.1006/viro.1994.1341. [DOI] [PubMed] [Google Scholar]
- 23.Boggs PT, Donaldson JR, Byrd RH, Schnabel RB. ODRPACK software for weighted orthogonal distance regression. ACM Trans Math Software. 1989;15:348–364. [Google Scholar]
- 24.Delaglio F, Grzesiek S, Vuister GW, Zhu G, Pfeifer J, Bax A. NMRPipe: a multidimensional spectral processing system based on UNIX pipes. J Biomol NMR. 1995;6:277–293. doi: 10.1007/BF00197809. [DOI] [PubMed] [Google Scholar]
- 25.Dittmer J, Bodenhausen G. Evidence for slow motion in proteins by multiple refocusing of heteronuclear nitrogen/proton multiple quantum coherences in NMR. J Am Chem Soc. 2004;126:1314–1315. doi: 10.1021/ja0386243. [DOI] [PubMed] [Google Scholar]
- 26.van Dijk AA, Makeyev EV, Bamford DH. Initiation of viral RNA-dependent RNA polymerization. J Gen Virol. 2004;85:1077–1093. doi: 10.1099/vir.0.19731-0. [DOI] [PubMed] [Google Scholar]
- 27.Tugarinov V, Kay LE. Methyl groups as probes of structure and dynamics in NMR studies of high-molecular-weight proteins. Chem Bio Chem. 2005;6:1567–1577. doi: 10.1002/cbic.200500110. [DOI] [PubMed] [Google Scholar]