

Abstract
Copy-number variants (CNVs) can reach appreciable frequencies in the human population, and recent discoveries have shown that several of these copy-number polymorphisms (CNPs) are associated with human diseases, including lupus, psoriasis, Crohn disease, and obesity. Despite new advances, significant biases remain in terms of CNP discovery and genotyping. We developed a method based on single-channel intensity data and benchmarked against copy numbers determined from sequencing read depth to successfully obtain CNP genotypes for 1495 CNPs from 487 human DNA samples of diverse ethnic backgrounds. This microarray contained CNPs in segmental duplication-rich regions and insertions of sequences not represented in the reference genome assembly or on standard SNP microarray platforms. We observe that CNPs in segmental duplications are more likely to be population differentiated than CNPs in unique regions (p = 0.015) and that biallelic CNPs show greater stratification when compared to frequency-matched SNPs (p = 0.0026). Although biallelic CNPs show a strong correlation of copy number with flanking SNP genotypes, the majority of multicopy CNPs do not (40% with r > 0.8). We selected a subset of CNPs for further characterization in 1876 additional samples from 62 populations; this revealed striking population-differentiated structural variants in genes of clinical significance such as OCLN, a tight junction protein involved in hepatitis C viral entry. Our microarray design allows these variants to be rapidly tested for disease association and our results suggest that CNPs (especially those that cannot be imputed from SNP genotypes) might have contributed disproportionately to human diversity and selection.
Introduction
Copy-number variants (CNVs) were originally defined as deletions or duplications greater than 1 kb in size.1–7 CNVs present at higher frequencies (>1%) in populations are distinguished as copy-number polymorphisms (CNPs). Both CNVs and CNPs are enriched in regions of the genome with highly identical copies of paralogous sequence known as segmental duplications (SDs).8,9 Because of this complex genomic architecture, genotyping many CNPs in a large number of individuals has proven challenging. High-density SNP arrays have been employed for copy-number measurement.6,7 However, these platforms traditionally suffered from a scarcity of probes in segmental duplication regions of the genome and were unable to assay many known CNPs.7,10,11 Approximately half of simple deletion variants are not well captured by even the highest-density SNP microarrays, and this number increases when more complex variants and variants within segmental duplication-rich regions are considered.7 Recent advances using sequencing read depth information to estimate copy number have revealed that CNPs in segmental duplications are highly variable in humans,12,13 although the number of individuals and populations explored is limited. Copy numbers determined from sequence data have aided the interpretation of microarray studies.14 Additionally, most SNP microarray and array comparative genomic hybridization (CGH) platforms are designed relative to the human genome reference sequence; however, recent work using end sequence mapping of fosmid clone libraries from multiple individuals15 as well as de novo sequence assembly from additional genomes16,17 has led to the identification of insertions of sequence not present in the reference genome assembly. In fact, many of these insertions are polymorphic in human populations and, thus, represent genetic variants that have not been captured in disease or population-genetic studies.17,18
Much effort has been focused on using microarray hybridization data (SNP arrays or array CGH) to determine copy-number genotypes. However, a large number of discovered CNPs do not form discrete copy-number classes in microarray data and these variants have not been thoroughly studied.6,19 For example, in a recent survey of CNPs, Conrad et al.19 obtained discrete diploid copy numbers for 4978 CNPs out of 10,819 discovered variants (46%), but only 3432 CNPs could be genotyped in a large case-control study.20 Of these genotypable CNPs, 14.4% map to segmental duplications in contrast to the 23.4% of the discovered CNPs that map to SDs. These data suggest that CNP-focused analyses in which the distribution of hybridization values reveals clearly separable or discrete integer copy numbers in microarray data will be biased against CNPs in segmental duplications.
Similarly, previous analyses have tested for linkage disequilibrium (LD) between CNPs and SNPs and found that the majority of simple deletion and duplication polymorphisms are in LD with SNPs, and there is slightly less LD observed for duplications.6,11,19 Recent analysis has suggested that the lower LD observed for duplications may be due to transposed duplications far from the SNPs being tested for LD.21 Most of these analyses, however, have focused on CNPs in unique regions of the genome, and our understanding of the LD between SNPs and CNPs in duplications is still very limited.
CNPs that differ greatly in average copy number between human populations are candidate variants for population-specific natural selection. CNPs (especially those variants in duplication-rich regions of the genome) may be more likely to be recurrent22–24 and may provide new insight into recent human demographic history. Potentially interesting differentiated CNPs include a deletion that removes APOBEC3B (MIM 607110), which is involved in innate immunity and is more prevalent in East Asian, Amerindians, and Oceanic populations,25 and the deletion of UGT2B17 (MIM 601903), which has been associated with osteoporosis (MIM 166710) and is more common in East Asian individuals.5,26 Screens of CNPs have identified other differentiated CNPs with a pattern of differentiation that appears comparable to what is observed with SNPs.6,19,27 Again, these analyses have primarily focused on CNPs in the unique portions of the human genome.
We set out to conduct a thorough analysis of CNPs in individuals from multiple populations. We have not limited our analysis to CNPs with discrete copy-number genotypes or those defined in the human genome reference sequence but rather included CNPs from numerous studies both within duplicated regions and sequences not present in the human reference genome. Inclusion of these targeted loci makes our custom microarray complementary to existing CNP and SNP microarrays. Our analysis identified CNPs with large differences in frequency between populations. We observed that biallelic CNPs show slightly more population differentiation than randomly selected SNPs, and we found that duplication-rich CNPs (i.e., CNPs that overlap SDs) tend to show more population differentiation than CNPs in unique regions of the genome. We also observed that the CNPs in duplications are not in LD with SNPs and cannot, as of yet, be captured without direct genotyping. The microarray and data analysis methods we developed will facilitate future disease associations for these loci.
Methods
A summary of all the methods discussed is included as Table S1.
Samples
Individuals assessed for CNPs in the initial screen are part of the International HapMap Project. We selected samples from five populations and chose to enrich for African individuals from two populations because of higher genetic diversity in Africa. The samples studied are cohorts of Northwestern European Americans from the Centre d'Etude du Polymorphisme Humain collection (CEU), Yoruba from Ibadan, Nigeria (YRI), Han Chinese from Beijing (CHB), Japanese from Tokyo (JPT), and Maasai from Kinyawa, Kenya (MKK) (Table 1). We performed a follow-up study in additional individuals who are part of the HapMap and 1000 Genomes Projects. These samples are additional individuals from the Han Chinese from Beijing (CHB), Japanese (JPT), and Maasai (MKK) populations and samples from the Luhya from Webuye, Kenya (LWK), Toscani from Italy (TSI), Mexican American from Los Angeles (MEX), African American from the southwest United States (ASW), British from Great Britain and Scotland (GBR), Finnish (FIN), and Han Chinese from southern China (CHS) (Table 1). DNA, derived from lymphoblast cell lines, was obtained from Coriell Cell Repositories. NA12878, a CEU female, was used as the reference sample for all microarray experiments.
Table 1.
Samples Assessed for CNPs
| Population |
Population-Genetic Analysis |
Follow-Up of Differentiated CNPs |
Total |
|||
|---|---|---|---|---|---|---|
| Total | Unrelated | Total | Unrelated | Total | Unrelateda | |
| European American (CEU) | 159 | 109 | - | - | 159 | 109 |
| Yoruba (YRI) | 164 | 109 | 3 | 3 | 167 | 112 |
| Han Chinese from Beijing (CHB) | 40 | 40 | 56 | 56 | 96 | 96 |
| Japanese (JPT) | 41 | 41 | 55 | 55 | 96 | 96 |
| Maasai (MKK) | 83 | 54 | 90 | 90 | 173 | 144 |
| Luhya (LWK) | - | - | 96 | 96 | 96 | 96 |
| Han Chinese from Southern China (CHS) | - | - | 148 | 98 | 148 | 98 |
| Toscani (TSI) | - | - | 95 | 95 | 95 | 95 |
| British (GBR) | - | - | 86 | 86 | 86 | 86 |
| Finnish (FIN) | - | - | 99 | 99 | 99 | 99 |
| African American (ASW) | - | - | 98 | 63 | 98 | 63 |
| Mexican American (MEX) | - | - | 98 | 68 | 98 | 68 |
| Total | 487 | 353 | 924 | 809 | 1411 | 1162 |
Population-genetic analyses were performed in the unrelated samples only.
A subset of CNPs was genotyped in the HGDP samples, a collection of 1050 samples from 52 worldwide populations.28 We excluded duplicates and close relatives.29
Microarray Design
We designed a custom 180,000-probe microarray by using the Agilent 4X180K SurePrint G3 Human CGH Microarray Platform. We targeted 4041 known CNPs (Figure 1; Table S2). All probes target sequences ranging from 45–60 base pairs and linker sequences were added to obtain probes of 60 base pairs. In order to design probes in segmental duplications, we removed the homology filter to obtain probes that map to multiple locations in the genome. For the 2772 CNPs represented in the human reference assembly, we designed probes to the hg18 human genome build by using eArray (Agilent). Because CNPs are enriched in regions of segmental duplication, the loci targeted on our microarray are enriched for segmental duplication content compared to the genome as a whole. We also targeted 1269 insertions (Table S3) of sequence not in the reference genome assembly.15,30 Probes for these novel insertions are from previous microarray designs used to study these variants.18 An additional 6899 probes were designed to copy-number invariable regions of the genome (Table S4). Finally, 3000 standard Agilent normalization probes located throughout the genome and five replicates of 1000 probes were included. Of the targeted CNPs, 96% had at least three probes, the median number of probes per CNP was 14, and the mean number of probes per CNP was 33.
Figure 1.

Targeted Copy-Number Polymorphisms
A pie chart of the sources for the 4041 targeted CNPs.
Microarray Hybridization
DNA samples were labeled with either Cy3 fluorescent dye (test samples) or Cy5 fluorescent dye (reference sample) as previously described.31 Equal amounts (5 μg) of test and reference labeled DNA were combined and hybridized to the microarray following Agilent recommended protocol. Microarrays were hybridized for 24 hr, washed, and scanned with standard Agilent procedures. Microarray data were extracted from the image files by means of Agilent FE software with a modification of the CGH-105_Dec08 protocol. The microarray data were normalized to the 3000 Agilent normalization probes located throughout the autosomes. All raw microarray data have been deposited in the National Center for Biotechnology Information's Gene Expression Omnibus32 and are accessible through accession number GSE26450.
Samples were processed in two groups for individuals used in the initial analyses and in three groups for follow-up populations. To minimize batch effects, we randomized samples across the populations within each of these groups. In addition, each group contained populations of different continental origin so that population-differentiated CNPs due to batch effects could be identified.
Sample Quality Control
To determine whether the microarray data generated were of sufficiently high quality for analysis, we used the following quality-control (QC) procedure. First, we examined the standard QC metrics determined for each microarray by the Agilent FE software and required that these metrics matched Agilent's recommendations. Next, for further QC, we calculated the standard deviation of log2 ratios of about 7000 probes designed within copy-number invariable regions of the autosomes. We did not consider any microarray data where this standard deviation was greater than 0.38. We selected this value empirically by comparing the data quality of hybridizations with different standard deviations. Finally, we used probes on the X and Y chromosomes to confirm that the sex of the DNA sample hybridized to the microarray was concordant with the reported sex of the individual. For samples that failed any of these QC steps, we repeated the steps up to two additional times to obtain data on as many samples as possible. Fifty-three of the initial 540 samples and 24 of 948 follow-up samples failed to pass these QC requirements and were not considered in the final analysis.
Copy-Number Determination
In order to determine copy number from the microarray hybridization data, we made use of previously described methods30,33 with some modifications. First, for each sample we determined whether there was evidence for copy-number variation with respect to the reference sample within each targeted interval and estimated its breakpoints by applying the ADM2 segmentation algorithm16 with a threshold of 5. We then visually inspected all samples across each targeted interval and manually refined the boundaries of each copy-number variant region (CNVR) in and around the targeted interval. In some cases, the CNVRs were smaller than the corresponding targeted loci, and, in some cases, multiple distinct CNVRs were identified within a single targeted locus (n = 217). We identified 2822 CNVRs in the targeted loci within the reference genome assembly, and we treated the 1269 novel insertions as CNVRs (without alteration), yielding a total of 4091 CNVRs (Figure S1). No variation was observed within 309 of the targeted loci, and these CNVRs were considered to be nonpolymorphic for this sample set.
All analyses were performed on the resulting 4091 CNVRs, which map to 3732 of the targeted loci (Figure S1). In some cases, probes within individual CNVRs exhibited more than one pattern of copy-number variation within different subregions. Consequently, we clustered probes by using the Cluster Affinity Search Technique algorithm,34 where the similarity is computed by using the Pearson correlation of the log2 ratios across all samples. The largest probe cluster that has an average similarity greater than 0.3 and that contains at least 30% of the probes in the region is used to represent this region in the subsequent analysis. For intervals for which there is no such cluster, all probes in the region were used. For each sample, the median log2 ratio and median red and median green signal intensities were computed across the representative probes in the region. Next, these median values were clustered across samples into discrete copy-number classes when possible.30,33 Copy numbers were assigned to each set of sample classes for each interval by simultaneously fitting integer copy-number values to the test sample classes and the reference sample by using the median signals, log ratios, and the estimate of the single-copy signal intensity (Figure S2). For this array design, we estimated the single-channel intensity that corresponds to a single-copy state to be 500 by using the mode of the signal distribution of autosomal probes within nonsegmentally duplicated invariant genomic regions30 (Figure S3). We have implemented a heuristic that uses additional criteria for determining integer copy numbers to increase the accuracy of this method. For example, when the reference sample has a copy number of zero, as evidenced by a reference channel intensity of less than 25% of the single-copy estimate or by low signal and the absence of clustering when both the log2 ratios and signals are used together, then copy-number fitting is attempted with only the clustered single-channel intensity data for the test samples.
For the remaining CNVRs, we developed the following approach to estimate copy number. To estimate the copy number of the reference sample, we used the ratio of the median of the single-channel intensity of all the samples, where each sample value is the median reference channel intensity of the probes in the CNVR, to the single-copy intensity value described above. Then, we used this estimated copy number and the log ratio data to estimate noninteger copy numbers for the test samples. We observed that the signal-to-noise ratio (represented as the ratio of mean signal to the standard deviation of the reference channel) shows a slight negative correlation (r = −0.089) to the copy number of the reference sample except when the reference sample has zero copies, in which case the signal-to-noise ratio tends to be lower. For this reason, we fit copy numbers by using the sample channel signal only for variants where the reference sample had zero copies. All CNPs and copy-number genotypes have been deposited into the National Center for Biotechnology Information's dbVar under study accession number nstd46.
Comparison of Microarray Copy-Number Estimates to Whole-Genome Sequencing Data
To evaluate this method, we compared the copy numbers determined by array CGH to the copy numbers estimated from sequencing read depth data, which one can use to accurately estimate copy number.12,13 One hundred and thirty-three individuals from our study overlapped with fully sequenced individuals recently analyzed for copy number.13 We performed read-depth-based genotyping of our selected loci in each of these individuals (as described13) and compared the sequencing-based copy-number estimations to those made by the array. We restricted our comparison to regions >1 kb in length because of the low coverage of many of the sequenced individuals.
We also compared the microarray-based copy-number estimates to those made by sequencing13 for CNPs that did not have discrete copy-number classes. We identified intervals exhibiting a high degree of correlation with the sequence estimates and others that were not correlated. Upon closer examination of these classes of intervals, we determined that the major contributing factor appeared to be the variance of the reference sample single-channel intensities. Specifically, for the well-correlated variants, we observed a small variance of the single-channel intensity values for the reference sample (i.e., high reproducibility of across arrays) and a large variance of signal intensities across the test samples. To quantify this, we compared the ratio of the coefficient of variation (CV) of the test sample single-channel intensity values across all arrays to the CV of the reference single-channel intensity values across all arrays. Based on comparisons to copy numbers determined from sequencing read depth, we have set 1.4 as the minimum ratio of CVs (rCV) for polymorphic, well-performing variants (Figure S5).
PCR and Quantitative PCR Assays
We selected several population-differentiated loci to genotype in additional samples in the Human Genome Diversity Project (HGDP) collection. For three novel sequence insertions, we designed PCR primers to produce different sized products for the deletion and insertion alleles (Table S6). For a CNP overlapping OCLN, we additionally designed a quantitative PCR assay to assess the copy number of this variant (Table S6). These assays were run on the HGDP individuals.
Linkage Disequilibrium Analysis
First, we analyzed biallelic, autosomal CNPs in which we could assign allelic genotypes. There were 759 such CNPs in the reference genome assembly and 181 novel sequence insertions. Of these 181 novel insertions, the approximate genomic location is unknown for seven variants,30 so we limited the analysis to the 174 novel insertions where we had an approximate genomic location. We downloaded all Phase III HapMap SNP genotypes (release #27) within 1 Mb of each CNP for all five populations (European American [CEU], Han Chinese from Beijing [CHB], Japanese [JPT], Maasai [MKK], and Yoruba [YRI]). We used Haploview35 to calculate r2 between each CNP and nearby SNPs. From these data, we determined the most correlated SNP for each population and the highest r2 value across all five populations for both CNPs in the reference genome and novel sequence insertions.
To examine the relationship of multiallelic CNPs to SNPs, we looked at the correlation between diploid copy number and SNP genotype for nearby SNPs. We looked at SNPs within 1 Mb for reference genome CNPs and SNPs within 5 Mb for novel insertions. We used Pearson correlation to test the relationship of copy number to SNP genotype. We determine the maximum correlation coefficient for each CNP in each population and for all populations overall. To determine which variables contributed to the correlation of SNP genotype to copy number, we performed a multiple regression analysis. The correlation coefficient between copy number and SNP genotype was treated as the dependent variable. We used duplication status, multiallelic status, distance to most correlated SNP, and the minor allele frequency of the most correlated SNP as independent variables and performed multiple stepwise regression analysis by using the step function in R.
To test whether multiallelic CNPs could be captured by SNP haplotypes, we examined the correlation between diploid copy number and SNP haplotypes. We selected five multiallelic CNPs with high correlation to SNP genotypes and five multiallelic CNPs with low correlation to SNP genotypes. In the population where the largest association to SNP genotypes was observed, we visually determined the region of highest LD between SNPs around the CNP (i.e., LD block) and phased these SNPs using BEAGLE.36 We performed a Pearson test for all haplotype clusters to determine their correlation with diploid copy numbers and noted the highest correlation coefficient.
Population Differentiation Analysis
We calculated VST as previously described27 by using the following equation: (VT − VS)/VT, where VT is the total variance in log2 ratios across all unrelated individuals and VS is the average variance in unrelated individuals within each population. We calculated VST for each pair of populations and considered the maximum VST value for comparisons of CNPs. We used the maximum pairwise VST values in order to have the sensitivity to identify variants where only one population shows a difference in copy number. However, we also observed that CNPs in duplications have higher mean pairwise VST values and higher global VST values than CNPs in unique regions (Kolmogorov-Smirnov two-tailed test, p = 0.009 for mean VST; Kolmogorov-Smirnov two-tailed test, p = 0.05 for global VST). For biallelic CNPs and frequency-matched SNPs, we calculated FST by using an unbiased estimator37,38 for each pair of populations, and we considered the maximum FST for each variant in our comparisons. SNP genotype data was obtained from HapMap Phase III release #27. From these data, we selected random SNPs to match the allele frequency distribution that we observed with our biallelic CNPs.
Results
Targeted Genotyping of Copy-Number Polymorphisms
We designed a custom oligonucleotide microarray targeting regions of known CNPs.6–8,15,30,39–43 After merging overlapping loci, we obtained 4041 nonredundant targeted CNPs from the following sources (Figure 1; Table S2). 2273 CNPs were discovered with clone end-sequencing and mapping approaches;15,44 this included 1269 insertions not present in the human genome reference assembly,18 which cannot be assessed by any current commercial platform dependent solely on the reference genome assembly (Table S3). Other targeted sites included 1170 CNPs defined at high resolution with SNP microarrays,6,7 151 CNVs in genes described as copy-number variable,39 77 CNPs discovered from whole-genome sequencing data,40,42,43 and 365 sites identified in multiple studies. We designed a custom Agilent 4X180K microarray successfully targeting 96% of these CNPs with at least three probes.
For initial population-genetic analyses, we hybridized 540 HapMap individuals to our CNP microarray. Of these, 487 passed our quality control filters and were included in further analyses (Table 1; Methods). These individuals represent five of the populations being studied as part of the HapMap project:45 European Americans (CEU), Han Chinese from Beijing (CHB), Japanese (JPT), Yoruba (YRI), and Maasai (MKK). In addition, a subset of these samples have been sequenced (n = 133) or will be sequenced (n = 263) as part of the 1000 Genomes Project.46 We found 4091 putative CNPs in 3732 of our targeted loci (Figure S1). We were able to determine discrete copy-number genotypes for 1183 of these CNPs (Tables S7 and S8).
For the remaining CNPs that did not form clear, discrete copy-number classes, we developed a method to estimate copy number for a subset with the single-channel microarray hybridization values. We took advantage of the fact that the reference sample in microarray CGH has been hybridized hundreds of times and used this to further investigate CNPs for which the distribution of single-channel intensity values of the reference sample were highly reproducible (i.e., tightly distributed around the mean). Using single-channel intensity values derived from unique regions of the genome, we initially set the copy number of the reference sample to be consistent with this value. We then extrapolated the copy number of the test sample based on the observed log ratio and reference sample copy number (see Methods for detailed description).
To test the accuracy of our method, we compared our microarray copy-number estimates for 133 individuals in our study to copy numbers estimated from an orthologous method, sequencing read depth13. For loci with discrete copy-number classes, 84% of the tested regions have greater than 90% concordance of copy numbers across the 133 samples. For 88% of the regions with low concordance, we observed that the copy numbers determined from the two methods differ by an integer value for most of the samples. After taking this difference into account, we observed an overall copy-number concordance of 96% and average concordance of 98% for the 90% of variants with high concordance (Figure S4; Table S5). Although this represents an improvement, especially for CNPs previously not tested, higher accuracy might be achieved by genome sequencing.12,13
For the CNPs that did not form a discrete copy number, we found that variants with good correlation to sequencing copy-number estimates had specific properties in the microarray data. In particular, we found that CNPs where the reference sample intensity values are highly reproducible across hybridizations are more likely to show correlation with read depth copy-number estimates (see Figure 2 for an example). Therefore, we evaluated the ratio of the coefficient of variation (CV) for test sample signal intensity across all microarrays to the CV of the reference sample signal intensity across all microarrays. CNPs where we could accurately estimate copy number had more variability in the test sample signal (copy-number differences in 487 individuals) and little variability for the reference sample signal (reproducibility of the sample individual hybridized 487 times). We used a threshold of 1.4 for the ratio of CVs and found that 312 CNPs without discrete copy-number classes have a value that passed this threshold; thus copy number could be accurately estimated from single-channel hybridization data. Regions with rCV values less than 1.4 may not be polymorphic enough to observe significant correlation with sequencing data. We were able to accurately estimate copy number for a total 1495 CNPs (1183 in the reference assembly and 312 novel insertions) (Tables S7 and S8).
Figure 2.
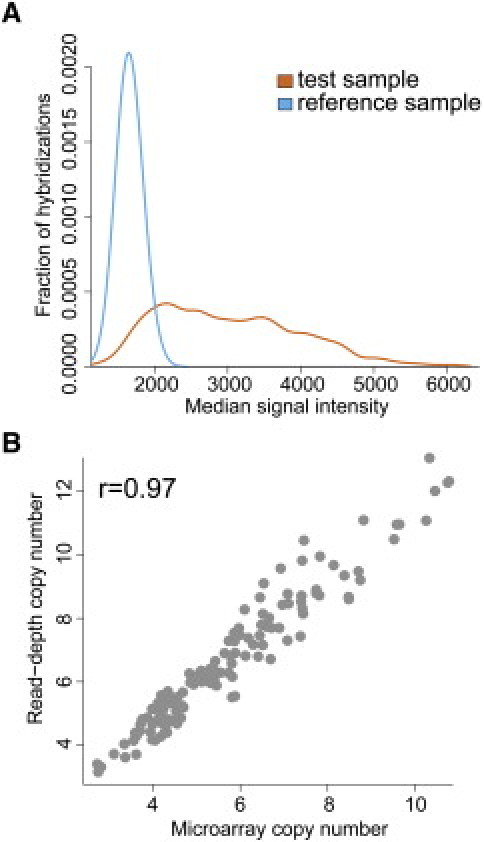
Using Array CGH to Estimate Copy Numbers for Loci without Discrete Copy-Number Classes
(A) Distributions of single-channel intensity values for the test sample (orange) and the reference sample (blue). The reference sample shows high reproducibility across all microarrays. Because this is a CNP, the test samples show much more variability in single-channel intensity.
(B) Copy number determined from single-channel intensity data are highly correlated to sequencing read depth copy-number estimates for a CNP overlapping NPEPPS on chromosome 17. The fit of this line may be used for subsequent determinations of copy number.
Of the 1495 CNPs we identified in our samples, 526 of these loci were not identified and a total of 578 (39%) were not genotyped in a recent large-scale CNV survey.19 Because we did not solely limit our analyses to CNPs with discrete copy numbers and are testing CNPs that have not been well characterized in previous studies, we were able to extend population-genetic analyses to previously uncharacterized variation in the human genome and examine their distribution across other populations.
Linkage Disequilibrium between CNPs and SNPs
Based on previous studies, there is a general consensus that there exists a high degree of linkage disequilibrium (LD) between simple biallelic CNPs and surrounding SNPs.6,11,19 We tested the LD patterns of the biallelic CNPs we genotyped, including those in the reference genome assembly and novel insertions. Among the biallelic, autosomal CNPs that passed our genotyping QC filters (Figure S1), we found that 516 out of 759 (68%) biallelic autosomal CNPs in the reference genome assembly were in high LD (r2 > 0.8) with at least one SNP in at least one of the five populations, which is in agreement with previous studies.6,11,19 For the 174 of 181 biallelic novel insertions for which we had approximate genomic locations,30 we observed 162 of 174 novel insertions (93%) in high LD (r2 > 0.8) with at least one SNP in at least one of the five populations.
To analyze the relationship of more complex CNPs with SNPs, we also tested the correlation of diploid copy number with SNP genotype for HapMap SNPs within 1 Mb of CNPs in the reference genome assembly and 5 Mb for novel insertions. We defined CNPs (n = 241) as located in segmental duplications if at least 50% of the bases in the CNP overlap with SDs or at least 50% of the bases overlap regions of excess whole-genome shotgun sequence detection (WSSD) in the Celera genome.47 Some of our CNPs had mirroring effects from the same probes mapping to paralogous duplications, and these effects could artificially reduce the correlation to SNP genotypes, as previously described.21 We classified the CNPs into paralogous duplication groups based on known SDs in the reference genome; we selected the CNP that was most correlated to a nearby SNP for analysis, which reduced the set to 192 duplication-rich CNPs. We defined CNPs in unique regions as CNPs with no overlap of segmental duplications or WSSD positive regions. The remaining 49 CNPs were intermediate between these two categories and were not included in the analysis. We observed that only 76 out of 192 CNPs (40%) in segmental duplications were highly correlated to SNP genotypes (r > 0.8; Pearson correlation) compared to 628 out of 892 CNPs (70%) in unique regions (Figure 3). CNPs in segmental duplications had significantly less correlation to SNPs (p < 2.2 × 10⁻¹⁶, Wilcoxon rank sum test). To evaluate whether SNP haplotypes could better capture the copy-number variation of multiallelic CNPs, we phased the surrounding SNPs for a subset of CNPs and evaluated the correlation of SNP haplotypes to diploid copy numbers. Using haplotypes did not significantly change our results; most CNPs with high correlation to SNP genotypes showed high correlation to SNP haplotypes, and all CNPs with low correlation to SNP genotypes showed low correlation to SNP haplotypes.
Figure 3.

CNPs in SDs Show Less LD to SNPs than CNPs in Unique Regions
(A) The distribution of correlation coefficients between copy number and SNP genotype are shown for CNPs in SDs (orange) and CNPs in unique regions (green). The dashed line represents the average maximum correlation across 100 samplings of the CNPs in unique regions to match the distances to the most correlated SNP for CNPs in duplication-rich regions. All SNPs within 1 Mb of the CNP were tested in five populations (European American [CEU], Han Chinese from Beijing [CHB], Japanese [JPT], Maasai [MKK], and Yoruba [YRI]) and the highest correlation coefficient in all populations was included.
(B) Distributions of the distance from the CNP to the most correlated SNP. The distance is slightly larger for CNPs in SDs (p = 0.3), but this does not explain the large difference in LD.
We performed a multiple regression analysis to ascertain the contributions of duplication status, multiallelic state, distance to most correlated SNP, and the minor allele frequency of the most correlated SNP to correlation with SNP genotypes. All the variables except for SNP minor allele frequency contributed to the model. This analysis suggests that CNPs in SDs are more likely to show less correlation to SNP genotypes independent of the distance to the most correlated SNP and whether the CNP was biallelic or multiallelic. However, we evaluated the relationship of these other two variables to the correlation of copy number to SNP genotype. Because CNPs in SDs are enriched for multiallelic states compared to SNPs in unique regions of the genome (75% versus 15%), we tested the influence of this difference on the correlation to biallelic SNP genotypes. We compared the distributions of correlation coefficients between biallelic CNPs in SDs and unique regions and found no difference (p = 0.85, Wilcoxon rank sum test). However, multiallelic CNPs in SDs were significantly less likely to be correlated with SNP genotypes than multiallelic CNPs in unique regions (p = 0.04, Wilcoxon rank sum test). We also examined the distributions of the distances to the most correlated SNP for segmental duplication CNPs and CNPs in unique regions (Figure 3). The distance to the most correlated SNP was smaller for CNPs in unique regions (p = 0.3, Wilcoxon rank sum test). We took 100 samplings of the unique regions, matching the distances observed for CNPs in SDs. In each of these samplings, we observed a significant difference in correlation to SNP genotype between CNPs in SDs and CNPs in unique regions (p = 8.3 × 10⁻¹³ − 4.3 × 10⁻⁶, Wilcoxon rank sum test), but the distributions in distance were the same (minimum p = 0.66 − 1, Wilcoxon rank sum test). Therefore, in agreement with a previous report,21 we found that reduced correlation between SNPs and duplication-rich CNPs is not completely due to a reduced number of SNPs near CNPs in duplication-rich regions.
Population-Differentiated CNPs
We compared our targeted CNPs across the five populations studied (CEU, CHB, JPT, MKK, and YRI) in order to to identify novel population-differentiated loci. We made use of the statistic VST, which was developed to quantify population differentiation in microarray hybridization data.27 VST is calculated from the variance of hybridization values within a population compared to the variance shared between populations and can be interpreted in a similar manner as FST, where high values suggest differentiation between populations and low values suggest that the populations are more similar. To be sure that our VST data were not being driven by technical artifacts, we compared VST to FST for biallelic CNPs. We observed a high correlation suggesting that VST is measuring differences in allele frequency and not data artifacts (Figure S6). Initially, we tested to see whether our data could reproduce known differentiated loci. As expected, we observed high VST values for CCL3L1 (MIM 601395) and UGT2B17 (Figure S7), which are known population-differentiated loci.5,48
We calculated VST between each pair of populations for CNPs including novel insertions (Table S9). The median VST across all loci was 0.089. We found 85 differentiated CNPs with VST statistics greater than that observed for CCL3L1. We observed high concordance with previously described highly differentiated loci discovered from sequencing read depth data13 reproducing the population differentiation results for 15 of 18 highly differentiated loci targeted on our microarray. In addition, 75 of these 85 CNPs were not described as highly differentiated by analysis of sequencing read depth.13 Clustering the patterns of the most differentiated CNPs allowed us to obtain a global picture of CNP frequency differences, and we observed different patterns of stratification across the five populations (Figure 4; Tables 2 and 3).
Figure 4.
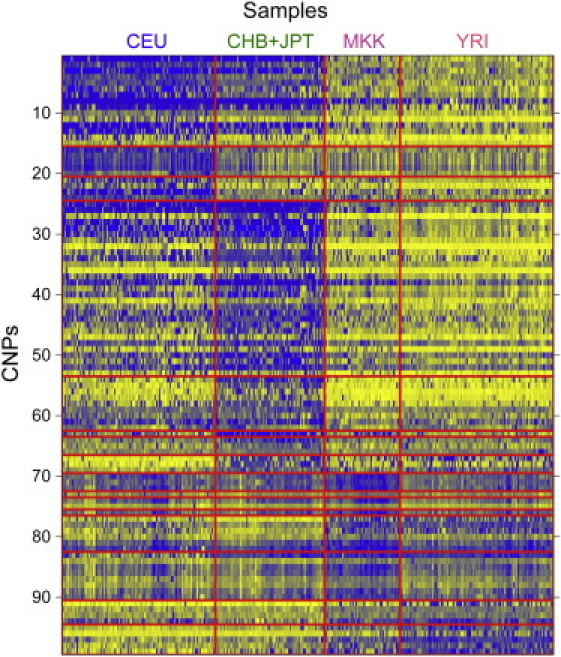
Population Differentiation of CNPs with High VST Values
The top 100 CNPs based on maximum VST between all pairwise comparisons of populations are shown for the initial analysis in 487 individuals from five populations: European American (CEU), Han Chinese from Beijing (CHB), Japanese (JPT), Maasai (MKK), and Yoruba (YRI). Blue color in the heatmap represents reduced copy when compared to the reference sample (a CEU female) and yellow represents increased copy number. Loci are clustered based on the pattern of hybridization values across populations.
Table 2.
CNPs that Overlap Coding Sequence and Are Population Differentiated
| Genomic Coordinates | Genes | SDa | Max VST (Initial)b | Max VST (Follow-Up) | Copy-Number Difference Observed |
|---|---|---|---|---|---|
| chr19:59492964-59497244 | LILRA3 | 1.00 | 0.62 | 0.51 | Non-Asians > Asians |
| chr12:11105655-11106159 | TAS2R46 | 0.00 | 0.61 | 0.63 | Non-Africans > Africans |
| chr4:69069560-69165912 | UGT2B17 | 0.51 | 0.61 | 0.65 | Non-Asians > Asians |
| chr17:42971236-43018268 | NPEPPS | 1.00 | 0.56 | 0.62 | Africans > Non-Africans |
| chr22:44102556-44102628 | FAM118A | 0.00 | 0.55 | 0.51 | Europeans > Africans |
| chr17:18302826-18366016 | LGALS9C | 1.00 | 0.49 | 0.57 | Non-Europeans > Europeans |
| chr12:11065498-11066488 | TAS2R48 | 1.00 | 0.49 | 0.64 | Non-Africans > Africans |
| chr5:68857344-68890304 | OCLN | 0.75 | 0.48 | 0.51 | Africans > Asians |
| chr2:88104488-88108744 | KRCC1 | 0.00 | 0.46 | 0.32 | Europeans > Non-Europeans |
| chr17:31562760-31564406 | CCL4L2; CCL4L1 | 1.00 | 0.45 | 0.51 | Non-Europeans > Europeans |
| chr14:73079816-73082320 | ACOT1 | 1.00 | 0.43 | 0.47 | Africans > Asians |
| chr11:47728864-47729376 | FNBP4 | 0.00 | 0.43 | 0.13 | All Others > MKK |
| chr1:143670880-143792368 | PDE4DIP | 0.22 | 0.43 | 0.55 | Asians > Africans |
| chr17:31634154-31665600 | CCL3L1; CCL4L2; CCL4L1 | 1.00 | 0.39 | 0.54 | Non-Europeans > Europeans |
| chr17:31527042-31548308 | CCL3L3; CCL3L1 | 1.00 | 0.39 | 0.43 | Non-Europeans > Europeans |
| chr16:14999403-15007845 | PDXDC1 | 1.00 | 0.38 | 0.63 | Non-Asians > Asians |
| chr17:41521520-41647328 | KIAA1267 | 0.20 | 0.37 | 0.46 | Europeans > Non-Europeans |
| chr8:133060680-133061512 | EFR3A | 0.00 | 0.36 | 0.14 | All Others > MKK |
| chr16:15008083-15010605 | PDXDC1 | 1.00 | 0.35 | 0.45 | Non-Asians > Asians |
| chr1:108535176-108538816 | SLC25A24 | 0.00 | 0.34 | 0.30 | Africans > Asians |
| chr2:73859008-73860128 | DUSP11 | 0.00 | 0.34 | 0.18 | All Others > MKK |
| chr16:31717708-32594648 | ZNF267; TP53TG3 | 0.71 | 0.34 | 0.54 | Africans > Non-Africans |
| chr1:120336200-120391104 | NOTCH2 | 1.00 | 0.34 | 0.56 | Non-Africans > Africans |
| chr12:376735-391793 | CCDC77; NM_001130148 | 0.00 | 0.34 | 0.30 | All Others > MKK |
| chr8:20121520-20122080 | ATP6V1B2 | 0.00 | 0.33 | 0.39 | All Others > MKK |
| chr20:1511631-1531931 | NM_001135844 | 0.00 | 0.33 | 0.25 | Non-Africans > Africans |
| chr22:17038218-17061216 | USP18 | 1.00 | 0.33 | 0.30 | Africans > Non-Africans |
| chr18:42800004-42816252 | TCEB3C; TCEB3CL; TCEB3B | 0.80 | 0.32 | 0.29 | Africans > Asians |
| chr17:32840120-32855124 | TADA2L; ACACA; NM_001166105 | 0.00 | 0.32 | 0.25 | Africans > Non-Africans |
| chr18:9245958-9246779 | ANKRD12 | 0.00 | 0.30 | 0.22 | All Others > MKK |
Bolded CNPs were not reported as differentiated with sequencing data.13 SD is an abbreviation for segmental duplication.
Proportion of CNP base pairs in segmental duplications.
Maximum VST obtained from all pairwise comparisons between populations for each CNP.
Table 3.
Population-Differentiated Novel Insertions
| Locusa | Max VST (Initial)b | Max VST (Follow-up) | Copy-Number Difference Observed | Conserved Elementsc | Position Relative to Nearest Gened |
|---|---|---|---|---|---|
| novel-locus_857 | 0.82 | 0.82 | European > African | ||
| OEA_200333 | 0.79 | 0.66 | Non-Asian > Asian | ||
| novel-locus_280 | 0.78 | 0.78 | African > Non-African | no | 578 kb upstream of BTBD3 |
| novel-locus_156 | 0.74 | 0.72 | African > Asian | ||
| novel-locus_506 | 0.70 | 0.79 | African > Non-African | ||
| OEA_206812 | 0.63 | 0.72 | African > Non-African | ||
| novel-locus_1132 | 0.57 | 0.58 | European > Non-European | ||
| novel-locus_585 | 0.55 | 0.70 | African > Non-African | ||
| novel-locus_335 | 0.53 | 0.53 | Non-European > European | yes | 17.5 kb downstream of ATP6V1G3 |
| novel-locus_399 | 0.53 | 0.53 | African > Non-African | ||
| novel-locus_158 | 0.52 | 0.58 | YRI+LWK > European | no | Intron of ACTR3 |
| novel-locus_371 | 0.51 | 0.66 | Non-European > European | no | Intron of PLEK2 |
| OEA_207712 | 0.50 | 0.63 | European > African | ||
| novel-locus_976 | 0.50 | 0.50 | Non-Asian > Asian | ||
| novel-locus_687 | 0.49 | 0.51 | Non-European > European | yes | Intron of LCT |
| OEA_209873 | 0.49 | 0.63 | African > Asian | ||
| OEA_200783 | 0.49 | 0.67 | African > Non-African | ||
| novel-locus_955 | 0.48 | 0.36 | African > Non-African | yes | Intron of TBCE |
| novel-locus_1181 | 0.47 | 0.47 | African > Asian | ||
| OEA_204853 | 0.46 | 0.52 | African > Non-African | ||
| novel-locus_707 | 0.44 | 0.40 | African > Non-African | no | 1.8 Mb downstream of NCAM2 |
| OEA_201275 | 0.44 | 0.37 | African > Asian | ||
| novel-locus_153 | 0.43 | 0.41 | Non-Asian > Asian | ||
| OEA_202951 | 0.43 | 0.55 | European > Non-European | ||
| novel-locus_981 | 0.43 | 0.43 | African > Non-African | ||
| OEA_209724 | 0.42 | 0.53 | African > Non-African | ||
| novel-locus_168 | 0.42 | 0.56 | African > Asian | no | 321 bp downstream of SNORD114-6 |
| novel-locus_247 | 0.41 | 0.41 | Asian > Non-Asian | yes | 36 kb upstream of CHORDC1 |
| novel-locus_297 | 0.41 | 0.47 | African > European | yes | 2 kb downstream of GSDMC |
| novel-locus_90 | 0.41 | 0.41 | African > European | ||
| novel-locus_1164 | 0.41 | 0.37 | African > Non-African | ||
| novel-locus_1042 | 0.40 | 0.46 | African > Non-African | no | 18 kb upstream of GPR39 |
| OEA_206891 | 0.40 | 0.50 | African > Non-African |
Locus names are from Kidd et al.18 One-end anchored sequences are given the designation “OEA_” (see Table S3 for full clone names).
Population-differentiated novel insertions with maximum VST values of at least 0.4 are shown.
The presence of conserved elements was tested in Kidd et al.18 and is given for insertions with breakpoint sequence data.
Positions relative to genes, along with breakpoint sequence data and precise genomic locations, are given for insertions (Table S2).
Previous analyses of sequence read depth have shown that CNPs in SDs have the greatest diversity in human populations;12,13 therefore, we compared the distributions of VST values for CNPs in SDs and in unique regions of the genome. We observed that CNPs in SDs tended to have higher VST values than CNPs in unique regions of the genome (Kolmogorov-Smirnov two-tailed test, p = 0.015; Figure 5A). This difference is primarily an enrichment of VST values between 0.2 and 0.5 in the CNPs in duplicated regions of the genome. We noted that the variance of log2 ratios was not correlated to median copy number for unique or duplicated CNPs, suggesting that this result was not due to VST values rising with increasing median copy number (Figure S8).
Figure 5.

Comparisons of Population Differentiation between Different Classes of Variants
Histograms of VST or FST values are plotted.
(A) Informative CNPs were stratified based on their duplication content; CNPs with at least 50% overlap with SDs or regions of excess read depth in the Celera genome were defined as duplication rich. CNPs with zero bases of SD or excess read depth were defined as unique. Distributions of maximum VST value for each CNP are plotted for both classes of variants. These distributions are significantly different from one another (Kolmogorov-Smirnov two-tailed test, p = 0.015).
(B) Comparison of FST statistics for biallelic autosomal CNPs compared to frequency-matched, autosomal SNPs (Kolmogorov-Smirnov two-tailed test, p = 0.0026).
We also compared the population differentiation of CNPs to SNPs. We limited these analyses to the 940 biallelic autosomal CNPs that could be assigned allelic genotypes in order to calculate FST. These CNPs are simple deletions with diploid copy-number classes of 0, 1, and 2 or duplications with diploid copy-number classes of 2, 3, and 4. We compared the distribution of FST values of all biallelic, autosomal CNPs (novel insertions and reference genome loci) to an equivalent number of random autosomal SNPs selected from the HapMap Phase III data and matched to the allele frequency distribution of the biallelic CNPs. Although the median FST values are similar for the two types of genetic variants, the distribution of FST values for the CNPs has a higher standard deviation, and high FST loci appear to be enriched for CNPs (Kolmogorov-Smirnov two-tailed test, p = 0.0026; Figure 5B). These biallelic CNPs could differentiate individuals of European, African, and East Asian ancestry and could distinguish Yoruba (YRI) from Maasai (MKK) individuals (Figure S9).
We found 30 highly differentiated CNPs that contain coding sequence (Table 2). Of these 30 CNPs, 18 (60%) have at least 20% overlap with SDs, representing a 1.4-fold enrichment of SD content compared to all tested CNPs that contain coding sequence (p = 0.06, chi-square test). Notably, 16 of these 30 CNPs (53.3%) had not been genotyped in previous CNP analyses.6,19 In addition, 13 of these 30 loci were not identified as population differentiated in a read-depth-based analysis of copy number on a more limited number of individuals.13 After analyzing these CNPs in an additional 809 unrelated individuals from further populations, 21 of these variants still had a maximum VST > 0.3. These genes appear to be primarily environmental response genes, including CNPs involving two bitter taste receptor genes on chromosome 12 (TAS2R46 [MIM 612774] and TAS2R48) that might be involved in lung function.49,50 These CNPs have higher copy number in non-Africans than in Africans; maximum VST values were 0.63 for TAS2R46 and 0.64 for TAS2R48 between Japanese (JPT) and Yoruba (YRI) individuals (Figure 6A). We also identified a CNP overlapping OCLN (MIM 602876) that encodes for occludin, which is involved in hepatitis viral entry.51 This CNP shows lower copy number in the East Asian individuals compared to the African individuals with a maximum VST of 0.51 between Han Chinese from Beijing (CHB) and Yoruba (YRI) (Figure 6B). This variant maps to a segmental duplication that contains the last five exons of OCLN. The two paralogous duplications are separated by 1.4 Mb of sequence and are highly identical; it appears from singly unique nucleotides that the polymorphism involves the distal paralog.13 We designed a quantitative PCR assay for this CNP and obtained estimated copy numbers for 687 individuals in the Human Genome Diversity Project (HGDP) (Figure 7A). We observed considerable diversity in this CNP, but we note that East and Southeast Asian individuals have significantly fewer copies (median CN = 2.8) than individuals from other populations (median CN = 3.2) (two-tailed t test, p = 4.2 × 10⁻⁴). Interestingly, we also observed differences in the copy-number distribution for nearby populations in contrast to the expected cline of copy-number frequencies.
Figure 6.

Examples of Population-Differentiated Loci
Histograms of log2 ratios are plotted for the unrelated individuals in each population.
(A) Diagram of the bitter taste receptor cluster on chromosome 12 and distribution of log2 ratios for a CNP containing TAS2R46. The maximum VST is 0.63 between YRI and JPT.
(B) Diagram of the CNP containing the last five exons of OCLN and the distribution of log2 ratios for a CNP in OCLN. The maximum VST for this locus is 0.51 between YRI and CHB.
Figure 7.
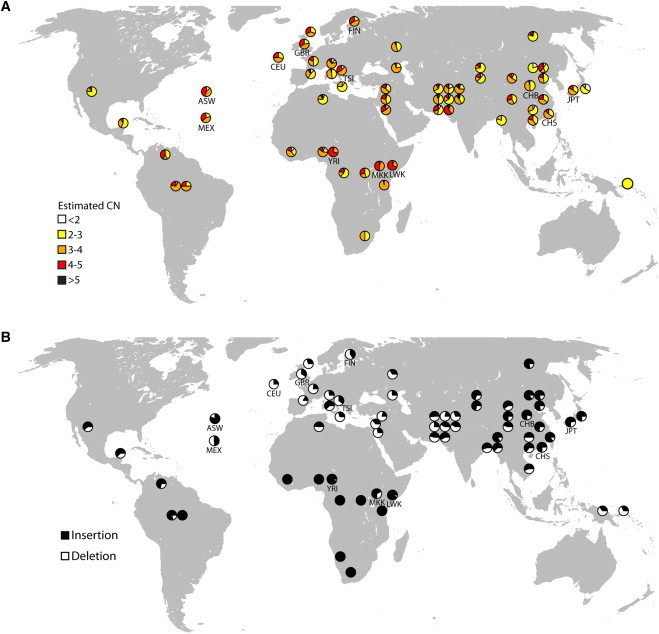
Worldwide Distributions of Selected CNPs
We designed PCR or qPCR assays to genotype selected CNPs in HGDP individuals from 52 populations. Included in the figure are the copy-number distributions for the 12 populations tested with microarray. These pie charts are labeled with population codes.
(A) We obtained copy-number estimates from qPCR for 687 individuals for the CNP overlapping OCLN. The distributions of estimated copy number for each population with data in at least five individuals are overlaid on a map of the world.
(B) We obtained allele frequencies for an insertion of novel sequence located near ATP6V1G3 for 952 HGDP individuals. The allele frequencies of the insertion (black) and the deletion allele (white) are shown for each population.
We observed 33 differentiated novel sequence insertions with VST values greater than the CCL3L1 CNP. Several of these novel insertions contain conserved sequence elements,30 and a number of these variants are in close proximity to genes (Table 3). We used PCR-based assays to genotype three of these variants in individuals from the HGDP (Figure S10). These variants include an insertion downstream of ATP6V1G3 (novel-locus_335), where we observed that the deletion allele of this variant is almost absent in sub-Saharan African individuals, with the exception of the Maasai (MKK) (FST between Maasai and all other sub-Saharan Africans = 0.26), and is present at the highest frequencies in European and Middle Eastern individuals (FST between Europeans and Middle Eastern individuals and sub-Saharan Africans = 0.44) (Figure 7B).
Discussion
We have presented a population genetic analysis of CNPs in five human populations. Although copy number can be accurately assessed with next-generation sequencing,12,13 these methodologies depend on whole-genome sequencing data, which is expensive to obtain on a large number of individuals for disease association. Existing SNP microarrays lack probes in many known CNP loci, especially variants in SDs,7 despite the fact that several CNPs in SDs have been implicated in human disease, including the beta-defensin cluster in psoriasis and Crohn disease52,53 and FCGR3B (MIM 610665) in autoimmune disorders.54 Furthermore, no platform based on the human reference sequence captures insertions of novel sequence, which are frequently polymorphic in human populations.17,18 Although our custom microarray also does not test the comprehensive landscape of CNPs, we believe that this microarray complements other microarrays by targeting CNPs that are not well captured on other platforms.
We have designed this customized microarray to more fully explore the human CNP landscape. For example, 937 of the 1495 (63%) polymorphic loci that perform well on our microarray are not sufficiently covered (less than five probes) by either the Affymetrix 6.0 or the Illumina 1M SNP microarrays. In addition, 808 of the 1495 (54%) loci were not tested in a large CNP association study.20 As part of this study, we have developed a method for estimating copy number from array CGH data even when the CNP does not form clear discrete copy-number classes. This approach uses the single-channel intensity data from the microarray informed by copy numbers estimated from next-generation sequencing data.13 By using these methods, we could confidently assign copy numbers for 1495 CNPs.
An important conclusion of this work is that the majority of CNPs (∼60%) mapping to SDs show weak LD with flanking SNPs in contrast to those mapping within unique regions of the genome. Although consistent with earlier bacterial artificial chromosome-based surveys,11 our results emphasize the importance of assaying CNPs directly instead of relying on imputation methods with SNP genotypes. In agreement with a previous report,21 we have shown that differences in SNP density are not entirely responsible for this lack of correlation. We found that reduced correlation to SNP genotypes is primarily a property of CNPs in SDs, not of all multiallelic CNPs. Because of the dispersed nature of many SDs, additional transposed duplication copies may account for this reduced correlation as previously suggested.21 Additionally, the increased mutation rate of CNPs in SDs also probably contributes to reduced correlation. Locus-specific CNV mutation rates several orders of magnitude higher than SNPs have been estimated for duplication-rich regions of the genome22–24 because of their propensity to undergo nonallelic homologous recombination (NAHR).55,56 Recurrent mutations would create copy-number genotypes identical by state on different haplotypes. An important caveat of our analysis is that for multiallelic CNPs, we are correlating diploid copy number to SNP genotype because we are unable to deconvolute diploid copy numbers into allelic copy number. As haplotype-resolving sequencing methods57,58 become more tractable on large numbers of individuals, it will be of interest to compare allelic copy numbers to SNP alleles and haplotypes.
We have focused on identifying new CNPs with large differences in frequency between populations, and we report 85 of the most stratified copy-number polymorphic variants in the human population. Of these variants, 37 have not been genotyped in previous microarray or sequencing studies,6,7,13,19 including 16 CNPs that involve protein coding sequence not previously genotyped on other microarray platforms,6,7,19 seven of which were not observed to be population differentiated in an analysis of sequencing read depth from a limited number of individuals.13 Differences in allele frequency between populations are a potential signal of recent positive selection, and we have identified several loci that appear to be good candidates for selection. For example, we observe that the East Asian individuals carry fewer copies of a duplication that overlaps OCLN. This gene encodes for the tight-junction protein occludin, which has recently been shown to be involved in hepatitis C viral entry.51 Therefore, this CNP, which alters the copy number of the last five exons of OCLN, is a biologically plausible candidate for recent selection in humans related to hepatitis C susceptibility (MIM 609532) or progress. We also found that two bitter taste receptors (TAS2R46 and TAS2R48) show large differences in copy number between populations: African individuals have fewer copies than non-Africans. It has recently been shown that bitter taste receptors are expressed in the lung in both airway epithelial cells and airway smooth muscle cells, and these receptors may play a role in the elimination of noxious compounds and in airway dilation.49,50 The role of these CNPs in lung disease can now be directly tested.
SD-associated CNPs were more likely to be differentiated among human populations than either CNPs in unique regions or SNPs on the basis of the observation that biallelic CNPs, most of which are in unique regions, were more likely to be stratified than SNPs. One possible explanation for this result is that CNPs may have been subjected to stronger selection, similar to what has been observed for larger rare CNVs.41 If alleles are more likely to arise multiple times in a population, then genetic drift or selection is given more opportunity to operate on new alleles, resulting in a greater likelihood of population differentiation. Because these forces would have been acting independently in the populations studied, this model may explain the enrichment of population differentiation in SD regions of the genome. With respect to selection, it is intriguing that we observe a trend where CNPs with coding sequence are more likely to be population differentiated when compared to CNPs that do not carry genes. However, it is also possible that this result is due to differences in ascertainment between the CNPs in our analysis and the SNPs genotyped in the HapMap project. In particular, the frequency spectrum of our biallelic CNPs was biased toward low minor allele frequency when compared to random (not frequency matched) HapMap SNPs, and bias in ascertainment of the SNP data may explain, in part, differences that we observed in FST distributions.
In summary, the work presented here helps to expand our understanding of human copy-number polymorphisms and their population-genetic properties. Although more than 50% of the CNPs described in this study have not yet been previously assayed as part of disease association studies, a significant fraction of our own targeted loci still remain unassayable despite evidence of copy-number variation. In addition, our results suggest that the copy number of multiallelic CNPs, especially those in SDs, cannot be imputed from SNP genotypes and should be directly measured. As additional genomes become sequenced and novel insertions more fully characterized over the next few years, a more complete picture will emerge. Robust and cost-effective experimental assays that accurately predict copy among thousands of samples will, however, still be required. A more thorough assessment of the relationship of CNPs to human diseases is warranted before concluding that they do not contribute to the “missing heritability” of complex diseases.6,19
Acknowledgments
We thank K. Meltz Steinberg and S. Girirajan for thoughtful discussions. We are grateful to T. Brown for assistance with manuscript preparation and to C. Baker for technical advice. C.D.C. was supported by a Ruth L. Kirschstein National Research Service Award (NRSA) training grant to the University of Washington (T32HG00035) and an individual NRSA Fellowship (F32HG006070). P.H.S. was supported by a Natural Sciences and Engineering Research Council of Canada Fellowship. This work was supported by National Institutes of Health Grant HG004120 to E.E.E. E.E.E. is an Investigator of the Howard Hughes Medical Institute. N.S., A.T., P.T., and L.B. are employees and shareholders of Agilent Technologies. E.E.E. is on the scientific advisory board for Pacific Biosciences.
Supplemental Data
Web Resources
The URLs for data presented herein are as follows:
Database of genomic structural variation (dbVar), http://www.ncbi.nlm.nih.gov/dbvar/
HapMap SNP genotypes, http://hapmap.ncbi.nlm.nih.gov/
Microarray data in Gene Expression Omnibus (GEO), http://www.ncbi.nim.nih.gov/geo/acc.cgi?acc=GSE26450
Online Mendelian Inheritance in Man (OMIM), http://www.ncbi.nlm.nih.gov/omim/
Accession Numbers
The raw microarray data reported in this paper have been deposited in the National Center for Biotechnology Information's Gene Expression Omnibus under accession number GSE26450.
The CNPs and copy-number genotypes have been deposited into the National Center for Biotechnology Information's dbVar under accession number nstd46.
References
- 1.Sebat J., Lakshmi B., Troge J., Alexander J., Young J., Lundin P., Månér S., Massa H., Walker M., Chi M. Large-scale copy number polymorphism in the human genome. Science. 2004;305:525–528. doi: 10.1126/science.1098918. [DOI] [PubMed] [Google Scholar]
- 2.Iafrate A.J., Feuk L., Rivera M.N., Listewnik M.L., Donahoe P.K., Qi Y., Scherer S.W., Lee C. Detection of large-scale variation in the human genome. Nat. Genet. 2004;36:949–951. doi: 10.1038/ng1416. [DOI] [PubMed] [Google Scholar]
- 3.Hinds D.A., Kloek A.P., Jen M., Chen X., Frazer K.A. Common deletions and SNPs are in linkage disequilibrium in the human genome. Nat. Genet. 2006;38:82–85. doi: 10.1038/ng1695. [DOI] [PubMed] [Google Scholar]
- 4.Conrad D.F., Andrews T.D., Carter N.P., Hurles M.E., Pritchard J.K. A high-resolution survey of deletion polymorphism in the human genome. Nat. Genet. 2006;38:75–81. doi: 10.1038/ng1697. [DOI] [PubMed] [Google Scholar]
- 5.McCarroll S.A., Hadnott T.N., Perry G.H., Sabeti P.C., Zody M.C., Barrett J.C., Dallaire S., Gabriel S.B., Lee C., Daly M.J., Altshuler D.M., International HapMap Consortium Common deletion polymorphisms in the human genome. Nat. Genet. 2006;38:86–92. doi: 10.1038/ng1696. [DOI] [PubMed] [Google Scholar]
- 6.McCarroll S.A., Kuruvilla F.G., Korn J.M., Cawley S., Nemesh J., Wysoker A., Shapero M.H., de Bakker P.I., Maller J.B., Kirby A. Integrated detection and population-genetic analysis of SNPs and copy number variation. Nat. Genet. 2008;40:1166–1174. doi: 10.1038/ng.238. [DOI] [PubMed] [Google Scholar]
- 7.Cooper G.M., Zerr T., Kidd J.M., Eichler E.E., Nickerson D.A. Systematic assessment of copy number variant detection via genome-wide SNP genotyping. Nat. Genet. 2008;40:1199–1203. doi: 10.1038/ng.236. [DOI] [PMC free article] [PubMed] [Google Scholar]
- 8.Itsara A., Cooper G.M., Baker C., Girirajan S., Li J., Absher D., Krauss R.M., Myers R.M., Ridker P.M., Chasman D.I. Population analysis of large copy number variants and hotspots of human genetic disease. Am. J. Hum. Genet. 2009;84:148–161. doi: 10.1016/j.ajhg.2008.12.014. [DOI] [PMC free article] [PubMed] [Google Scholar]
- 9.Sharp A.J., Locke D.P., McGrath S.D., Cheng Z., Bailey J.A., Vallente R.U., Pertz L.M., Clark R.A., Schwartz S., Segraves R. Segmental duplications and copy-number variation in the human genome. Am. J. Hum. Genet. 2005;77:78–88. doi: 10.1086/431652. [DOI] [PMC free article] [PubMed] [Google Scholar]
- 10.Estivill X., Cheung J., Pujana M.A., Nakabayashi K., Scherer S.W., Tsui L.C. Chromosomal regions containing high-density and ambiguously mapped putative single nucleotide polymorphisms (SNPs) correlate with segmental duplications in the human genome. Hum. Mol. Genet. 2002;11:1987–1995. doi: 10.1093/hmg/11.17.1987. [DOI] [PubMed] [Google Scholar]
- 11.Locke D.P., Sharp A.J., McCarroll S.A., McGrath S.D., Newman T.L., Cheng Z., Schwartz S., Albertson D.G., Pinkel D., Altshuler D.M., Eichler E.E. Linkage disequilibrium and heritability of copy-number polymorphisms within duplicated regions of the human genome. Am. J. Hum. Genet. 2006;79:275–290. doi: 10.1086/505653. [DOI] [PMC free article] [PubMed] [Google Scholar]
- 12.Alkan C., Kidd J.M., Marques-Bonet T., Aksay G., Antonacci F., Hormozdiari F., Kitzman J.O., Baker C., Malig M., Mutlu O. Personalized copy number and segmental duplication maps using next-generation sequencing. Nat. Genet. 2009;41:1061–1067. doi: 10.1038/ng.437. [DOI] [PMC free article] [PubMed] [Google Scholar]
- 13.Sudmant P.H., Kitzman J.O., Antonacci F., Alkan C., Malig M., Tsalenko A., Sampas N., Bruhn L., Shendure J., Eichler E.E., 1000 Genomes Project Diversity of human copy number variation and multicopy genes. Science. 2010;330:641–646. doi: 10.1126/science.1197005. [DOI] [PMC free article] [PubMed] [Google Scholar]
- 14.Park H., Kim J.I., Ju Y.S., Gokcumen O., Mills R.E., Kim S., Lee S., Suh D., Hong D., Kang H.P. Discovery of common Asian copy number variants using integrated high-resolution array CGH and massively parallel DNA sequencing. Nat. Genet. 2010;42:400–405. doi: 10.1038/ng.555. [DOI] [PMC free article] [PubMed] [Google Scholar]
- 15.Kidd J.M., Cooper G.M., Donahue W.F., Hayden H.S., Sampas N., Graves T., Hansen N., Teague B., Alkan C., Antonacci F. Mapping and sequencing of structural variation from eight human genomes. Nature. 2008;453:56–64. doi: 10.1038/nature06862. [DOI] [PMC free article] [PubMed] [Google Scholar]
- 16.Levy S., Sutton G., Ng P.C., Feuk L., Halpern A.L., Walenz B.P., Axelrod N., Huang J., Kirkness E.F., Denisov G. The diploid genome sequence of an individual human. PLoS Biol. 2007;5:e254. doi: 10.1371/journal.pbio.0050254. [DOI] [PMC free article] [PubMed] [Google Scholar]
- 17.Li R., Li Y., Zheng H., Luo R., Zhu H., Li Q., Qian W., Ren Y., Tian G., Li J. Building the sequence map of the human pan-genome. Nat. Biotechnol. 2010;28:57–63. doi: 10.1038/nbt.1596. [DOI] [PubMed] [Google Scholar]
- 18.Kidd J.M., Sampas N., Antonacci F., Graves T., Fulton R., Hayden H.S., Alkan C., Malig M., Ventura M., Giannuzzi G. Characterization of missing human genome sequences and copy-number polymorphic insertions. Nat Meth. 2010;7:365–371. doi: 10.1038/nmeth.1451. [DOI] [PMC free article] [PubMed] [Google Scholar]
- 19.Conrad D.F., Pinto D., Redon R., Feuk L., Gokcumen O., Zhang Y., Aerts J., Andrews T.D., Barnes C., Campbell P., Wellcome Trust Case Control Consortium Origins and functional impact of copy number variation in the human genome. Nature. 2010;464:704–712. doi: 10.1038/nature08516. [DOI] [PMC free article] [PubMed] [Google Scholar]
- 20.Craddock N., Hurles M.E., Cardin N., Pearson R.D., Plagnol V., Robson S., Vukcevic D., Barnes C., Conrad D.F., Giannoulatou E., Wellcome Trust Case Control Consortium Genome-wide association study of CNVs in 16,000 cases of eight common diseases and 3,000 shared controls. Nature. 2010;464:713–720. doi: 10.1038/nature08979. [DOI] [PMC free article] [PubMed] [Google Scholar]
- 21.Schrider D.R., Hahn M.W. Lower linkage disequilibrium at CNVs is due to both recurrent mutation and transposing duplications. Mol. Biol. Evol. 2010;27:103–111. doi: 10.1093/molbev/msp210. [DOI] [PMC free article] [PubMed] [Google Scholar]
- 22.Egan C.M., Sridhar S., Wigler M., Hall I.M. Recurrent DNA copy number variation in the laboratory mouse. Nat. Genet. 2007;39:1384–1389. doi: 10.1038/ng.2007.19. [DOI] [PubMed] [Google Scholar]
- 23.Lupski J.R. Genomic rearrangements and sporadic disease. Nat. Genet. 2007;39(7, Suppl):S43–S47. doi: 10.1038/ng2084. [DOI] [PubMed] [Google Scholar]
- 24.Turner D.J., Miretti M., Rajan D., Fiegler H., Carter N.P., Blayney M.L., Beck S., Hurles M.E. Germline rates of de novo meiotic deletions and duplications causing several genomic disorders. Nat. Genet. 2008;40:90–95. doi: 10.1038/ng.2007.40. [DOI] [PMC free article] [PubMed] [Google Scholar]
- 25.Kidd J.M., Newman T.L., Tuzun E., Kaul R., Eichler E.E. Population stratification of a common APOBEC gene deletion polymorphism. PLoS Genet. 2007;3:e63. doi: 10.1371/journal.pgen.0030063. [DOI] [PMC free article] [PubMed] [Google Scholar]
- 26.Yang T.L., Chen X.D., Guo Y., Lei S.F., Wang J.T., Zhou Q., Pan F., Chen Y., Zhang Z.X., Dong S.S. Genome-wide Copy-Number-Variation Study Identified a Susceptibility Gene, UGT2B17, for Osteoporosis. Am J Hum Genet. 2008;83:663–674.. doi: 10.1016/j.ajhg.2008.10.006. [DOI] [PMC free article] [PubMed] [Google Scholar]
- 27.Redon R., Ishikawa S., Fitch K.R., Feuk L., Perry G.H., Andrews T.D., Fiegler H., Shapero M.H., Carson A.R., Chen W. Global variation in copy number in the human genome. Nature. 2006;444:444–454. doi: 10.1038/nature05329. [DOI] [PMC free article] [PubMed] [Google Scholar]
- 28.Cann H.M., de Toma C., Cazes L., Legrand M.F., Morel V., Piouffre L., Bodmer J., Bodmer W.F., Bonne-Tamir B., Cambon-Thomsen A. A human genome diversity cell line panel. Science. 2002;296:261–262. doi: 10.1126/science.296.5566.261b. [DOI] [PubMed] [Google Scholar]
- 29.Rosenberg N.A. Standardized subsets of the HGDP-CEPH Human Genome Diversity Cell Line Panel, accounting for atypical and duplicated samples and pairs of close relatives. Ann. Hum. Genet. 2006;70:841–847. doi: 10.1111/j.1469-1809.2006.00285.x. [DOI] [PubMed] [Google Scholar]
- 30.Kidd J.M., Sampas N., Antonacci F., Graves T., Fulton R., Hayden H.S., Alkan C., Malig M., Ventura M., Giannuzzi G. Characterization of missing human genome sequences and copy-number polymorphic insertions. Nat. Methods. 2010;7:365–371. doi: 10.1038/nmeth.1451. [DOI] [PMC free article] [PubMed] [Google Scholar]
- 31.Selzer R.R., Richmond T.A., Pofahl N.J., Green R.D., Eis P.S., Nair P., Brothman A.R., Stallings R.L. Analysis of chromosome breakpoints in neuroblastoma at sub-kilobase resolution using fine-tiling oligonucleotide array CGH. Genes Chromosomes Cancer. 2005;44:305–319. doi: 10.1002/gcc.20243. [DOI] [PubMed] [Google Scholar]
- 32.Edgar R., Domrachev M., Lash A.E. Gene Expression Omnibus: NCBI gene expression and hybridization array data repository. Nucleic Acids Res. 2002;30:207–210. doi: 10.1093/nar/30.1.207. [DOI] [PMC free article] [PubMed] [Google Scholar]
- 33.Perry G.H., Ben-Dor A., Tsalenko A., Sampas N., Rodriguez-Revenga L., Tran C.W., Scheffer A., Steinfeld I., Tsang P., Yamada N.A. The fine-scale and complex architecture of human copy-number variation. Am. J. Hum. Genet. 2008;82:685–695. doi: 10.1016/j.ajhg.2007.12.010. [DOI] [PMC free article] [PubMed] [Google Scholar]
- 34.Ben-Dor A., Shamir R., Yakhini Z. Clustering gene expression patterns. J. Comput. Biol. 1999;6:281–297. doi: 10.1089/106652799318274. [DOI] [PubMed] [Google Scholar]
- 35.Barrett J.C., Fry B., Maller J., Daly M.J. Haploview: Analysis and visualization of LD and haplotype maps. Bioinformatics. 2005;21:263–265. doi: 10.1093/bioinformatics/bth457. [DOI] [PubMed] [Google Scholar]
- 36.Browning S.R., Browning B.L. Rapid and accurate haplotype phasing and missing-data inference for whole-genome association studies by use of localized haplotype clustering. Am. J. Hum. Genet. 2007;81:1084–1097. doi: 10.1086/521987. [DOI] [PMC free article] [PubMed] [Google Scholar]
- 37.Weir B.S., Cockerham C.C. Estimating F-statistics for the analysis of population structure. Evolution. 1984;38:1358–1370. doi: 10.1111/j.1558-5646.1984.tb05657.x. [DOI] [PubMed] [Google Scholar]
- 38.Weir B.S. Sinauer; Sunderland, MA: 1996. Genetic Data Analysis II. [Google Scholar]
- 39.Bailey J.A., Kidd J.M., Eichler E.E. Human copy number polymorphic genes. Cytogenet. Genome Res. 2008;123:234–243. doi: 10.1159/000184713. [DOI] [PMC free article] [PubMed] [Google Scholar]
- 40.Bentley D.R., Balasubramanian S., Swerdlow H.P., Smith G.P., Milton J., Brown C.G., Hall K.P., Evers D.J., Barnes C.L., Bignell H.R. Accurate whole human genome sequencing using reversible terminator chemistry. Nature. 2008;456:53–59. doi: 10.1038/nature07517. [DOI] [PMC free article] [PubMed] [Google Scholar]
- 41.Itsara A., Wu H., Smith J.D., Nickerson D.A., Romieu I., London S.J., Eichler E.E. De novo rates and selection of large copy number variation. Genome Res. 2010;20:1469–1481. doi: 10.1101/gr.107680.110. [DOI] [PMC free article] [PubMed] [Google Scholar]
- 42.Ley T.J., Mardis E.R., Ding L., Fulton B., McLellan M.D., Chen K., Dooling D., Dunford-Shore B.H., McGrath S., Hickenbotham M. DNA sequencing of a cytogenetically normal acute myeloid leukaemia genome. Nature. 2008;456:66–72. doi: 10.1038/nature07485. [DOI] [PMC free article] [PubMed] [Google Scholar]
- 43.Wang J., Wang W., Li R., Li Y., Tian G., Goodman L., Fan W., Zhang J., Li J., Zhang J. The diploid genome sequence of an Asian individual. Nature. 2008;456:60–65. doi: 10.1038/nature07484. [DOI] [PMC free article] [PubMed] [Google Scholar]
- 44.Tuzun E., Sharp A.J., Bailey J.A., Kaul R., Morrison V.A., Pertz L.M., Haugen E., Hayden H., Albertson D., Pinkel D. Fine-scale structural variation of the human genome. Nat. Genet. 2005;37:727–732. doi: 10.1038/ng1562. [DOI] [PubMed] [Google Scholar]
- 45.Frazer K.A., Ballinger D.G., Cox D.R., Hinds D.A., Stuve L.L., Gibbs R.A., Belmont J.W., Boudreau A., Hardenbol P., Leal S.M., International HapMap Consortium A second generation human haplotype map of over 3.1 million SNPs. Nature. 2007;449:851–861. doi: 10.1038/nature06258. [DOI] [PMC free article] [PubMed] [Google Scholar]
- 46.The 1000 Genomes Project Consortium A map of human genome variation from population-scale sequencing. Nature. 2010;467:1061–1073. doi: 10.1038/nature09534. [DOI] [PMC free article] [PubMed] [Google Scholar]
- 47.Bailey J.A., Gu Z., Clark R.A., Reinert K., Samonte R.V., Schwartz S., Adams M.D., Myers E.W., Li P.W., Eichler E.E. Recent segmental duplications in the human genome. Science. 2002;297:1003–1007. doi: 10.1126/science.1072047. [DOI] [PubMed] [Google Scholar]
- 48.Gonzalez E., Kulkarni H., Bolivar H., Mangano A., Sanchez R., Catano G., Nibbs R.J., Freedman B.I., Quinones M.P., Bamshad M.J. The influence of CCL3L1 gene-containing segmental duplications on HIV-1/AIDS susceptibility. Science. 2005;307:1434–1440. doi: 10.1126/science.1101160. [DOI] [PubMed] [Google Scholar]
- 49.Deshpande D.A., Wang W.C., McIlmoyle E.L., Robinett K.S., Schillinger R.M., An S.S., Sham J.S., Liggett S.B. Bitter taste receptors on airway smooth muscle bronchodilate by localized calcium signaling and reverse obstruction. Nat. Med. 2010;16:1299–1304. doi: 10.1038/nm.2237. [DOI] [PMC free article] [PubMed] [Google Scholar]
- 50.Shah A.S., Ben-Shahar Y., Moninger T.O., Kline J.N., Welsh M.J. Motile cilia of human airway epithelia are chemosensory. Science. 2009;325:1131–1134. doi: 10.1126/science.1173869. [DOI] [PMC free article] [PubMed] [Google Scholar]
- 51.Ploss A., Evans M.J., Gaysinskaya V.A., Panis M., You H., de Jong Y.P., Rice C.M. Human occludin is a hepatitis C virus entry factor required for infection of mouse cells. Nature. 2009;457:882–886. doi: 10.1038/nature07684. [DOI] [PMC free article] [PubMed] [Google Scholar]
- 52.Frank B., Bermejo J.L., Hemminki K., Sutter C., Wappenschmidt B., Meindl A., Kiechle-Bahat M., Bugert P., Schmutzler R.K., Bartram C.R., Burwinkel B. Copy number variant in the candidate tumor suppressor gene MTUS1 and familial breast cancer risk. Carcinogenesis. 2007;28:1442–1445. doi: 10.1093/carcin/bgm033. [DOI] [PubMed] [Google Scholar]
- 53.Hollox E.J., Huffmeier U., Zeeuwen P.L., Palla R., Lascorz J., Rodijk-Olthuis D., van de Kerkhof P.C., Traupe H., de Jongh G., den Heijer M. Psoriasis is associated with increased beta-defensin genomic copy number. Nat. Genet. 2008;40:23–25. doi: 10.1038/ng.2007.48. [DOI] [PMC free article] [PubMed] [Google Scholar]
- 54.Fanciulli M., Norsworthy P.J., Petretto E., Dong R., Harper L., Kamesh L., Heward J.M., Gough S.C., de Smith A., Blakemore A.I. FCGR3B copy number variation is associated with susceptibility to systemic, but not organ-specific, autoimmunity. Nat. Genet. 2007;39:721–723. doi: 10.1038/ng2046. [DOI] [PMC free article] [PubMed] [Google Scholar]
- 55.Hastings P.J., Lupski J.R., Rosenberg S.M., Ira G. Mechanisms of change in gene copy number. Nat. Rev. Genet. 2009;10:551–564. doi: 10.1038/nrg2593. [DOI] [PMC free article] [PubMed] [Google Scholar]
- 56.Stankiewicz P., Lupski J.R. Genome architecture, rearrangements and genomic disorders. Trends Genet. 2002;18:74–82. doi: 10.1016/s0168-9525(02)02592-1. [DOI] [PubMed] [Google Scholar]
- 57.Fan H.C., Wang J., Potanina A., Quake S.R. Whole-genome molecular haplotyping of single cells. Nat. Biotechnol. 2011;29:51–57. doi: 10.1038/nbt.1739. [DOI] [PMC free article] [PubMed] [Google Scholar]
- 58.Kitzman J.O., Mackenzie A.P., Adey A., Hiatt J.B., Patwardhan R.P., Sudmant P.H., Ng S.B., Alkan C., Qiu R., Eichler E.E., Shendure J. Haplotype-resolved genome sequencing of a Gujarati Indian individual. Nat. Biotechnol. 2011;29:59–63. doi: 10.1038/nbt.1740. [DOI] [PMC free article] [PubMed] [Google Scholar]
Associated Data
This section collects any data citations, data availability statements, or supplementary materials included in this article.