

Abstract
The gene has been proposed as an attractive unit of analysis for association studies, but a simple yet valid, powerful, and sufficiently fast method of evaluating the statistical significance of all genes in large, genome-wide datasets has been lacking. Here we propose the use of an extended Simes test that integrates functional information and association evidence to combine the p values of the single nucleotide polymorphisms within a gene to obtain an overall p value for the association of the entire gene. Our computer simulations demonstrate that this test is more powerful than the SNP-based test, offers effective control of the type 1 error rate regardless of gene size and linkage-disequilibrium pattern among markers, and does not need permutation or simulation to evaluate empirical significance. Its statistical power in simulated data is at least comparable, and often superior, to that of several alternative gene-based tests. When applied to real genome-wide association study (GWAS) datasets on Crohn disease, the test detected more significant genes than SNP-based tests and alternative gene-based tests. The proposed test, implemented in an open-source package, has the potential to identify additional novel disease-susceptibility genes for complex diseases from large GWAS datasets.
Introduction
Genome-wide association studies (GWASs) are being used for identification of susceptibility loci for complex diseases.1 These studies typically use the single nucleotide polymorphism (SNP) as the basic unit of analysis, which is a convenient strategy and has led to the discovery of many important genetic loci for human diseases.2 However, the statistically significant variants detected so far explain only a modest proportion of the total variance in liability to disease, and inadequate statistical power is likely to have contributed to the failure to detect true effects.3,4 The problem of statistical power is exacerbated by the necessity of adopting stringent p value thresholds for significance (typically 5 × 10⁻⁸) in order to control false-positive association from the large number of SNPs tested. In addition, many significant SNPs are likely to represent surrogate markers in linkage disequilibrium (LD) with the variants causing diseases, and differences in LD patterns across populations can lead to nonreplication of the same SNP in another population but significant association for some other surrogate SNPs.5
Shifting from SNP-based association analysis to gene-based analysis is one possible way to improve the power of GWASs. In a gene-based analysis, one jointly analyzes all variants within a putative gene to obtain a single p value representing the significance of association of the entire gene. Analysis using the gene as the basic unit has several attractive features. First, the gene is the functional unit of the human genome. Unlike genetic variants that have different allele frequencies, LD structure, and heterogeneity across diverse human populations, the gene itself is highly consistent across populations.6 Gene-based analysis might therefore lead to more consistent results and alleviates difficulties in replication. Second, gene-based analysis reduces the multiple-testing burden substantially; it requires correction for approximately 20,000–30,000 genes rather than potentially millions of SNPs. Finally, with the gene as the unit of analysis, extension of the findings to further functional analyses, such as protein-protein interactions (PPIs) and biological pathways, is more straightforward. The integration of association evidence and functional information might facilitate the unraveling of the pathogenic mechanisms of complex diseases.
A number of gene-based association tests have been proposed. Linear regression (for quantitative traits) and logistic regression (for binary traits) are straightforward methods of evaluating the overall association between a gene and a trait. In these tests, all the SNPs or haplotypes in the gene are entered as predictor variables simultaneously, except for redundant SNPs, whose inclusion would result in collinearity.6 However, a simple regression analysis might suffer from low statistical power if many SNPs or haplotypes are included, resulting in a test with many degrees. Many methods reduce the dimensionality of the test by compressing the information in the multiple correlated SNPs, for example by Fourier transformation,7 principal-components analysis,8,9 the use of fixed SNP weights based on the LD pattern across the gene,10 and cluster analysis.11 All these regression-based methods require the availability of the raw, individual phenotype and genotype data.
Methods involving the combination of the SNP-based test statistics or p values have also been proposed. The largest test statistic from all the SNP-based tests in a gene has been proposed as a gene-based test statistic.12 However, the value of this statistic is expected to be positively correlated with the number of SNPs in the gene, and although adjustment for gene size by a permutation procedure is possible, this is time consuming for large datasets.12 Another possible method is to combine the p values of the SNPs in a gene by Fisher's combination test.13 However, this method assumes that the constituent p values should be based on independent tests, which is unlikely to be true for SNPs in the same gene. Violation of this assumption is likely to inflate the type I error rate, unless use of a permutation procedure provides empirical statistical significance. A variant of the Fisher's method is the truncated-product p value method,14 which was originally developed to deal with “publication bias” in meta-analysis.15 However, like the Fisher's combination method, this test is also sensitive to LD among the SNPs in a gene and therefore requires a permutation procedure if an empirical p value is to be obtained. Instead of permutation, which requires raw genotype data, a recent variation of the Fisher's combination test uses a simulation approach based on normal variables with correlations that are assigned values according to the LD structure between SNPs.16 The p values of this method are highly correlated with those obtained from a permutation procedure. The simulation method, although faster than permutation, is still computationally intensive when applied to genome-wide datasets.
A separate issue for the design of gene-based tests is the possibility of improving the power of the test by imposing weights on the SNPs according to prior information on their likely relative importance. The idea of p value weights was introduced in the context of a sequential step-down test for maintaining the family-wise type 1 error rate17 and was subsequently incorporated into a false-discovery rate (FDR) procedure.18 A procedure for assigning prior p value weights based on a mixture model for p values has been suggested.19 Indeed, given the observed p values, it is possible to optimize the choice of p value weights to be applied to tests grouped by prior information.20 However, because the observed dataset might contain limited information, it might be desirable to also make use of established functional information and prior data in the assignment of p value weights.
In this paper, we propose a rapid gene-based association test that uses extended Simes procedure (GATES) to assess the gene-level statistical association significance that can efficiently handle results based on millions of SNPs (possibly from imputation and meta-analysis) in the later stages of GWASs and next-generation sequencing studies. This test can rapidly combine the p values of SNPs within a gene, without relying on raw, individual phenotype and genotype data, to produce valid gene-based p values. This gene-based test can also incorporate functional information on SNPs by the use of prior weights to increase statistical power. After introducing the test, we present a series of computer simulations that are useful in investigating the test's type 1 error rate, and we compare the test's statistical power with that of alternative gene-based tests. To assess its performance in real datasets, we applied the method to GWAS data on Crohn disease (CD [MIM 266600]).
Material and Methods
Construction of Gene-Based-Association p Value
We assume that a test of association between the disease and each of the available SNPs within a gene has been carried out and that the resulting p values and pair-wise correlation coefficients r for all the SNPs are available. The proposed method, GATES, a modification of the Simes test, combines these available p values to give a gene-based p value. Let p(1), …, p(m) be the ascending p values of m SNPs within a gene. We propose combining the m SNP-based p values to obtain an overall p value for the gene as follows:
where me is the effective number of independent p values among the m SNPs and me(j) is the effective number of independent p values among the top j SNPs. The null hypothesis of this gene-based test is that no SNP within the gene is associated with the disease, whereas the alternative is that at least one SNP in the gene is associated with the disease.
In the test proposed above, we used a measure that is more robust than those currently available21–24 (unpublished data) to obtain . The value of is estimated to be equal to , where I(x) is an indicator function and is the ith eigenvalue of the p value correlation coefficient matrix of SNP-based statistic tests. The negative eigenvalues are set as zero and ignored. Negative eigenvalues should only arise in the presence of missing data, and they are usually relatively few in number and close to zero.21 When the SNPs are independent, the eigenvalues are all 1, so that me is equal to the number of SNPs. When all the SNPs are in complete LD, the first eigenvalue is equal to the number of SNPs and the rest are 0, so that me = 1. For intermediate situations, we have performed simulation and permutation studies (see below) to show that the formula also provides an appropriate effective number of SNP p values and that will thus have an approximate uniform (0,1) distribution.18,25
For a simple case-control study, the pair-wise SNP p value correlation coefficient ρ is expected to be mainly determined by the pair-wise LD between the two corresponding SNPs, as measured by the allelic correlation coefficient r, although it could also be influenced by the allele frequencies of the two SNPs and the numbers of cases and controls in the study. We explored the relationship ρ and r, for different allele frequencies and sample sizes, empirically by simulation. Genotype data of two biallelic SNPs were simulated for 1,500 cases and 1,500 controls, for a particular set of values of r and allele frequencies, under Hardy-Weinberg equilibrium. We then performed an allelic association test for each of the two SNP to obtain two p values. Repeating this procedure 100,000 times resulted in 100,000 sets of p values, from which the correlation coefficient of the p values of the two SNPs,ρ, was calculated. We increased the allele frequencies and r in steps of 0.05 from their minimum to their maximum values to generate a series of data points. It turned out that the p value correlation coefficient ρ could be accurately approximated by a sixth-order polynomial function of the pair-wise allelic correlation coefficient r (coefficient of determination R2 = 0.9986), regardless of allele frequencies (see Figure 1). Repeated simulations using samples of different sizes and quantitative traits (analyzed by linear regression) also yielded the same polynomial approximation.
Figure 1.
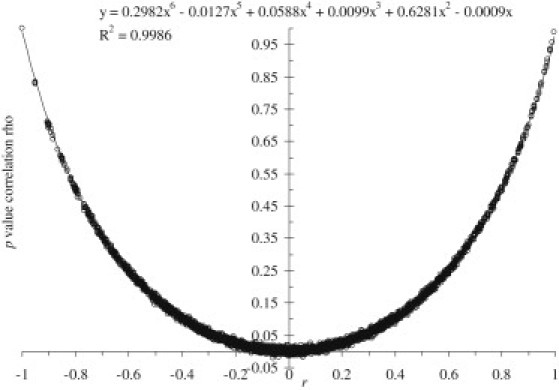
The Relationship between LD r and Correlation Coefficient of p Values by Curve Fitting
The gene-based test can be further extended to incorporate differential SNP weights as follows:
where w(1), …, w(m) are non-negative and sum to me. These weights are calculated from prior weights r(1), …, r(m), set according to the relative functional importance of the SNP to non-negative values but otherwise unconstrained. The procedure takes in turn the sorted SNPs, according w(i) = c(me(i) − me(i-1))r(i), where me(0) = 0 and c is defined such that the weights sum to me:
The use of weights is expected to increase statistical power if SNPs with higher weights are more likely to be associated with disease than SNPs with lower weights. In the absence of information, equal weights can be used.
Alternative Gene-Based Tests
We performed simulation studies to compare the type 1 error rate and statistical power of GATES with those of the following alternative gene-based tests:
-
•
Logistic regression. Each SNP is entered as an explanatory variable, coded as 0, 1, or 2 for the number of copies of the minor allele in the genotype, and case-control status is coded as the response variable. A gene-based p value is provided by the likelihood ratio test comparing the full model with all available SNPs and the null model without any SNP.
-
•
Fisher combination test. The gene-based test statistic is given by , which has a chi-square distribution with 2m degrees of freedom under the null hypothesis when the m tests are independent.26 The test is expected to be liberal for positively correlated tests, such that a permutation procedure is needed if a valid p value is to be obtained.13
-
•
Original Simes test. The gene-based p value is . For independent tests, PS is uniform (0,1) under the null hypothesis. For positively correlated tests, PS is expected to be conservative.
-
•
A versatile gene-based test for genome-wide association studies (VEGAS) proposed recently by Liu et al. (2010).16 The test allows the SNP-based chi-square test statistics within a gene to be combined in a flexible manner to give a gene-based test statistic (e.g., it can take the sum of all the statistics, or the sum of the several top statistics, or simply the largest statistic). An empirical null distribution for this gene-based test statistic is obtained through a simulation of multivariate standard normal random vectors with correlations equal to those between the SNPs in the gene; the component variables are squared to give correlated chi-square random variables, and then appropriate variables are summed as dictated by how the gene-based test statistic was calculated. In our simulations, we calculated two versions of the test, one based on the sum of all the SNP-based chi-square statistics in the gene (VEGAS-Sum) and one based on just the largest statistic (VEGAS-Max).
Note that only logistic regression requires the raw phenotype and genotype data, whereas the other tests require only the SNP-based p values. However, a permutation procedure, which is necessary to ensure the correct type 1 error rates for the Fisher and original Simes tests when the SNPs are correlated, also requires the raw data. The VEGAS method does not require raw data but instead requires only the correlation matrix of the SNPs.
Simulation Studies of Type 1 Error Rate and Statistical Power
The simulation involved the generation of genotype data on 30 SNPs, which were all biallelic and under Hardy-Weinberg equilibrium. We considered three different scenarios in terms of LD structure: (1) the SNPs are situated in six strong LD blocks (see Table S1), (2) the SNPs are situated in six moderate LD blocks (see Table S2), or (3) the SNPs are in linkage equilibrium. Given the LD pattern and the allele frequencies of the 30 SNPs, we used a program based on the HapSim algorithm27 to generate genotype data. We then considered three different scenarios in terms of gene size: (1) a three-SNP gene containing the first three SNPs, (2) a ten-SNP gene containing the first ten SNPs, and (3) a 30-SNP gene containing all 30 SNPs. Finally, we considered three scenarios in terms of disease model: (1) a null model where no SNP has any effect on disease risk, (2) an additive model where one SNP in each LD block has a minor allele that increases the risk ratio additively by 0.14, and (3) a multiplicative model where one SNP in each LD block has a minor allele that increases the risk ratio multiplicatively by a factor of 1.14 (see Tables S1 and S2).28 Because three-SNP, ten-SNP, and 30-SNP genes contain one, two, and six LD blocks, respectively, the number of susceptibility SNPs they contain are correspondingly one, two, and six. The baseline risk corresponding to the absence of any risk-increasing alleles is calculated from the allele frequencies and risk ratios of the susceptibility SNPs and gives a population disease prevalence of 0.1. For each combination of scenarios, a population of 1,000,000 individuals was generated. A random sample of 1500 cases and 1500 controls was drawn, without replacement, from the population and subjected to the different methods of gene-based association. Type 1 error rates and statistical power estimates under the different scenarios were obtained from the proportion of simulated datasets, out of 1,000 simulated populations, that resulted in significant p values (set at 0.05).
Impact of Weighting on Type 1 Error Rates and Statistical Power
To evaluate the impact of weighting the SNPs in the construction of the gene-based test, we assigned some SNP with a high weight (wi > 1) and the others with a low weight (0 < wi < 1) in simulated data generated as described above. We considered two scenarios of weight assignment: (1) the SNPs assigned to have the high weight are the true susceptibility SNPs, whereas the SNPs assigned to have the low weight have no direct causal effect, and (2) the assignment of weight is random. Although the first scenario is expected to increase statistical power, the latter scenario is expected to have no effect or to result in reduced statistical power. Although random assignment is not the worst possible scenario, it might be the worst that is likely to occur in real data analyses. We also varied the ratio of high to low weights from 1 to 16 to see the impact on type 1 error rates and statistical power.
Genome-wide Type 1 Error Rates under Realistic LD Patterns
The above evaluation of type 1 error rates in simulation was based on arbitrary LD structure and might not represent realistic examples of the actual LD structure of genes in real populations. In order to assess the genome-wide type 1 error rates under realistic situations, we calculated the various gene-based test statistics for genotype data from a real GWAS, where the phenotypes were reassigned at random. The real GWAS data used were on a sample of 2514 Chinese subjects typed by the Illumina Human610-Quad BeadChip from projects in Hong Kong with Institutional Review Board approval. After standard quality-control procedures, 473,931 SNPs were left for analysis; among these, 209,784 SNPs were in 23,672 genes. SNP-based association analysis was carried out with a genotypic association test in Plink.29 Two LD datasets from different sources were prepared: the pair-wise r-squares estimated through Plink29 from the genotype data of the actual case-control sample and the r-squares from the latest HapMap LD dataset (CHB panel) released on April 19, 2009. We used GATES to combine SNP-level p values to obtain gene-based p values. We assessed type 1 error rates for the gene-based tests by examining the proportion of genes for which the gene-based p value is lower than various threshold values (0.05., 0.01, 0.001, 0.0001). In addition, we used a quantile-quantile (Q-Q) plot to compare the overall distribution of the gene-based p values to a uniform (0,1) distribution.
Application to GWASs
To further evaluate the performance of GATES under realistic situations, we used it to reanalyze the data from a published meta-analysis of three CD GWASs with a total of 3,230 cases and 4,829 controls.30 We used the r-square values from the HapMap CEU sample to adjust for marker dependency. Prior to applying GATES, we subjected the SNP-based p values to genomic control correction31 to avoid inflated significance levels. SNPs were mapped onto genes according to the gene coordinate information from NCBI. SNPs within 5 kilobase pairs of each gene were also assigned into the gene. In the very rare case where a SNP was in the overlapping region of two genes, the SNP was assigned into both genes. We compared the results of the SNP-based tests, the original Simes test and GATES, in terms of the number of significant hits after Bonferroni correction.
Results
Simulation Studies of Type 1 Error Rate and Statistical Power
The empirical type 1 error rates and statistical powers of GATES and the five alternative methods at a nominal type 1 error rate (α) of 0.05 are given in Table 1. When the markers within a gene are independent, the empirical type 1 error rates of all tests are approximately 0.05. For dependent markers, however, the Fisher combination test is a liberal test with an inflated type 1 error rate. In contrast, the original Simes test becomes conservative for a gene with multiple SNPs in strong LD. The type 1 error rates of the other five tests (including the one we propose) are all correct regardless of the marker dependency.
Table 1.
Empirical Type 1 Errors and Power of Alternative Approaches (in percentage)
| #SNP (#DSL) | Logistic Regression | Fisher | VEGAS –Sum | Original Simes | VEGAS −Max | GATES | |
|---|---|---|---|---|---|---|---|
| LE | |||||||
| Error Rate (no disease) | 3(0) | 4.66 | 4.67 | 4.70 | 4.61 | 4.62 | 4.61 |
| 10(0) | 5.10 | 5.00 | 5.04 | 5.06 | 5.07 | 5.06 | |
| 30(0) | 5.26 | 4.96 | 4.97 | 4.97 | 5.04 | 4.97 | |
| Power (additive model) | 3(1) | 43.71 | 41.79 | 42.67 | 45.28 | 45.22 | 45.28 |
| 10(2) | 56.88 | 53.32 | 54.56 | 54.76 | 54.00 | 54.76 | |
| 30(6) | 65.32 | 61.5 | 63.28 | 47.18 | 45.62 | 47.18 | |
| Power (multiplicative model) |
3(1) | 46.61 | 44.72 | 45.54 | 48.39 | 48.3 | 48.39 |
| 10(2) | 69.00 | 65.25 | 66.88 | 67.00 | 66.26 | 67.00 | |
| 30(6) | 93.45 | 91.44 | 92.28 | 82.21 | 80.18 | 82.21 | |
| Moderate LD | |||||||
| Error Rate (no disease) | 3(0) | 4.86 | 7.17 | 4.91 | 4.54 | 4.81 | 4.98 |
| 10(0) | 4.88 | 9.8 | 4.83 | 4.55 | 4.92 | 5.00 | |
| 30(0) | 5.63 | 11.09 | 5.03 | 4.97 | 5.29 | 5.56 | |
| Power (additive model) | 3(1) | 44.59 | 55.8 | 49.36 | 49.71 | 50.51 | 51.23 |
| 10(2) | 56.25 | 72.38 | 61.36 | 58.93 | 59.12 | 60.72 | |
| 30(6) | 65.47 | 83.04 | 71.96 | 53.29 | 52.24 | 55.65 | |
| Power (multiplicative model) |
3(1) | 46.52 | 57.5 | 50.98 | 51.19 | 52.00 | 52.65 |
| 10(2) | 68.42 | 81.73 | 72.48 | 70.66 | 70.9 | 72.4 | |
| 30(6) | 93.68 | 98.04 | 95.59 | 86.07 | 84.34 | 87.52 | |
| Strong LD | |||||||
| Error Rate (no disease) | 3(0) | 4.96 | 11.49 | 5.23 | 3.88 | 5.22 | 5.35 |
| 10(0) | 5.33 | 15.68 | 4.84 | 3.37 | 4.88 | 5.34 | |
| 30(0) | 5.57 | 17.9 | 4.89 | 3.38 | 4.89 | 5.64 | |
| Power (additive model) | 3(1) | 45.03 | 72.29 | 58.81 | 53.88 | 58.2 | 60.43 |
| 10(2) | 57.2 | 89.82 | 75.74 | 66.39 | 71.71 | 74.3 | |
| 30(6) | 65.56 | 96.04 | 86.3 | 62.84 | 66.80 | 72.75 | |
| Power (multiplicative model) | 3(1) | 47.13 | 74.28 | 60.88 | 56.28 | 60.74 | 62.77 |
| 10(2) | 68.45 | 94.41 | 84.89 | 77.14 | 80.59 | 83.00 | |
| 30(6) | 93.4 | 99.92 | 99.2 | 91.42 | 92.24 | 95.38 | |
Data are given as percentages. Abbreviations are as follows: LE, linkage equilibrium; LD, linkage disequilibrium; and DSL, disease susceptibility loci.
The statistical powers of the tests are affected by the number of disease-susceptibility loci (DSL) and the marker dependency. When the markers are independent and there are only 1 or 2 susceptibility loci (i.e., in the case of the three-SNP or ten-SNP gene), all the tests have approximately equal power to identify the susceptibility genes. When a gene has 30 SNPs and six susceptibility loci, the most powerful tests are those that combine the evidence from all the SNPs in an additive manner, i.e., logistic regression, Fisher's combination, and VEGAS-Sum (see Table 1). GATES has power comparable to that of the VEGAS-Sum test in the three-SNP and ten-SNP scenarios, but it is slightly less powerful for a gene with 30 SNPs and six susceptibility loci. It is more powerful than logistic regression when the markers are in strong LD, and it is similar or superior in power to the original Simes test or the VEGAS-Max test in all situations.
The powers of the Fisher combination test with permutation, the original Simes test with permutation, and GATES are shown in Table 2. In general, all three tests have very similar powers, with a few exceptions. One of these situations is when there are six susceptibility loci (among 30 SNPs), in which case the Fisher combination test is more powerful than the other two tests. Another is when there is only one susceptibility locus among a large number (i.e., 10) of independent SNPs, in which case the Fisher combination test is less powerful than the other two tests.
Table 2.
Empirical Power of Alternative Approaches by Permutation
| #SNP (#DSL) | Permuted Fisher Combination Test | Permuted Original Simes Test | GATES |
|---|---|---|---|
| LE | |||
| 3(1) | 46.47 | 50.03 | 48.77 |
| 10(1)∗ | 27.18 | 35.29 | 33.5 |
| 10(2) | 55.72 | 56.68 | 54.78 |
| 30(1)∗ | 16.79 | 25.89 | 24.21 |
| 30(6) | 92.1 | 83.61 | 82.55 |
| Moderate LD | |||
| 3(1) | 52.89 | 55.3 | 54.18 |
| 10(1)∗ | 42.56 | 42.68 | 41.02 |
| 10(2) | 72.56 | 73.46 | 72.79 |
| 30(1)∗ | 26.36 | 29.03 | 27.95 |
| 30(6) | 95.1 | 87.21 | 87.32 |
| Strong LD | |||
| 3(1) | 62.29 | 62.45 | 62.77 |
| 10(1)∗ | 56.94 | 53.45 | 51.18 |
| 10(2) | 86.02 | 83.61 | 83.88 |
| 30(1)∗ | 38.78 | 39.48 | 38.44 |
| 30(6) | 99.18 | 94.56 | 95.22 |
Powers are given as percentages. Abbreviations are as follows: LE, linkage equilibrium; LD, linkage disequilibrium; and DSL, disease susceptibility loci. An asterisk indicates that only the first locus in each LD block was assumed as a disease susceptibility locus.
Impact of Weighting on Type 1 Error Rates and Statistical Power
The use of weights does not lead to an inflated type 1 error rate for GATES (see Figure 2). However, weight setting can have substantial effects on statistical power. When the SNPs are independent or in moderate LD, the assignment of relatively high weights to the true susceptibility SNPs can substantially increase the power of the gene-based test (see Figure 2). The bigger the difference between the high and the low weights, the greater the power gain. However, the assignment of high weights to nonpredisposing SNPs can decrease power; bigger differences between high and low weights leads to greater power loss. Fortunately, the power loss is generally much less than the potential power gain that can result from favorable weight setting for genes. For example, when the high:low weight ratio is 3, the randomly assigned weights result in only 2% power loss for the scenario with one susceptibility locus among ten independent SNPs in the gene, whereas a favorable weight assignment would result in more than a 10% increase in power in the same situation. However, this pattern does not seem applicable to the gene with three SNPs in strong LD; in that case, the power loss due to random weighting might be larger than the power gain when the ratio of high to low weight is large. Actually, when all SNPs are in strong LD, the effective number of p values will approach 1, and the higher weight will be also close to 1 so that the type 1 error can be controlled. Hence, the favorable weight will only have a slight effect on the SNPs p values and thus on the power of the statistic test. Anyway, according to the empirical simulation, a high:low weight ratio less than 5 seems preferable because the power loss due to the random weights is trivial, at least across the scenarios we have tested, whereas the power gain as a result of corrected weight can be substantial.
Figure 2.
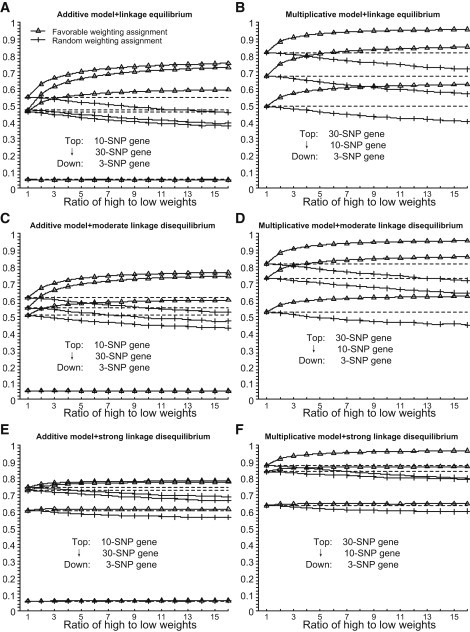
Empirical Type 1 Error and Power of the Weighted Gene-Based Test
(A) Additive mode and independent SNPs.
(B) Multiplicative mode and independent SNPs.
(C) Additive mode and SNPs in moderate LD.
(D) Multiplicative mode and SNPs in moderate LD.
(E) Additive mode and SNPs in strong LD.
(F) Multiplicative mode and SNPs in strong LD. The high weights are assigned to the true susceptibility SNPs (i.e., the favorable weight setting) or are just randomly assigned to any SNPs within the gene (i.e., the random weight setting).
Error lines in the (B), (D), and (F) are omitted because they are identical to those in (A), (C), and (E), respectively.
Genome-wide Type 1 Error Rates under Realistic LD Patterns
In the simulation study with real genotypes and permuted phenotypes from an actual GWAS dataset, GATES does not show inflation of type 1 error rates across all genes at the α levels of 0.05, 0.01, 0.001, and 0.0001, regardless of the number of SNPs in the gene (see Table 3). The use of LD derived from the current GWAS dataset or from HapMap CHB data leads to similar results (Table 3). The Pearson correlation coefficient between the two sets of gene-based p values was 0.997. An examination of the QQ plot of the p values of all genes, genes with three or fewer SNPs, and genes with more than three SNPs reveals no deviation from a uniform (0,1) distribution (Figure 3).
Table 3.
Proportion of Rejected Null Hypotheses Given the Nominal Type 1 Error in a Real GWAS Dataset when the Phenotype Is Permuted at Random
| Nominal Type I Error | ||||
|---|---|---|---|---|
| 0.05 | 0.01 | 0.001 | 0.0001 | |
| Actual LD | ||||
| PG | 5.27E−2 | 1.11E−2 | 1.01E−3 | 1.27E−4 |
| PG (3 or less SNP) | 5.08E−2 | 1.01E−2 | 1.14E−3 | 8.75E−5 |
| PG (over 3 SNP) | 5.44E−2 | 1.20E−2 | 8.99E−4 | 1.63−4 |
| HapMap CHB LD | ||||
| PG | 5.29E−2 | 1.12E−2 | 1.01E−3 | 1.27E−4 |
| PG (3 or less SNP) | 5.06E−2 | 9.97E−3 | 1.14E−3 | 8.75E−5 |
| PG (over 3 SNP) | 5.51E−2 | 1.23E−2 | 8.99E−4 | 1.63−4 |
The proportions are subject to sampling variation.
Figure 3.
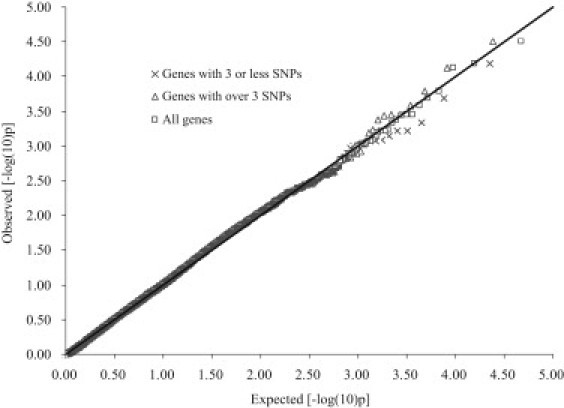
Q-Q Plot of Gene-Based p Values in Real Data under the Null Hypothesis
The gene-based p values calculated from SNP-based p values for a real GWAS dataset in which disease status has been randomly assigned to individuals; the calculation assumed LD statistics calculated from the GWAS dataset itself.
Application to Genome-wide Association Dataset on CD
GATES was implemented in an open-source tool named Knowledge-Based Mining System for Genome-wide Genetic Studies (KGG), which was used for analysis of the SNP-based p values for CD. The program took less than 2 min to perform a whole-genome scan for the dataset on an ordinary desktop computer with Intel Core 2 CPU 2.66G Hz, RAM 1.97 GB, and 32-bit Windows XP Professional Version 2002.
There was an overall inflation of SNP-based p values (genomic control λ 1.1586) in the Meta-analysis dataset on CD. Barrett et al. (2008)30 argued that, given the large sample size (3,230 CD cases and 4,829 controls), the overall inflation was modest and would not introduce spurious differences between cases and controls. Nevertheless, we adjusted the SNP-based p values by the genomic control inflation factor31 to reduce potential false positives. In the dataset, 311,638 (49.09%) SNPs were assigned to be within one or more of 23,974 genes. The numbers of significant p values for the SNP-based test, the original Simes test, and GATES at three levels of family-wise significance are shown in Table 4. GATES detected more significant genes than the original Simes test or SNP-based test. At the family-wise error rate of 0.05, GATES detected five more significant genes than the SNP-based p values alone. All significant genes according to SNP-based p values were also significant by the original Simes test. The extended Simes test reported two more significant genes, MST1 [MIM 142408] and BSN [MIM 604020], than the original Simes test; the other genes were significant for both tests. MST1 was convincingly replicated in independent samples by Barrett et al. (2008).30 Recent studies also support a contribution from BSN32,33 to CD. At the family-wise error rate of 0.1, GATES detected five more significant genes than the SNP-based p values. Among these five genes, Barrett et al. (2008)30 successfully replicated ITLN1 [MIM 609873], and there is also support for TNFSF15 [MIM 604052] as a candidate gene involved in CD.34–36 In a recent genome-wide meta-analysis of CD in a larger sample, the susceptibility of the four genes was reconfirmed.37 The significant genes (FWER ≤ 0.1) and their SNPs are detailed online in the Table S3.
Table 4.
The Number of Genes Passing the p Value Thresholds
| Family-wise Error Rate | SNP p Value | Original Simes Test | GATESa |
|---|---|---|---|
| 0.01 | 17 (3.21E−8) | 17 (4.172E−7) | 19 |
| 0.05 | 22 (1.60E−7) | 25 (2.09E−6) | 27 |
| 0.1 | 22 (3.21E−7) | 30 (4.17E−6) | 32 |
The p value thresholds are identical to those in the left column and are omitted.
Using the Gene-Based Test to Guide Replication Studies
After a genome-wide gene-based scan, the next practical issue is how to use the results to guide follow-up replication studies. A straightforward strategy is to prioritize genes on the basis of their p values and then select the SNPs with the smallest p values within each prioritized gene for replication. We conceptually validated this idea by using the released replication results in Table S2 of Barrett et al. (2008)30 for CD. There were 23 SNPs with a significant replication p value < 3.85E−4 (= 0.05/130) among the 130 SNPs in their Table S2. These SNPs could be mapped onto 19 known genes. In 13 of these 19 genes, the same SNP was the most significant SNP within the gene in both the original Meta-analysis and the independent replication study (see Table S4 online), suggesting that choosing the most significant SNP within each selected gene is usually optimal. However, functional considerations are also potentially relevant for SNP selection. The most significant SNPs of two genes (IL23R [MIM 607562] and RTEL1 [MIM 608833]) in the Meta-analysis later were surpassed in the replication study by other SNPs in the same gene with greater functional significance. For IL23R, the most significant SNP in the replication study is rs11209026, a missense variant. For RTEL1 [MIM 608833], it is rs2297441, a variant in utr-3. Interestingly, rs2297441 is also mapped onto a miRNA binding site of RTEL1 in Sanger's miRBase.
Discussion
The proposed gene-based test, GATES, is a Simes test extension that is valid for correlated SNPs and capable of incorporating previously assigned functional weights of the SNPs in the gene. The test does not require the raw genotype or phenotype data as inputs but requires only the SNP-based p values and SNP-SNP correlations, and it need not assume that all SNPs of a gene have the same direction of effect. It is also very fast because there is no need for permutation or simulation. GATES can handle millions of SNPs in less than 10 min, which makes it convenient for post-GWAS analyses, especially for the huge datasets that are being generated by genome-wide meta-analyses38 and imputation,39,40 as well as by next-generation sequencing technology,41 although it will lack power for rare variants. We have shown GATES to have correct type 1 error rates in both simulated and permuted datasets, regardless of the number of typed SNPs in the gene or LD structure. We have also shown that it is similar in statistical power to alternative gene-based tests that require permutation or simulation.12,16,42 Furthermore, we have shown that the power of the test can be improved by the appropriate assignment of differential prior weights to the SNPs within a gene.
In the present study, we made a systematic comparison between several simple and efficient methods of combining p values to guide gene-level association studies. These tests can be generally categorized into two groups, ones simultaneously combining all SNPs and others mainly focusing on the best SNPs. The first group includes the logistic regression method, Fisher combination test (adjusted by permutation), and the VEGAS-Sum test proposed by Liu et al.16; tests belonging to the second group are the Simes test, the VEGAS-Max test proposed by Liu et al. ,16 and GATES in the present study. The first group of tests are generally more powerful for detecting a gene with multiple independent DSL, whereas the second group of tests can work better when a gene has only one or a few independent DSL. In addition, the performance of the first group of tests is more sensitive to the number of neutral SNPs within a gene. That is, they can be much less powerful than the second group of tests for detecting a large gene with many typed SNPs but only a few truly associated ones. Interestingly, the presence of LD invalidates only the Fisher combination test and tends to increase the statistical power of the other tests, except for logistic regression, which has the same power regardless of LD. As a result, logistic regression is more powerful than other tests when the SNPs in the gene are uncorrelated but less powerful when the SNPs are in LD. Among the second group of tests, GATES has comparable power but is much faster than the best-SNP test proposed by Liu et al.16 and can be more powerful than the original Simes test when the SNPs within a gene are in strong LD.
GATES could be less powerful than the permutation-based Fisher combination test and the simulation-based summation statistic test proposed by Liu et al.16 when it comes to detecting a gene that is of small or moderate size but that includes quite a few (say, five or more) independent DSL. However, to the best of our knowledge, this would be a rare scenario in real datasets. Instead, it is probably more usual for a gene to contain only one or two independent DSL, in which case the power of GATES to detect a susceptibility gene is similar to that of the permutation-based Fisher combination test and the simulation-based summation statistic test proposed by Liu et al.16 Moreover, the methods based on summation of SNP-based statistics also have their own weakness, in that they are less powerful for detecting a large gene with many typed SNPs that do not have a true effect. Therefore, when we are uncertain about the true pattern of association in a gene, it might be reasonable to adopt GATES because computation is fast and convenient.
The construction of prior weights is still an open question. There is no guarantee that true susceptibility SNPs will always be assigned high or favorable weighs because we do not yet have full understanding of the relationship sequence and function to allow us to accurately predict the functional consequences of a sequence change. One potentially useful resource for weight construction is the Catalog of Published GWAS.43 In comparison to SNPs randomly selected from genotyping arrays, trait/disease-associated SNPs (TASs) were significantly overrepresented only in nonsynonymous sites (odds ratio [OR] = 3.9 (2.2–7.0), p = 3.5E−7] and 5 kb promoter regions (OR = 2.3 (1.5–3.6), p = 3E−7)]; however, they were not overrepresented in introns, although 88% of TASs collected through December 31, 2008 in the Catalog of Published GWAS were intronic. Nicolae et al. found that TASs were more likely to be expression quantitative trait loci (eQTL), and the eQTL information can be used to enhance discovery of trait-associated SNPs for complex phenotypes.44 Hence, it might be possible to construct the prior weights for each SNP on the basis of the ORs associated with their genomic annotations. However, many of the GWAS hits are likely to represent indirect associations, and the sequence at the associated SNP itself might therefore be of no significance. Moreover, different classes of diseases (e.g., neurological diseases and immunological diseases) might have different distributions of the enrichment across various categories. If this is true, weights that are specific to a disease, or a disease class, might be more effective. Unfortunately, the number of available GWAS hits is still too limited to allow stable estimates even for a class of diseases, not to mention an individual disease. As the number of GWAS hits increases, this obstacle will diminish. Anyhow, as we have shown in our simulation, the power gain resulting from a favorable weight setting in GATES is expected to be greater than the power loss resulting from an arbitrary weight setting, especially when the ratio of high to low weight is <5. Therefore, the use the prior weights to evaluate gene-based association may be worthwhile when it is feasible to generate reliable weights.
The statistically valid gene-level p values attained with GATES can facilitate in-depth bioinformatics analysis because it is usually more appropriate to take the entire gene (rather than individual SNPs) as a basic analysis unit. The evaluation of association at the gene level nicely avoids the difficulties in processing the evidence from numerous dependent SNPs in biological pathways or networks. On the basis of these gene-level p values, many Bioinformatics methods45 originally developed for gene-set enrichment analysis of microarray expression data could be readily adopted for the functional analysis of GWAS hits. A common basic assumption of the enrichment analysis is that genes responsible for the same diseases tend to be distributed within the same biological modules.46 Such an assumption implies that many disease susceptibility genes might not function alone but could be connected to each another in one or more biological modules. A module can be a protein complex,47 a pathway,48 or a subnetwork of PPIs.49 Within a module, unknown underlying disease-susceptibility genes could be predicted on the basis of some known ones. The coexistence of multiple significantly associated genes within the same biological modules could, in turn, strengthen the evidence of the involvement of the modules in the development of disease.50–52 More importantly, the biological modules could also aid our understanding of the pathogenic mechanisms of the disease and therefore suggest novel targets for drug development. The strategy of integrating multiple bioinformatics resources into genetic analysis is a promising and important trend for genetic studies in the near future.
An advantage of GATES is that it can use LD information from a known reference population (e.g., HapMap), and it therefore can be used even when individual genotype information on the study sample is not available, as long as the SNP-based p values are accessible. The method behaves well when the reference population matches closely with the actual study population. For example, using the LD information from HapMap Chinese reference sample on the SNP-based p values of a permuted Chinese dataset gave the correct type 1 error rate (Table 3), and the gene-based p values correlated highly (r = 0.997) with gene-based p values obtained from an analysis where LD is obtained from the genotype data of the actual study sample. However, if the reference population does not match well with the study population, then the type 1 error rate will be affected. If the reference population has a generally higher level of LD than the actual study population, then the will be underestimated, and the gene-based test will tend to be liberal. Conversely, if the reference population has a generally lower level of LD than the actual study population, then the will be overestimated, and the gene-based test will tend to be conservative. One problematic scenario is when the SNP-based p values have been obtained from a meta-analysis of multiple populations with differing LD structures. In practice, apart from African populations and population isolates, most outbred populations such as Europeans and Asians have rather similar levels of LD, and when the type 1 errors of the gene-based tests for these populations are calculated from HapMap reference samples, they are unlikely to be grossly inflated or deflated.
In principle, one can apply this method to combine the SNP p values of genes within a pathway to produce a pathway-based p value. However, the complex structure of pathways might make it more difficult to interpret the results. A single highly significant SNP p value within a pathway might lead to a significant pathway p value. If the gene containing this SNP is only involved in a single pathway, then this would suggest that this pathway is important. However, because a gene can belong to multiple pathways and a large pathway can contain multiple small pathways, it might be difficult to clearly identify which pathways are involved in disease etiology.
A gene-based test can obviously only cover SNPs within and near to genes, and although genes are the most interesting regions of genome, it is certain that some intergenic SNPs are still of functional significance, for example in altering the expression of genes at a distance. We suggest that a gene-based analysis should be complemented by SNP-based tests of SNPs outside of genes, so that the entire genome is exhaustively explored for all possible association signals. We have implemented this strategy in KGG, which is a standalone tool with graphic interface. It can read SNP p values by any statistic tests and LD information from various sources to perform a gene-based test. In addition, supported by multiple integrated bioinformatics databases, KGG can also use the generated gene-based p values to explore biological pathways and PPI networks.
Acknowledgments
We are grateful to Mark J. Daly for sharing data on CD.30 This work was funded by Hong Kong Research Grants Council GRF HKU 774707, the European Community's Seventh Framework Program under grant agreement No. HEALTH-F2-2009-241909 (Project EU-GEI), the Small Project Funding HKU 201007176166, and The University of Hong Kong Strategic Research Theme on Genomics. We also thank two anonymous reviewers for their useful comments, which improved this paper significantly.
Supplemental Data
Web Resources
The URLs for data presented herein are as follows:
The Catalog of Published Genome-Wide Association Studies, http://www.genome.gov/gwastudies
Gene coordinates information from NCBI, ftp://ftp.ncbi.nlm.nih.gov/genomes/MapView/Homo_sapiens/sequence/BUILD.36.3/updates/seq_gene.md.gz
HapMap, http://www.hapmap.org/
KGG website, http://bioinfo.hku.hk/kggweb/
Online Mendelian Inheritance in Man (OMIM), http://www.ncbi.nlm.nih.gov/omim
Sanger's miRBase, http://microrna.sanger.ac.uk/
References
- 1.McCarthy M.I., Abecasis G.R., Cardon L.R., Goldstein D.B., Little J., Ioannidis J.P., Hirschhorn J.N. Genome-wide association studies for complex traits: Consensus, uncertainty and challenges. Nat. Rev. Genet. 2008;9:356–369. doi: 10.1038/nrg2344. [DOI] [PubMed] [Google Scholar]
- 2.Manolio T.A., Brooks L.D., Collins F.S. A HapMap harvest of insights into the genetics of common disease. J. Clin. Invest. 2008;118:1590–1605. doi: 10.1172/JCI34772. [DOI] [PMC free article] [PubMed] [Google Scholar]
- 3.Altshuler D., Daly M. Guilt beyond a reasonable doubt. Nat. Genet. 2007;39:813–815. doi: 10.1038/ng0707-813. [DOI] [PubMed] [Google Scholar]
- 4.Frazer K.A., Murray S.S., Schork N.J., Topol E.J. Human genetic variation and its contribution to complex traits. Nat. Rev. Genet. 2009;10:241–251. doi: 10.1038/nrg2554. [DOI] [PubMed] [Google Scholar]
- 5.Kraft P., Zeggini E., Ioannidis J.P. Replication in genome-wide association studies. Stat. Sci. 2009;24:561–573. doi: 10.1214/09-STS290. [DOI] [PMC free article] [PubMed] [Google Scholar]
- 6.Neale B.M., Sham P.C. The future of association studies: Gene-based analysis and replication. Am. J. Hum. Genet. 2004;75:353–362. doi: 10.1086/423901. [DOI] [PMC free article] [PubMed] [Google Scholar]
- 7.Wang T., Elston R.C. Improved power by use of a weighted score test for linkage disequilibrium mapping. Am. J. Hum. Genet. 2007;80:353–360. doi: 10.1086/511312. [DOI] [PMC free article] [PubMed] [Google Scholar]
- 8.Gauderman W.J., Murcray C., Gilliland F., Conti D.V. Testing association between disease and multiple SNPs in a candidate gene. Genet. Epidemiol. 2007;31:383–395. doi: 10.1002/gepi.20219. [DOI] [PubMed] [Google Scholar]
- 9.Wang K., Abbott D. A principal components regression approach to multilocus genetic association studies. Genet. Epidemiol. 2008;32:108–118. doi: 10.1002/gepi.20266. [DOI] [PubMed] [Google Scholar]
- 10.Li M., Wang K., Grant S.F., Hakonarson H., Li C. ATOM: A powerful gene-based association test by combining optimally weighted markers. Bioinformatics. 2009;25:497–503. doi: 10.1093/bioinformatics/btn641. [DOI] [PMC free article] [PubMed] [Google Scholar]
- 11.Buil A., Martinez-Perez A., Perera-Lluna A., Rib L., Caminal P., Soria J.M. A new gene-based association test for genome-wide association studies. BMC Proc. 2009;3(Suppl 7):S130. doi: 10.1186/1753-6561-3-s7-s130. [DOI] [PMC free article] [PubMed] [Google Scholar]
- 12.Wang K., Li M., Bucan M. Pathway-based approaches for analysis of genomewide association studies. Am. J. Hum. Genet. 2007;81:1278–1283. doi: 10.1086/522374. [DOI] [PMC free article] [PubMed] [Google Scholar]
- 13.Curtis D., Vine A.E., Knight J. A simple method for assessing the strength of evidence for association at the level of the whole gene. Advances and Applications in Bioinformatics and Chemistry. 2008;2008:1. doi: 10.2147/aabc.s4095. [DOI] [PMC free article] [PubMed] [Google Scholar]
- 14.Yang H.C., Liang Y.J., Chung C.M., Chen J.W., Pan W.H. Genome-wide gene-based association study. BMC Proc. 2009;3(Suppl 7):S135. doi: 10.1186/1753-6561-3-s7-s135. [DOI] [PMC free article] [PubMed] [Google Scholar]
- 15.Zaykin D.V., Zhivotovsky L.A., Westfall P.H., Weir B.S. Truncated product method for combining P-values. Genet. Epidemiol. 2002;22:170–185. doi: 10.1002/gepi.0042. [DOI] [PubMed] [Google Scholar]
- 16.Liu J.Z., McRae A.F., Nyholt D.R., Medland S.E., Wray N.R., Brown K.M., Hayward N.K., Montgomery G.W., Visscher P.M., Martin N.G., Macgregor S., AMFS Investigators A versatile gene-based test for genome-wide association studies. Am. J. Hum. Genet. 2010;87:139–145. doi: 10.1016/j.ajhg.2010.06.009. [DOI] [PMC free article] [PubMed] [Google Scholar]
- 17.Holm S. A simple sequentially rejective multiple test procedure. Scand. J. Stat. 1979;6:65–70. [Google Scholar]
- 18.Benjamini Y., Hochberg Y. Multiple hypotheses testing with weights. Scand. J. Stat. 1997;24:407–418. [Google Scholar]
- 19.Genovese C.R., Roeder K., Wasserman L. False discovery control with p-value weighting. Biometrika. 2006;93:509–524. [Google Scholar]
- 20.Roeder K., Devlin B., Wasserman L. Improving power in genome-wide association studies: Weights tip the scale. Genet. Epidemiol. 2007;31:741–747. doi: 10.1002/gepi.20237. [DOI] [PubMed] [Google Scholar]
- 21.Galwey N.W. A new measure of the effective number of tests, a practical tool for comparing families of non-independent significance tests. Genet. Epidemiol. 2009;33:559–568. doi: 10.1002/gepi.20408. [DOI] [PubMed] [Google Scholar]
- 22.Gao X., Starmer J., Martin E.R. A multiple testing correction method for genetic association studies using correlated single nucleotide polymorphisms. Genet. Epidemiol. 2008;32:361–369. doi: 10.1002/gepi.20310. [DOI] [PubMed] [Google Scholar]
- 23.Moskvina V., Schmidt K.M. On multiple-testing correction in genome-wide association studies. Genet. Epidemiol. 2008;32:567–573. doi: 10.1002/gepi.20331. [DOI] [PubMed] [Google Scholar]
- 24.Nyholt D.R. A simple correction for multiple testing for single-nucleotide polymorphisms in linkage disequilibrium with each other. Am. J. Hum. Genet. 2004;74:765–769. doi: 10.1086/383251. [DOI] [PMC free article] [PubMed] [Google Scholar]
- 25.Simes R.J. An improved Bonferroni procedure for multiple tests of significance. Biometrika. 1986;73:751–754. [Google Scholar]
- 26.Fisher R.A. Twelfth Edition. Hafner; New York: 1954. Statistical methods for research workers. [Google Scholar]
- 27.Montana G. HapSim: A simulation tool for generating haplotype data with pre-specified allele frequencies and LD coefficients. Bioinformatics. 2005;21:4309–4311. doi: 10.1093/bioinformatics/bti689. [DOI] [PubMed] [Google Scholar]
- 28.Risch N. Linkage strategies for genetically complex traits. I. Multilocus models. Am. J. Hum. Genet. 1990;46:222–228. [PMC free article] [PubMed] [Google Scholar]
- 29.Purcell S., Neale B., Todd-Brown K., Thomas L., Ferreira M.A., Bender D., Maller J., Sklar P., de Bakker P.I., Daly M.J., Sham P.C. PLINK: A tool set for whole-genome association and population-based linkage analyses. Am. J. Hum. Genet. 2007;81:559–575. doi: 10.1086/519795. [DOI] [PMC free article] [PubMed] [Google Scholar]
- 30.Barrett J.C., Hansoul S., Nicolae D.L., Cho J.H., Duerr R.H., Rioux J.D., Brant S.R., Silverberg M.S., Taylor K.D., Barmada M.M., NIDDK IBD Genetics Consortium. Belgian-French IBD Consortium. Wellcome Trust Case Control Consortium Genome-wide association defines more than 30 distinct susceptibility loci for Crohn's disease. Nat. Genet. 2008;40:955–962. doi: 10.1038/NG.175. [DOI] [PMC free article] [PubMed] [Google Scholar]
- 31.Devlin B., Roeder K. Genomic control for association studies. Biometrics. 1999;55:997–1004. doi: 10.1111/j.0006-341x.1999.00997.x. [DOI] [PubMed] [Google Scholar]
- 32.Latiano A., Palmieri O., Corritore G., Valvano M.R., Bossa F., Cucchiara S., Castro M., Riegler G., De Venuto D., D'Incà R. Variants at the 3p21 locus influence susceptibility and phenotype both in adults and early-onset patients with inflammatory bowel disease. Inflamm. Bowel Dis. 2010;16:1108–1117. doi: 10.1002/ibd.21176. [DOI] [PubMed] [Google Scholar]
- 33.Márquez A., Cénit M.C., Núñez C., Mendoza J.L., Taxonera C., Díaz-Rubio M., Bartolomé M., Arroyo R., Fernández-Arquero M., de la Concha E.G., Urcelay E. Effect of BSN-MST1 locus on inflammatory bowel disease and multiple sclerosis susceptibility. Genes Immun. 2009;10:631–635. doi: 10.1038/gene.2009.56. [DOI] [PubMed] [Google Scholar]
- 34.Nakagome S., Takeyama Y., Mano S., Sakisaka S., Matsui T., Kawamura S., Oota H. Population-specific susceptibility to Crohn's disease and ulcerative colitis: Dominant and recessive relative risks in the Japanese population. Ann. Hum. Genet. 2010;74:126–136. doi: 10.1111/j.1469-1809.2010.00567.x. [DOI] [PubMed] [Google Scholar]
- 35.Michelsen K.S., Thomas L.S., Taylor K.D., Yu Q.T., Mei L., Landers C.J., Derkowski C., McGovern D.P., Rotter J.I., Targan S.R. IBD-associated TL1A gene (TNFSF15) haplotypes determine increased expression of TL1A protein. PLoS ONE. 2009;4:e4719. doi: 10.1371/journal.pone.0004719. [DOI] [PMC free article] [PubMed] [Google Scholar]
- 36.Kakuta Y., Ueki N., Kinouchi Y., Negoro K., Endo K., Nomura E., Takagi S., Takahashi S., Shimosegawa T. TNFSF15 transcripts from risk haplotype for Crohn's disease are overexpressed in stimulated T cells. Hum. Mol. Genet. 2009;18:1089–1098. doi: 10.1093/hmg/ddp005. [DOI] [PubMed] [Google Scholar]
- 37.Franke A., McGovern D.P., Barrett J.C., Wang K., Radford-Smith G.L., Ahmad T., Lees C.W., Balschun T., Lee J., Roberts R. Genome-wide meta-analysis increases to 71 the number of confirmed Crohn's disease susceptibility loci. Nat. Genet. 2010;42:1118–1125. doi: 10.1038/ng.717. [DOI] [PMC free article] [PubMed] [Google Scholar]
- 38.Zintzaras E., Lau J. Trends in meta-analysis of genetic association studies. J. Hum. Genet. 2008;53:1–9. doi: 10.1007/s10038-007-0223-5. [DOI] [PubMed] [Google Scholar]
- 39.Marchini J., Howie B., Myers S., McVean G., Donnelly P. A new multipoint method for genome-wide association studies by imputation of genotypes. Nat. Genet. 2007;39:906–913. doi: 10.1038/ng2088. [DOI] [PubMed] [Google Scholar]
- 40.Nicolae D.L. Testing untyped alleles (TUNA)—Applications to genome-wide association studies. Genet. Epidemiol. 2006;30:718–727. doi: 10.1002/gepi.20182. [DOI] [PubMed] [Google Scholar]
- 41.Nejentsev S., Walker N., Riches D., Egholm M., Todd J.A. Rare variants of IFIH1, a gene implicated in antiviral responses, protect against type 1 diabetes. Science. 2009;324:387–389. doi: 10.1126/science.1167728. [DOI] [PMC free article] [PubMed] [Google Scholar]
- 42.Holmans P., Green E.K., Pahwa J.S., Ferreira M.A., Purcell S.M., Sklar P., Owen M.J., O'Donovan M.C., Craddock N., Wellcome Trust Case-Control Consortium Gene ontology analysis of GWA study data sets provides insights into the biology of bipolar disorder. Am. J. Hum. Genet. 2009;85:13–24. doi: 10.1016/j.ajhg.2009.05.011. [DOI] [PMC free article] [PubMed] [Google Scholar]
- 43.Hindorff L.A., Sethupathy P., Junkins H.A., Ramos E.M., Mehta J.P., Collins F.S., Manolio T.A. Potential etiologic and functional implications of genome-wide association loci for human diseases and traits. Proc. Natl. Acad. Sci. USA. 2009;106:9362–9367. doi: 10.1073/pnas.0903103106. [DOI] [PMC free article] [PubMed] [Google Scholar]
- 44.Nicolae D.L., Gamazon E., Zhang W., Duan S., Dolan M.E., Cox N.J. Trait-associated SNPs are more likely to be eQTLs: Annotation to enhance discovery from GWAS. PLoS Genet. 2010;6:e1000888. doi: 10.1371/journal.pgen.1000888. [DOI] [PMC free article] [PubMed] [Google Scholar]
- 45.Curtis R.K., Oresic M., Vidal-Puig A. Pathways to the analysis of microarray data. Trends Biotechnol. 2005;23:429–435. doi: 10.1016/j.tibtech.2005.05.011. [DOI] [PubMed] [Google Scholar]
- 46.Oti M., Brunner H.G. The modular nature of genetic diseases. Clin. Genet. 2007;71:1–11. doi: 10.1111/j.1399-0004.2006.00708.x. [DOI] [PubMed] [Google Scholar]
- 47.Lage K., Karlberg E.O., Størling Z.M., Olason P.I., Pedersen A.G., Rigina O., Hinsby A.M., Tümer Z., Pociot F., Tommerup N. A human phenome-interactome network of protein complexes implicated in genetic disorders. Nat. Biotechnol. 2007;25:309–316. doi: 10.1038/nbt1295. [DOI] [PubMed] [Google Scholar]
- 48.Wood L.D., Parsons D.W., Jones S., Lin J., Sjöblom T., Leary R.J., Shen D., Boca S.M., Barber T., Ptak J. The genomic landscapes of human breast and colorectal cancers. Science. 2007;318:1108–1113. doi: 10.1126/science.1145720. [DOI] [PubMed] [Google Scholar]
- 49.Lim J., Hao T., Shaw C., Patel A.J., Szabó G., Rual J.F., Fisk C.J., Li N., Smolyar A., Hill D.E. A protein-protein interaction network for human inherited ataxias and disorders of Purkinje cell degeneration. Cell. 2006;125:801–814. doi: 10.1016/j.cell.2006.03.032. [DOI] [PubMed] [Google Scholar]
- 50.McCabe E.R. Hirschsprung's disease: Dissecting complexity in a pathogenetic network. Lancet. 2002;359:1169–1170. doi: 10.1016/S0140-6736(02)08249-1. [DOI] [PubMed] [Google Scholar]
- 51.Di Pietro S.M., Dell'Angelica E.C. The cell biology of Hermansky-Pudlak syndrome: Recent advances. Traffic. 2005;6:525–533. doi: 10.1111/j.1600-0854.2005.00299.x. [DOI] [PubMed] [Google Scholar]
- 52.Gandhi T.K., Zhong J., Mathivanan S., Karthick L., Chandrika K.N., Mohan S.S., Sharma S., Pinkert S., Nagaraju S., Periaswamy B. Analysis of the human protein interactome and comparison with yeast, worm and fly interaction datasets. Nat. Genet. 2006;38:285–293. doi: 10.1038/ng1747. [DOI] [PubMed] [Google Scholar]
Associated Data
This section collects any data citations, data availability statements, or supplementary materials included in this article.