Abstract
A new, simple, sensitive, selective, and precise high-performance liquid chromatography (HPLC) method for analysis of berberine in crude plant material, herbal extract, and ayurvedic dosage forms was developed and validated. The stationary phase was inert sil C18 column The mobile phase consisting of acetonitrile (HPLC Grade) and potassium dihydrogen phosphate buffer (pH 2.5) in a gradient flow was used.The column was equilibrated with the mobile phase (flow rate 1.0 ml/min); elution was monitored at 346 nm. The linear regression analysis data for the calibration plots showed good linear relationship, with r2= 0.9942 in the concentration range of 16380–30420 μg/ml with respect to the peak area. The method was validated for specificity, precision, recovery, and linearity according to the International Conference on Harmonization guidelines. Statistical analysis of the data showed that the method is reproducible and selective for the estimation of berberine.
Keywords: Berberis aristata, berberine, reverse-phase chromatography
INTRODUCTION
Berberis aristata belongs to genus Berberis of family Berberidaceae. This genus is commonly known in English as berberry and in the vernacular as Kashmol or Kinjosa. Most of the species belonging to this genus are very popular as indigenous drugs in India.[1] It is an erect, glabrous, spinescent shrub that grows 3–6 m in height.[2]
Charaka Samhita prescribed that the extract of the plant be taken internally for treatment of hemorrhage, piles, pruritus, and alopecia.[3] Sushruta Samhita described it as being useful internally in indigestion, deficiency of breast milk, and in uterine and vaginal disorders.[2]
Among the over-the-counter preparations of this herb, Daarvaadi Kashaaya is prescribed for leucorrhoea and metrorrhagia, Daarvaadi Churnam for piles and internal abscesses, Daarvibalaadi Ghritam for bleeding piles, and Daarvaadi Tailam for massage in obesity.
High-performance liquid chromatography (HPLC) is a powerful analytical technique because of its reliability, simplicity, reproducibility, and speed. We report a simple, rapid, and selective HPLC method for the separation and determination of berberine in crude plant material, in its extract, and in marketed formulations. The aim of this work was to develop an accurate, specific, repeatable, and robust method for the determination of berberine. The method was validated in compliance with International Conference on Harmonization guidelines.
MATERIAL AND METHODS
Collection and identification of raw materials
Dried stem pieces of Berberis aristata DC were received from the Taxonomist, Dabur Research and Development Center, Sahibabad, Ghaziabad (UP). The raw materials were collected from different places, namely, BR-1 from Uttaranchal, BR-2 from Bihar, and BR-3 from Nepal. The plant material was identified by Dr G. P. Kimothi, Taxonomist, Dabur Research and Development Center, Sahibabad, Ghaziabad (UP). A voucher specimen has been retained in the department for future reference.
Chemicals and reagents
All solvents used were HPLC grade, and the reagents were of analytical grade. Water was purified using a Mili-Q Academic A10 water purification system (Millipore, France). Solvents used for the mobile phase were filtered through membrane filter (0.45-μm pore size) and degassed before use.[4]
HPLC and chromatographic conditions
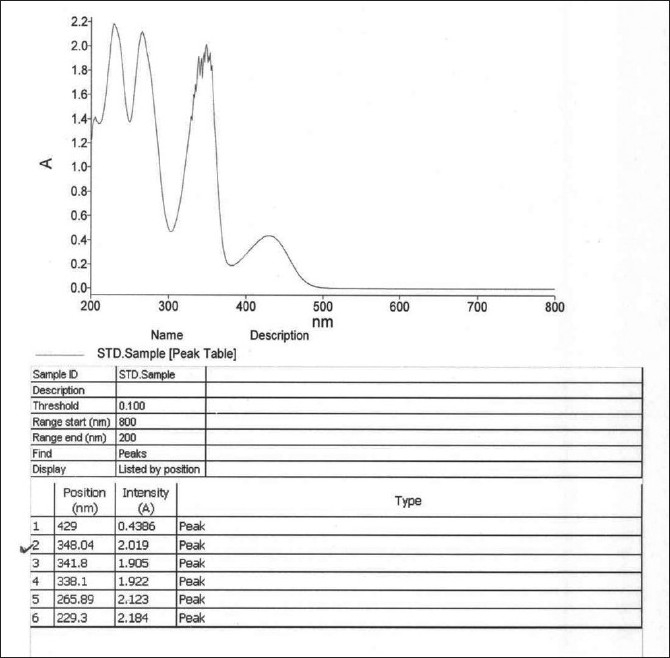
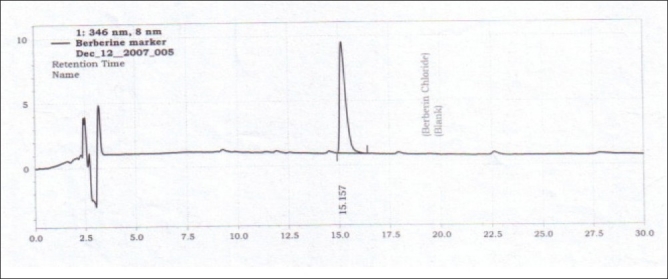
The analysis was performed using a high-performance liquid chromatographic system (Shimadzu class LC), which consisted of a FCV-10 ACVP pump, DGU-14A degasser, a thermostated CTO-10AVP column oven compartment, an autosampler, and a SPD-M10AVP diode array detector.[5] HPLC systems HPLC systems SPD-M10AVP and SIL-20AC were used as equipments I and II for intermediate precision studies. A reverse-phase Zorbax ODS II (250 mm Χ 4.6 mm, 5 μm) column was used. All analyses were performed at a column temperature of 40±1ºC, with a mobile phase of buffer/acetonitrile, an injection volume of 10 μl, and a flow rate of 1.0 ml/min [Table 1]. The UV absorbance of the eluent was measured at 346 nm [Figures 1, 2].
Table 1.
Chromatographic conditions

Figure 1.

UV scan of Berberine to support wavelength
Figure 2.

HPLC chromatogram of berberine chloride
Preparation of buffer
Potassium hydrogen phosphate (1.36 g) was dissolved in 1000 ml of water and the pH was adjusted to 2.5 with orthophosphoric acid.
Preparation of stock solution
Accurately weighed 100.0 mg of standard berberine was dissolved in 25 ml of methanol to get the stock solution with 4000 μg/ml concentration.
Preparation of test solution
Around 1.5 gm of crude herb powder was weighed and refluxed with methanol (100 ml) for 1 h over a water bath and then filtered through Whatman filter paper (No. 41). The marc left out was refluxed again with 50 ml of methanol twice for 30 min each and then filtered. The filtrates were combined and concentrated to 50 ml in a rotary vacuum evaporator and the resulting solution was used as the test solution.
Method validation[6]
Precision
Repeatability of the sample application and measurement of peak area were carried out using six replicates of the same sample and was expressed in terms of percent relative standard deviation (%RSD)
Recovery studies
The pre-analyzed samples were spiked with extra 80%, 100%, and 120% of the actual content of berberine found in the crude herb by addition of the stock solution of berberine and the mixtures were reanalyzed. The experiment was conducted six times. This was done to check for the recovery of the berberine at different levels in the plant material.
Specificity
The specificity of the method was ascertained by analyzing the standard drug (i.e., berberine) and the crude herb powder. The peak for berberine in the sample was confirmed by comparing the retention times of the sample peak with that of the standard. The peak purity of the berberine was assessed by comparing the spectra at two levels, viz; peak start (S) and peak end (E) positions.
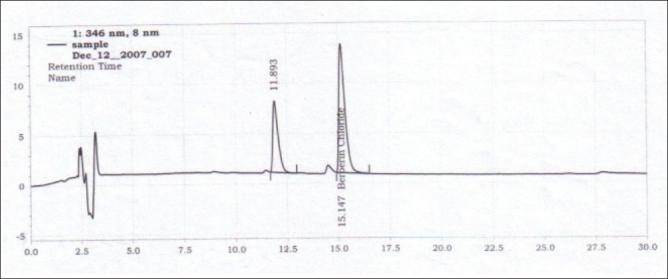
Analysis of berberine in herb extract [Figure 3]
Figure 3.

HPLC chromatogram of the crude herb B aristata
Berberine content was estimated in three different extracts, which were procured from different vendors. To determine the content of berberine in all the extracts, herb extract (100 mg) was dissolved in 5 ml of methanol by sonication and the volume was made up to 10 ml by adding more methanol. This was shaken and filtered through a 0.45-μm membrane filter.
Analysis of berberine in marketed formulations
For the determination of the content of berberine in two different formulations, accurately-weighed 6.0-g samples were mixed in 25 ml of methanol by sonication.
RESULTS AND DISCUSSION
In order to develop and validate an efficient method for the analysis of berberine in crude raw material, different detection wavelengths (uv-range), and different compositions of the mobile phase were explored. According to the preliminary results, we finalized the detection wavelength of 346 nm and the mobile phase of acetonitrile/buffer in a gradient flow. Before fully implementing in the quantitative determination of berberine, this method was thoroughly validated for its linearity, specificity, accuracy, precision and intermediate precision, and robustness under various modified conditions.
Calibration curve and linearity [Graph 1]
Graph 1.

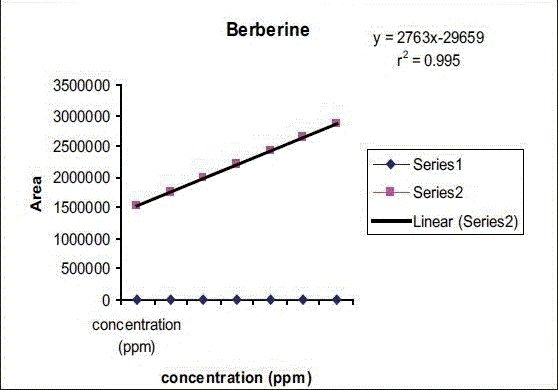
Calibration curve and linearity
The calibration curve was generated from six concentration levels, i.e., 569, 648, 729, 810, 891, 972, and 1053 μg/ml and the corresponding peak areas. It demonstrated an excellent linearity in a range of 569-1053 μg/ml of berberine. The linear equation for the calibration curve was y = 2763 × -29659 with a correlation coefficient of 0.995. Figure 2 displays the calibration curve for berberine at 346 nm.
Precision
The %RSD for six replicate injections of the standard drug berberine and measurement of peak areas was found to be 1.5%.
Six samples of a single batch of the crude herb powder were prepared and analyzed by the proposed method. The %RSD of 1.5% indicates that the method has an acceptable level of precision.
Recovery
The results showed high efficiency for extraction of berberine from crude powder material. The recovery of berberine ranged from 95.98%-98.02%. This confirms that the proposed method can be used for determination and quantification of berberine.
Analysis of berberine in crude raw material [Table 2]
Table 2.
The total berberine content found in different crude raw materials

Analysis of berberine in herbal extract [Table 3]
Table 3.
The total berberine content found in different extracts

Analysis of berberine in market formulation [Table 4]
Table 4.
Amount of berberine found in the different formulations

CONCLUSIONS
The HPLC technique we have described is precise, specific, and accurate for the determination of berberine. Statistical analysis proves that the method is reproducible and selective for the analysis of berberine. Its advantages are speed and simplicity of sample treatment, satisfactory precision, and accuracy.
Footnotes
Source of Support: Nil
Conflict of Interest: None declared
REFERENCES
- 1.Ali M, Sharma SK. Heterocyclic constituents from B.lyceum roots. Indian J Chem. 1996;6:127–30. [Google Scholar]
- 2.Bhishagratna KK, Samhita Sushruta. 3rd ed. Varanasi: 1981. Choukhambha Sanskrit Series office. [Google Scholar]
- 3.Sharma P, Samhita C. Chaukhambha Orientalia. Varanasi: 1992. p. 2. Su.4.3, 12.14, Ci. 6.26, 28. [Google Scholar]
- 4.Zeng X. HPLC determination of berberine in plasma of patients with ischemic heart failure. Chromatographia. 1998;48:589–48. [Google Scholar]
- 5.Zhao L, Huang C, Shan Z, Xiang B, Mei L. Fingerprint analysis of Psoralea corylifolia L by HPLC and LC-MS. J Chromatogr B. 2005;821:67–74. doi: 10.1016/j.jchromb.2005.04.008. [DOI] [PubMed] [Google Scholar]
- 6.ICH International Conference on Harmonisation. Q2B: Validation of Analytical Procedures. US FDA Fed Reg. 1997;62:27463–7. [Google Scholar]


