Abstract
Metabolomics is the comprehensive assessment of endogenous metabolites of a biological system. “Oncometabolomics” is a rapidly emerging field with potential for developing specific biomarkers for early detection, diagnosis, and disease prognosis. Given the power of this technology, the availability of standardized sample preparation methods for immortalized human cancer cell lines is critical toward augmenting research in this direction. Using MCF-7 cells as a model system, we describe an approach for intracellular metabolite extraction from cell cultures for reproducible and comprehensive metabolite extraction. The samples, when injected onto a reverse-phase 50 × 2.1 mm Acquity 1.7-μm C18 column, using an ultra performance liquid chromatography system (UPLC) coupled with electrospray ionization-quadrupole-time-of-flight-mass spectrometry (ESI-Q-TOF-MS) in positive and negative modes, yielded a data matrix with a total of 2600 features. This method, when compared with a water-extraction procedure described earlier, was found to yield significantly higher coverage and detection of molecular features. Finally, we successfully tested the performance of this method for an array of human cancer cell lines used widely in the cancer research field.
Keywords: cellular metabolomics, UPLC-TOFMS, metabonomic profiling
INTRODUCTION
Metabolomics is the downstream complement to genomics, transcriptomics, and proteomics, offering a global assessment of the physiological state of a biological system. It represents the endpoint of genetic regulation and its impact on the altered enzymatic activities and endogenous biochemical reactions in a cell.1 In combination with feature selection, pattern recognition, and multivariate data analysis approaches, metabolomic profiling thus aims to provide a comprehensive assessment of the alterations in the metabolite levels in blood, urine, tissue, or cells.2,3
Recent technological advancements in NMR spectroscopy and mass spectrometry (MS) have led to wide use of these technologies for precise measurements of metabolites with improved sensitivity, resolution, and mass accuracy. Although the exact number of human metabolites is unknown, they are estimated to range from thousands to tens of thousands. Several metabolic pathways, including glucose, fatty acid, and lipid metabolism, have been reported to play an important role in cancer progression and drug response.4 Therefore, development of specific metabolomic biomarkers offers great value for early detection and progression of cancer as well as to follow response to therapy.5
Immortalized cancer cell lines are used extensively in cancer research for understanding the molecular mechanism of disease progression, response, and resistance to therapeutics. As such, these represent an untapped resource for identification of specific metabolite biomarkers that would help distinguish the normal, benign, and metastatic cancer states, as well as response to drugs or stress agents.6,7 The comprehensive characterization of the metabolome, however, is a daunting task, as the endogenous metabolites vary widely in their physical and chemical properties, which in turn, makes their concurrent extraction, separation, and detection a major challenge.8 Although a number of metabolite extraction procedures have been described for microbial systems and human bio-fluids, currently, there is a paucity of wide-ranging metabolite extraction methodologies for human cancer lines with divergent cellular phenotypes.9–12 Patterson et al.13 reported a water-extraction method for metabolic profiling of human TK6 cells that is expected to extract primarily polar compounds. Chiang et al.14 have described a method targeted toward nonpolar lipids and fatty acids in SKOV-3 cells. On the other hand, Sana et al.15 described a strategy for metabolite extraction from erythrocytes and also studied the effect of pH on the extraction of compounds.
The goal of this study was to optimize a comprehensive approach that is reproducible with respect to the yield and detection of a broad range of metabolites, applicable to an array of immortalized human cancer cell lines, and amenable to downstream ultra performance liquid chromatography-electrospray ionization-quadrupole-time-of-flight-MS (UPLC-ESI-TOF-MS) analysis. We optimized the method using the breast cancer cell line MCF-7 for a range of parameters, including cell number, internal standard concentration, cell lysis conditions, and final constitution of cell extracts, which would maximize detection using an UPLC-MS detection method in positive and negative ESI modes. We then compared our results to the aforementioned water-extraction method13 with respect to the total number and type of molecular features obtained. Finally, we determined the use of this approach for different cell types. A detailed, step-by-step protocol is included as a Supplemental File.
MATERIALS AND METHODS
Reagents were as follows: 4-nitrobenzoic acid (4-NBA; Sigma Chemical Co., St. Louis, MO, USA), debrisoquine (as debrisoquine sulfate; Sigma Chemical Co.), acetonitrile (ACN; Fisher Optima grade, Fisher Scientific, Waltham, MA, USA), methanol (Fisher Optima grade, Fisher Scientific), chloroform (Fisher Optima grade, Fisher Scientific), water (Fisher Optima grade, Fisher Scientific), and PBS (Invitrogen, Carlsbad, CA, USA). Equipment and consumables were as follows: 15 ml centrifuge tubes (Corning, Corning, NY, USA), 2 ml microfuge tubes (Denville Scientific, Metuchen, NJ, USA), cell lifter (Thermo Fisher Scientific, Waltham, MA, USA), vacuum line for media and PBS aspiration, water bath (Thermo Fisher Scientific), bench-top centrifuge (Sorvall), microcentrifuge (Thermo Fisher Scientific), speed-vacuum concentrator (Savant), and an UPLC-quadrupole (Q)-TOF-LC-MS/MS system (Waters Corp., Milford, MA, USA).
Cell Culture
The human breast cancer cell line MCF-7 was incubated as three biological replicates in 150 mm Petri dishes at 37°C under a gas phase of 95% air/5% CO2. The cells were maintained in MEM (Invitrogen), supplemented with 10% FBS, penicillin (100 U/ml), and streptomycin (100 U/ml; Gibco, UK). The cells were grown to approximately 80% confluence. The cells were washed with ice-cold PBS and detached using a cell scraper, transferred to a prechilled 15-ml conical tube, and kept on ice. A total cell count using a hemocytometer was performed, and approximately 10 million cells were aliquoted into tubes and spun down at 4°C. Excess PBS was removed by aspiration, and the cell pellets were suspended in 150 μL molecular biology grade water and lysed by two cycles of freeze thaw (30 s at −20°C, followed by 90 s in a 37°C water bath), followed by 30 s of sonication and stored on ice. Cell suspension (5 μL) was aliquoted and used for protein estimation by Bradford assay.
Metabolite Extraction
Methanol (600 μl) containing internal standards was added to the cell suspension, vortexed, and incubated on ice for 15 min, followed by addition of 600 μl chloroform. The tubes were vortexed and centrifuged at 13,000 rpm for 10 min at 15°C. The two phases were transferred to a fresh tube carefully avoiding the interface. Chilled ACN (600 μl) was added to each tube, vortexed, and incubated at −80°C for 2 h. The tubes were centrifuged at 13,000 rpm for 10 min at 4°C; the supernatant was transferred to fresh tubes and dried under vacuum. The two tubes for each sample were combined by resuspending in 150 μl 50% ACN/water, followed by UPLC-TOF-MS analysis.
UPLC-ESI-Q-TOF-MS Analysis
Each sample (5 μl) was injected onto a reverse-phase 50 × 2.1 mm Acquity 1.7-μm C18 column (Waters Corp.) using an Acquity UPLC system (Waters Corp.) with a gradient mobile phase consisting of 2% ACN in water containing 0.1% formic acid (Solvent A) and 2% water in ACN containing 0.1% formic acid (Solvent B) and resolved for 10 min at a flow rate of 0.5 mL/min. The gradient consisted of 100% A for 0.5 min with a ramp of curve 6–100% B from 0.5 min to 10 min. The column eluent was introduced directly into the mass spectrometer by electrospray. MS was performed on a Q-TOF Premier (Waters Corp.), operating in a negative-ion (ESI−) or positive-ion (ESI+) electrospray ionization mode with a capillary voltage of 3200 V and a sampling cone voltage of 20 V in negative mode and 35 V in positive mode. The desolvation gas flow was set to 800 L/h, and the temperature was set to 350°C. The cone gas flow was 25 L/h, and the source temperature was 120°C. Accurate mass was maintained by introduction of LockSpray interface of sulfadimethoxine (311.0814 [M+H]+ or 309.0658 [M−H]−) at a concentration of 250 pg/μL in 50% ACN/water and a rate of 150 μL/min. Data were acquired in centroid mode from 50 to 850 mass-to-charge ratio (m/z) in MS scanning. Centroided and integrated MS data from the UPLC-TOF-MS were processed to generate a multivariate data matrix using MarkerLynx (Waters Corp.).
RESULTS
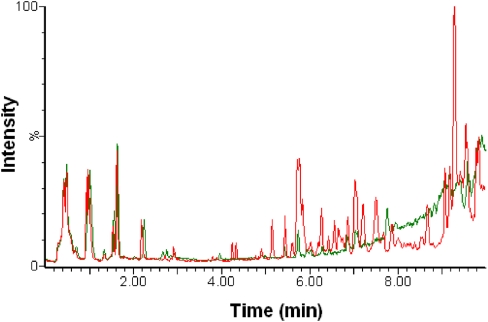
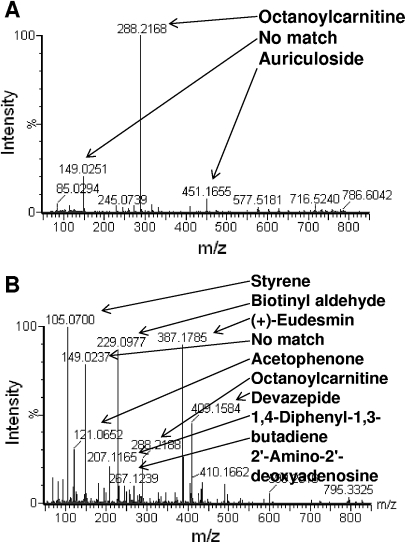
One of the goals was simplification of the extraction method to maintain high-throughput. We optimized the concentration of the internal standard to give sufficient counts for data normalization, while avoiding ion suppression, and combined the two phases at the final step to decrease the number of runs per sample. The total ion chromatogram (TIC) obtained with our multiple-solvent (M-S) approach when compared with the water-extraction protocol13 gave a better detection of features in the nonpolar region (3.5–10 min; Fig. 1). Comparing the molecular features in a small subset of the nonpolar region (3.7–5.3 min) with masses in the Madison-Qingdao Metabolomic Consortium Database (MMCD) established the existence of authentic metabolite ions in this region (Fig. 2A), the large majority of which was not seen when using the water-extraction protocol (Fig. 2B).
FIGURE 1.
Multiple-solvent (M-S) extraction method gives better detection of features. An overlapping comparison of the TIC patterns for MCF-7 cells extracted using a water-extraction (green) or M-S extraction (red), plotted as a function of ion intensities with time. For UPLC gradient conditions, see Supplemental Material.
FIGURE 2.
M-S extraction method demonstrates enhanced extraction of metabolites in MCF-7 cells. Combined mass spectra within the 3.7- to 5.3-min range of the TIC for the water-extraction method (A) and the M-S extraction method (B). Metabolites were annotated with observed masses following a search of the MMCD.
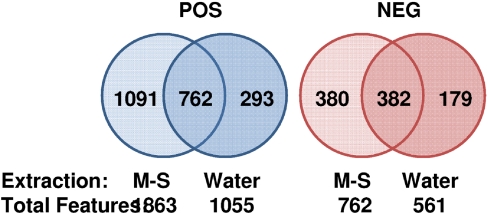
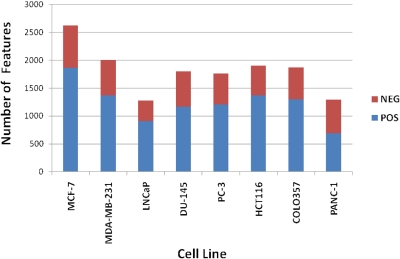
The centroided data from UPLC-TOF-MS, acquired in the positive and negative mode, were then preprocessed using MarkerLynx (Waters Corp.) to generate a data matrix containing ion intensities, m/z, and retention-time values. These data were normalized to the ion intensity of the internal standard (debrisoquine in the positive mode and 4-NBA in the negative mode) and to the total protein concentration, as determined by Bradford assay. Using a single LC method, we obtained 1863 and 762 molecular features in the positive and negative ESI modes, respectively, which were significantly more than those obtained with the water-extraction method (Fig. 3). Moreover, >70% of the water-extraction molecular features were also obtained using the M-S extraction, indicating that only a small portion of features is sacrificed to reap the gains of the M-S system. Finally, we tested the method for a variety of human cancer cell lines that are commonly used in laboratories with a cancer research focus. The underlying idea was to determine the efficacy of extraction of molecular features in cell lines with a diverse phenotype. Our results show that this approach had a broad application and resulted in extraction of molecular features that was comparable yet cell line-dependent (Fig. 4). We have also processed these data and identified these features using accurate mass-based data-base searching and found a wide class of compounds that includes nucleotides, amino acids, free fatty acids, and phospholipids amongst others (data not shown).
FIGURE 3.
M-S extraction method provides a larger number of unique molecular features in both TOF-MS modes. The Venn diagrams depicts the number of molecular features obtained under positive (POS) and negative (NEG) TOF-MS conditions, as identified using MarkerLynx software (Waters Corp.). The M-S method yields a higher number of total as well as unique features in both modes.
FIGURE 4.
M-S extraction method can be generically used for immortalized human cell lines. Molecular features from positive and negative TOF-MS conditions were identified using MarkerLynx software (Waters Corp.). MCF-7 and MDA-MB-231, Human breast adenocarcinoma; LNCaP, androgen-sensitive human prostate carcinoma; DU-145, brain metastasis of human prostate carcinoma; PC-3, bone metastasis of human prostate adenocarcinoma; HCT116, human colorectal carcinoma; COLO357, human pancreatic adenosquamous carcinoma; PANC-1, human carcinoma of the exocrine pancreas.
DISCUSSION
In this study, we have focused on standardizing a small molecule metabolite extraction approach for use with a range of immortalized human cancer cell lines. Our goal was to attain a reproducible yet comprehensive metabolite extraction, which would yield a wide-ranging coverage and detection of metabolites through downstream UPLC-TOF-MS analysis in the positive and negative modes. Our strategy involved optimizing various extraction parameters, including the cell number, volumes of different solvents, and times of incubation, cell lysis method, and final reconstitution, using MCF-7 cells as a model system. Our results indicate that this approach can be successfully used for “cellular metabolomics”. The combining of phases reduces the number of analytical runs needed for a complete coverage of the metabolome.
ACKNOWLEDGMENTS
This work was institutionally supported. The method development was performed in the Proteomics and Metabolomics Shared Resource (PMSR) of the Lombardi Comprehensive Cancer Center. The authors acknowledge Drs. Brown, Johnson, Collins, and Shields for contributing samples for testing the protocol.
REFERENCES
- 1. Villas-Bôas SG, Mas S, Åkesson M, Smedsgaard J, Nielsen J. Mass spectrometry in metabolome analysis. Mass Spectrom Rev 2005;24:613–646 [DOI] [PubMed] [Google Scholar]
- 2. Dunn WB. Current trends and future requirements for the mass spectrometric investigation of microbial, mammalian and plant metabolomes. Phys Biol 2008;5:011001 [DOI] [PubMed] [Google Scholar]
- 3. Vinayavekhin N, Homan EA, Saghatelian A. Exploring disease through metabolomics. ACS Chem Biol 2009;5:91–103 [DOI] [PubMed] [Google Scholar]
- 4. Gottlieb E. Cancer: the fat and the furious. Nature 2009;461:44–45 [DOI] [PubMed] [Google Scholar]
- 5. Serkova NJ, Glunde K. Metabolomics of cancer. Methods Mol Biol 2009;520:273–295 [DOI] [PubMed] [Google Scholar]
- 6. Aguilar H, Sole X, Bonifaci N, et al. Biological reprogramming in acquired resistance to endocrine therapy of breast cancer. Oncogene 2010;29:6071–6083 [DOI] [PubMed] [Google Scholar]
- 7. Qin JZ, Xin H, Nickoloff BJ. Targeting glutamine metabolism sensitizes melanoma cells to TRAIL-induced death. Biochem Biophys Res Commun 2010;398:146–152 [DOI] [PubMed] [Google Scholar]
- 8. Dettmer K, Aronov PA, Hammock BD. Mass spectrometry-based metabolomics. Mass Spectrom Rev 2007;26:51–78 [DOI] [PMC free article] [PubMed] [Google Scholar]
- 9. Maharjan RP, Ferenci T. Global metabolite analysis: the influence of extraction methodology on metabolome profiles of Escherichia coli. Anal Biochem 2003;313:145–154 [DOI] [PubMed] [Google Scholar]
- 10. Ruijter GJ, Panneman H, van den Broeck HC, Bennett JM, Visser J. Characterization of the Aspergillus nidulans frA1 mutant: hexose phosphorylation and apparent lack of involvement of hexokinase in glucose repression. FEMS Microbiol Lett 1996;139:223–228 [DOI] [PubMed] [Google Scholar]
- 11. Vaidyanathan S, Kell DB, Goodacre R. Flow-injection electrospray ionization mass spectrometry of crude cell extracts for high-throughput bacterial identification. J Am Soc Mass Spectrom 2002;13:118–128 [DOI] [PubMed] [Google Scholar]
- 12. Nordstrom A, Want E, Northen T, Lehtio J, Siuzdak G. Multiple ionization mass spectrometry strategy used to reveal the complexity of metabolomics. Anal Chem 2008;80:421–429 [DOI] [PubMed] [Google Scholar]
- 13. Patterson AD, Li H, Eichler GS, et al. UPLC-ESI-TOFMS-based metabolomics and gene expression dynamics inspector self-organizing metabolomic maps as tools for understanding the cellular response to ionizing radiation. Anal Chem 2008;80:665–674 [DOI] [PMC free article] [PubMed] [Google Scholar]
- 14. Chiang KP, Niessen S, Saghatelian A, Cravatt BF. An enzyme that regulates ether lipid signaling pathways in cancer annotated by multidimensional profiling. Chem Biol 2006;13:1041–1050 [DOI] [PubMed] [Google Scholar]
- 15. Sana TR, Waddell K, Fischer SM. A sample extraction and chromatographic strategy for increasing LC/MS detection coverage of the erythrocyte metabolome. J Chromatogr B Analyt Technol Biomed Life Sci 2008;871:314–321 [DOI] [PubMed] [Google Scholar]
Associated Data
This section collects any data citations, data availability statements, or supplementary materials included in this article.


