

Abstract
A central feature of the lipid raft concept is the formation of cholesterol-rich lipid domains. The introduction of relatively rigid cholesterol molecules into fluid liquid-disordered (Ld) phospholipid bilayers can produce liquid-ordered (Lo) mixtures in which the rigidity of cholesterol causes partial ordering of the flexible hydrocarbon acyl chains of the phospholipids. Several lines of evidence support this concept, but direct structural information about Lo membranes is lacking. Here we present the structure of Lo membranes formed from cholesterol and dioleoylphosphatidylcholine (DOPC). Specific deuteration of the DOPC acyl-chain methyl groups and neutron diffraction measurements reveal an extraordinary disorder of the acyl chains of neat Ld DOPC bilayers. The disorder is so great that >20% of the methyl groups are in intimate contact with water in the bilayer interface. The ordering of the DOPC acyl chains by cholesterol leads to retraction of the methyl groups away from the interface. Molecular dynamics simulations based on experimental systems reveal asymmetric transbilayer distributions of the methyl groups associated with each bilayer leaflet.
Introduction
The proteins of cell membranes are distributed in the plane of fluid lipid bilayers that are composed of hundreds, if not thousands, of lipid species. Because of the disparate interaction energies among the lipid and protein components, fluid membranes are likely to be regionalized into fluctuating domain-like structures. This idea underlies the concept of lipid rafts, which are believed to play an important role in cellular signaling processes (1,2). At the heart of the raft concept is the formation of cholesterol-rich lipid domains. Studies of model membranes have shown that the introduction of relatively rigid cholesterol molecules into fluid liquid-disordered (Ld) phospholipid bilayers can produce liquid-ordered (Lo) mixtures (3) in which the rigidity of cholesterol, arising from its transfused ring structure, causes partial ordering of the flexible hydrocarbon acyl chains of the phospholipids (4–6). Although NMR measurements (7–9) and the results of molecular dynamics (MD) simulations (10) are consistent with this idea, little direct structural information about Lo membranes is available. A potentially useful measure of the ordering of lipid acyl chains is the transbilayer distribution of the acyl-chain methyl groups, which appear as troughs of relatively low electron density in the center of bilayer electron-density profiles determined by x-ray diffraction. This trough is expected, because although a methyl group occupies twice the volume of a methylene group, it contributes only one additional electron (11). The trough is relatively narrow for bilayers in crystalline (12) or gel-state (13) bilayers, indicating that the methyl groups are restrained to a small region in the center of the bilayer. In fluid-like Ld bilayers, on the other hand, the trough is quite broad (14). One of the earliest indicators of the existence of the cholesterol-induced Lo state was the observation of narrowing of the methyl trough in electron-density profiles of egg lecithin/cholesterol bilayers relative to neat Ld egg lecithin bilayers (4). X-ray data such as these show the connection between the acyl-chain methyl distribution and the ordering of acyl chains, but the connection is only qualitative. Here, we establish a quantitative relation by using neutron diffraction (15,16) to determine directly the transbilayer distribution of deuterated methyl groups.
Previous MD simulations of DOPC bilayers (17,18) suggested that the transbilayer distribution of acyl-chain methyl groups is much broader than was surmised from early x-ray and neutron diffraction measurements, which assumed a simple Gaussian distribution because of baseline uncertainties in the absolute scaling procedures used (11). Simulations from two laboratories suggested that the methyl distribution is not purely Gaussian (17,19) and is better described as a Gaussian-like distribution with kurtosis (broad tails). Although the widths of the methyl distribution in the simulations of Benz et al. (18) were interpreted as a Gaussian, they implied the existence of a significant population of methyls extending into the headgroup region. This result is consistent with nuclear Overhauser effect spectroscopy (NOESY) NMR measurements (20,21), which have been controversial (22). The existence of significant methyl-headgroup interactions would mean that the lipid acyl chains are far more disordered than is generally appreciated. Our direct structural approach not only confirms the existence of methyl-headgroup interactions, it reveals for the first time (to our knowledge) the extraordinary extent of acyl-chain disorder. We find that 20% of the methyl groups of Ld DOPC bilayers are in intimate contact with the DOPC headgroups. The addition of cholesterol (33 mol %) to produce Lo membranes reduces these interactions dramatically. MD simulations of the systems yield similar results and allow examination of the transbilayer mixing of acyl chains from opposing bilayer leaflets.
Materials and Methods
Synthesis of methyl-deuterated oleic acid
Oleic acid deuterated exclusively on the terminal methyl group was synthesized on a gram scale as described in detail in the Supporting Material. Briefly, the 18-carbon oleic acid chain, with a C1 carboxylic acid, 9,10-cis double bond, and C18 perdeuterated methyl group, was assembled from two readily available components: 1), an unlabeled 10-carbon fragment, O-protected 1-decyne-10-ol, containing both the carboxyl and alkene groups of oleic acid in latent form; and 2), methyl-deuterated 1-iodo-n-octane. The latter labeled fragment was prepared from O-protected ethyl 8-hydroxy-n-octanoate, into which the deuterium label was readily introduced by sequential reduction of the ethyl ester and derived primary alcohol (as the mesylate) with lithium aluminum deuteride. The resultant labeled 8-carbon fragment, corresponding to C11-18 of the target oleic acid, was converted into the iodide and coupled to the protected lithio-10-hydroxy-1-decyne, followed by catalytic semihydrogenation with Ni(OAc)2/H2/NaBH4, to give exclusively the Z-alkene. Hydrolysis of the THP ether and Jones oxidation gave 18,18,18-trideuterio-oleic acid. Analysis by mass spectrometry and 500 MHz proton NMR verified that the terminal (C18) methyl group was fully deuterated (98 ± 1%) and that the alkene was 99.5% Z-isomer.
Materials
Cholesterol deuterated in the A-ring (2,2,3,4,4,6-d6) was purchased from Cambridge Isotope Laboratories (Andover, MA). Proton NMR and mass spectrometry verified both the position and atom percent of deuteration (97–98%). DOPC and d6-DOPC were obtained from Avanti Polar Lipids (Alabaster, AL), and the latter was prepared by substituting specifically deuterated oleic acid (described above) for unlabeled acid according to the manufacturer's standard protocols for synthesizing the commercial unlabeled DOPC.
Sample preparation
For the neutron diffraction experiments, lipid mixtures were deposited onto glass slides from chloroform solutions to produce highly oriented multilamellar bilayer stacks on the glass surface. After the chloroform was removed by evaporation in vacuo, the samples were hydrated through the vapor phase by equilibration with saturated salt solutions to control the relative humidity (RH) and hence the activity of the water in the bilayer stacks. The samples were kept at constant RH in a sealed aluminum sample canister throughout data collection.
Neutron diffraction
Neutron diffraction takes advantage of the fact that deuterium nuclei have a positive scattering length, whereas hydrogen nuclei have negative scattering lengths. In a typical experiment, scattering-length density profiles, representing the projection of the scattering-length density of the unit cell on to the bilayer normal (equivalent to electron-density profiles in x-ray measurements), are computed from the intensities of the lamellar diffraction peaks. Profiles are computed for bilayers containing no deuterated components and for bilayers containing lipids with selectively deuterated chemical groups, such as DOPC double bonds (16). So-called difference structures, which are obtained by subtracting the nondeuterated bilayer profile from the profile of deuterated bilayers, yield the transbilayer distribution of the deuterated atoms in fluid lipid bilayers (16).
The glass slides with deposited multilayers were rotated in the incident cold-neutron beam (23) (wavelength λ = 5.0 Å) through an angle Θ relative to the incident beam while diffracted neutrons were collected at the angle 2Θ (referred to as Θ-2Θ scans). This geometry yields the neutron momentum transfer (Qz ≡ 4πsinΘ/λ) normal to the bilayer plane, and thus probes the structure of the membrane in one dimension only, i.e., along the bilayer normal (see Fig. S1 A in the Supporting Material). With the use of a pencil detector, a series of sharp diffracted intensities I(Qz) were obtained for each sample examined. These intensities were processed by subtracting the linear background for each peak and applying absorption and Lorentz factors to obtain structure factors from which absolute-scale, scattering-length density bilayer profiles were obtained as described in detail elsewhere (16,24,25). Oriented bilayer samples were investigated over a range of hydrations (66–93% RH) at 21°C. This range allowed us to coordinate our results with previous findings (11) and to investigate higher hydrations, but at the same resolution. Neutron diffraction measurements were performed on the Advanced Neutron Diffractometer/Reflectometer (23) located at the NIST Center for Neutron Research (National Institute of Standards and Technology, Gaithersburg, MD). For a summary of the principles and methods of data analysis used here, see Krepkiy et al. (25).
Phasing of DOPC bilayer structure factors
The structure factor phases and the absolute per-lipid scale of the profiles were determined, in a first step, by deuterium contrast variation in the water of hydration as explained elsewhere (24,26). In addition, the phase assignment was further confirmed by the observation that the structure factors, scaled and phased in the previous step for each composition in the DOPC/d6-DOPC series, increased proportionally with the fraction of d6-DOPC (Fig. S3, Table S2, and Table S3). The 7th-order structure factor sign was found to be positive, contrary to previous results for DOPC at 66% relative humidity (24). Its small amplitude makes it difficult to determine its phase unambiguously based only on the H2O-D2O contrast variation. However, because of its small amplitude, it does not contribute significantly to the calculated scattering-length density profile.
MD simulations
All-atom MD simulations of DOPC and DOPC/cholesterol (2:1) bilayers at 7.9 waters/lipid (corresponding to experiments at 86% relative humidity) were carried out at constant temperature (296 K) and constant pressure (1 bar) for 100 ns. Analyses were performed over the last 60 ns of each simulation trajectory. All MD simulations were performed with the NAMD 2.7b1 software package (27). The CHARMM36 force-field parameters were used for DOPC lipids and cholesterol (28), and the TIP3P model was used for water (29). The smooth particle mesh Ewald method (30,31) with a 4th-order interpolation scheme was used to calculate electrostatic interactions, and short-range, real-space interactions were cut off at 11 Å via a switching function. The equations of motion were integrated by means of a reversible multiple-step algorithm (32) with a time step of 4 fs for electrostatic forces, 2 fs for short-range nonbonded interactions, and 1 fs for bonded forces. Bond lengths involving hydrogen atoms were held fixed by the SHAKE (33) and SETTLE (34) algorithms. Nosé-Hoover-Langevin pistons (35,36) were used for pressure control, and a Langevin dynamics scheme was used for thermostating. Molecular graphics and simulation analyses were performed with the VMD 1.8.7 software package (37).
Results and Discussion
Determination of the transbilayer acyl-chain methyl distribution for neat DOPC bilayers
To determine the structure of Ld and Lo bilayers, we performed neutron measurements on oriented multilamellar bilayer arrays composed of DOPC or DOPC/cholesterol mixtures deposited on glass slides. Rotation of the slide in the neutron beam resulted in a lamellar diffraction pattern from which we obtained the structure factors used to compute the profiles (Fig. S1).
As a reference structure for liquid-ordered bilayers, we first characterized liquid-disordered DOPC bilayers. Oriented nondeuterated DOPC bilayers at 66% RH (5.4 waters/lipid) (38) yielded h = 8 orders of sharp lamellar diffraction peaks with a Bragg spacing d = 49.6 ± 0.08 Å (1 Å = 0.1 nm) obtained by Θ-2Θ scans (Fig. S1, A and B). Using data collected in the rocking-curve geometry (Fig. S1 C), we determined that our samples were highly oriented, as indicated by a mosaic spread in Θ of only 0.05° full width at half-maximum (Fig. S1 D). Data of similar quality were obtained at 86% and 93% RH, corresponding to 7.7 and 9.4 waters/lipid (39,40), respectively (Fig. S2). We computed one-dimensional, absolute per-lipid scattering-length density profiles along the bilayer normal from the observed structure factors whose phases were known from earlier studies (24), with one exception (see Materials and Methods). The profile of DOPC at 66% RH obtained by Fourier reconstruction from structure factors presented in Table S2 is shown in Fig. 1 A (black curve). The profile reveals positive densities for the headgroup region, a trough for the hydrocarbon tails, and negative densities near the acyl-chain methyl groups. The neutron scattering lengths for carbon, nitrogen, oxygen, and phosphorous have similar positive values, whereas hydrogen has a negative scattering length. The average scattering-length density of the bilayer hydrocarbon core is close to zero because the positive scattering length of carbon is about equal in magnitude to the negative scattering length of two hydrogens. The headgroup peaks are closer together than they would be in an equivalent x-ray experiment (24), because x-rays scatter most strongly from headgroup phosphates, whereas neutrons scatter most strongly from the carbonyl groups owing to their relative lack of hydrogens.
Figure 1.

Transbilayer distribution of terminal methyl groups and water in a liquid-disordered DOPC bilayer. (A) Scattering-length density profiles on an absolute scale along the bilayer normal of DOPC bilayers. Temperature: 21°C. The solid black line shows the reference bilayer profile determined using nondeuterated DOPC hydrated at 66% relative humidity (RH) (5.4 waters per lipid) with H2O. Blue-shade profiles are for DOPC bilayers hydrated at 66% RH in a series of D2O/H2O mixtures (10, 20, and 50 mol % D2O). Red-shaded profiles correspond to bilayers formed from mixtures of nondeuterated DOPC and terminal-methyl deuterated DOPC (d6-DOPC) (49, 73, and 97 mol % d6-DOPC). The density profile amplitudes are presented in units of scattering-length per unit length, corresponding to the scattering-length density of a unit cell multiplied by the area per lipid (S; see Materials and Methods). The X axis shows the distance from the bilayer center (z) with zero positioned in the middle of the bilayer. Space-filling representations of disordered DOPC molecules are shown above the panel (oxygen, red; carbon, gray; nitrogen, blue; phosphorous, gold; hydrogen, white; deuterium, orange). (B) Difference scattering-length density profiles obtained by subtracting the reference profile (black curve, panel A) from the profiles determined with deuterated water (blue-shaded curves, panel A) and deuterated terminal methyl groups (red-shaded curves, panel A). The difference profiles use the same coloring scheme as in panel A. These data reveal the extreme disorder of liquid-disordered bilayers. The outer wings of the CH3 groups overlap the water distributions and account for ∼20% of the total number of CH3 groups (Fig. S5). Similar results were obtained at 86% and 93% RH (7.7 and 9.4 waters per lipid, respectively; Fig. S5). The estimated maximum uncertainty for all profiles is indicated by the black error bar determined from error bands computed by the method of Wiener and White (24). Examples of such error bands are shown in Fig. 2. To reduce the complexity of the plots, the bands were not included here; the same data with complete error bands are shown in Fig. S6.
To determine the transmembrane distribution of the acyl-chain methyl groups, we first synthesized methyl-deuterated oleic acid (Supporting Material). Methyl-deuterated DOPC (d6-DOPC) carrying two methyl-deuterated chains was then synthesized by Avanti Polar Lipids. Mass spectrometry demonstrated the purity of the lipid and allowed the deuterium isotope content to be determined. Diffraction measurements were then carried out on DOPC/d6-DOPC bilayers containing 49, 73, or 97 mol % d6-DOPC under the same conditions used for the DOPC bilayers. In addition, to determine the water distribution across the bilayers, we made diffraction measurements on DOPC bilayers hydrated through the vapor phase using saturated salt solutions prepared with H2O/D2O mixtures containing 0, 10, 20, and 50 mol % D2O. These deuteration experiments allowed us to determine the phases of the structure factors (Fig. S3). The scattering-length profiles obtained at 66% RH are shown in Fig. 1 A. The profiles of the DOPC/d6-DOPC bilayers are shown in shades of red and orange, and profiles of DOPC hydrated with different mol percents of D2O are shown in shades of blue. In the DOPC/d6-DOPC experiments, the scattering density increased linearly in the center of the bilayer with increasing mol % d6-DOPC, while in the DOPC/H2O:D2O the scattering density increased linearly with increasing D2O mol % in the headgroup region of the bilayer. Similar results were obtained for experiments carried out at 86% and 93% RH (Fig. S4). We determined from these profiles the transbilayer distributions of the acyl-chain methyls and bilayer water by using difference-structure curves obtained by subtracting the scattering profile of nondeuterated DOPC (black curve, Fig. 1 A) from the scattering-length profiles for bilayers containing deuterated methyls or water.
The difference-structure profiles for acyl-chain methyls and bilayer waters are shown in Fig. 1 B. The complete methyl distribution is much broader than the 1/e-halfwidth of 2.95 ± 0.28 Å (66% RH) previously determined by indirect methods (11), which assumed a Gaussian distribution. The transbilayer methyl distribution determined here consists of a strong central peak (1/e-halfwidth of 4.52 ± 0.06 at 66% RH) with weaker wings that overlap the water distributions at the edge of the bilayer lipids. Under the conditions of our experiments, this distribution represents a fully resolved image of the distribution, for reasons discussed extensively by Wiener and White (41,42). Further, the distribution is not affected by bilayer undulations (43) at the hydrations used in our experiments (24,40). Because there is no excess water in our samples, the waters revealed in the profiles are those that hydrate the headgroups. Therefore, the methyl wings extend into the headgroups of the lipids. The strong central methyl peak is Gaussian in shape and occupies ∼80% of the total methyl area, which leads to the conclusion that ∼20% of the bilayer's acyl-chain methyls are in a distribution that includes contact with the headgroups (Fig. S5). About half of this distribution (10% of methyls) overlaps with the headgroup region, starting at the carbonyls. The extent of the incursion of the methyls into the headgroups reveals a remarkable degree of acyl-chain disorder in Ld bilayers that could not have been anticipated, even from NOESY NMR measurements (20–22).
Determination of the transbilayer methyl distribution for 2:1 DOPC/cholesterol bilayers
We next addressed the issue of acyl-chain disorder in Lo membranes by obtaining diffraction measurements at 86% RH on oriented DOPC and 2:1 DOPC/cholesterol bilayers (i.e., 33 mol % cholesterol) containing 7.7 and 7.9 waters/lipid, respectively. The Bragg spacing (d) of DOPC bilayers and 2:1 DOPC/cholesterol bilayers was determined to be 50.4 ± 0.1 Å and 52.7 ± 0.2 Å, respectively (Fig. S7). Increases in d with increasing cholesterol concentration in phospholipid/cholesterol mixtures are generally interpreted as resulting from the condensing effect of cholesterol, which decreases the interfacial area of the phospholipids (44) and consequently increases the average length of the phospholipid.
We first carried out diffraction measurements at 86% RH on neat DOPC and d6-DOPC bilayers, and on bilayers containing 33 mol % cholesterol or 33 mol % cholesterol deuterated in the hydroxyl-containing A ring (cholesterol-2,2,3,4,4,6-d6, here called d6-cholesterol). The bilayers, which were highly oriented at the hydration used, yielded 7 orders of lamellar diffraction for neat DOPC and 8 orders for DOPC/cholesterol bilayers. The diffracted intensities yielded structure factors from which scattering-length bilayer profiles were computed. The profiles for the neat DOPC and d6-DOPC are shown in Fig. 2 A (red dotted and solid curves, respectively). Also shown in Fig. 2 A are profiles for 2:1 DOPC/cholesterol and 2:1 d6-DOPC/d6-cholesterol (blue dotted and solid curves, respectively). For clarity, the space between the two DOPC/cholesterol curves has been shaded blue. The scattering density increases in the center of the neat d6-DOPC profile relative to the DOPC bilayer, as expected. Also as expected, the scattering density increases in both the bilayer center and headgroup regions of d6-DOPC/d6-cholesterol bilayers relative to the DOPC/cholesterol bilayers.
Figure 2.

Transbilayer distribution of terminal methyl groups in a liquid-ordered DOPC/cholesterol (2:1) bilayer. Scattering-length density profiles on an absolute scale along the bilayer normal of DOPC and 2:1 DOPC/cholesterol bilayers. Temperature: 21°C. Hydration: 86% RH. (A) The dashed blue curve is the reference profile for a 2:1 DOPC/cholesterol bilayer, and the solid blue curve is for 2:1 d6-DOPC/d6-cholesterol (cholesterol-2,2,3,4,4,6-d6). The dashed red curve is the reference profile for DOPC, and the solid red curve is for 2.7:1 d6-DOPC/DOPC (i.e., 73 mol % d6-DOPC). Space-filling representations of disordered DOPC molecules (light red background) and cholesterol molecules (light blue background) are shown above the panel (red, oxygen; gray, carbon; blue, nitrogen; gold, phosphorous; white, hydrogen; orange, deuterium). (B) Difference scattering-length density profiles obtained by subtracting the reference profiles from the profiles determined using d6-DOPC (yellow curve surrounded by red band) and d6-DOPC/d6-cholesterol (blue curve surrounded by lighter blue band). The d6-DOPC curve shows that the terminal methyl groups have a broad transbilayer distribution similar to the distribution observed at 66% RH (Fig. 1B). The broad red band represents estimates of experimental uncertainty computed using the methods of Wiener and White (24). The d6-DOPC methyl peak has been rescaled to account for the lower d6-DOPC concentration (73 mol %) in the DOPC bilayers compared to the d6-DOPC/d6-cholesterol bilayers, which were made with 100% d6-DOPC. The d6-DOPC/d6-cholesterol curve shows that the cholesterol causes the terminal methyl groups to retract from the interface. The pair of peaks located at ∼±15 Å relative to the bilayer center are due to the six deuterium atoms on the hydroxyl-containing A ring of cholesterol. The broad light-blue band represents estimates of experimental uncertainty computed according to the methods of Wiener and White (24). (C) Difference scattering-length density profiles for d6-DOPC/cholesterol (determined independently from the data presented in A and B) obtained by subtracting a reference 2:1 DOPC/cholesterol profile from the d6-DOPC/cholesterol (blue curve surrounded by lighter blue band). The d6-DOPC difference structure of panel B is included for comparison. The dotted blue curves are Gaussian-fit curves of the deuterated A ring of the d6-DOPC/d6-cholesterol difference structure of panel B. The repeat distances were determined to be 50.4 ± 0.1 for neat DOPC bilayers and 52.7 ± 0.2 for 2:1 DOPC/cholesterol, respectively. The analysis was performed considering nw = 7.7 water molecules per unit cell for neat DOPC (23) and nw = 7.9 water for 2:1 DOPC/cholesterol. The latter value was determined by using the terminal methyl of d6-DOPC peak for calibration, which allows determination of the absolute amplitude of the water peak (16,25).
The difference structures shown in Fig. 2 B, obtained from the profiles in Fig. 2 A, reveal that the addition of cholesterol caused a dramatic decrease in the width of the acyl-chain methyl distribution. The difference profiles for d6-DOPC and d6-DOPC/cholesterol are shown in Fig. 2 C by the solid red and blue curves, respectively. The methyl distribution shown in Fig. 2 C for d6-DOPC/cholesterol was obtained from an independent set of measurements, apart from the results shown in Fig. 2 B. This independent result confirms the effect of cholesterol on the methyl distribution observed in Fig. 2 B. Superimposed on the difference profiles as dotted blue lines are Gaussian-fitted peaks corresponding to the location of the hydroxyl-containing ring of d6-cholesterol. These results establish that the acyl-chain methyl groups have indeed retreated from the region occupied by the hydroxyl-containing ring of the cholesterol. The fact that small methyl wings remain in the presence of cholesterol is shown by superimposing a curve (dashed black curve) obtained by fitting a Gaussian curve to the central region of the methyl distribution. The wings in this case occupy ∼3% of the total methyl area.
MD simulations
To gain additional insights into the structural differences between Ld and Lo bilayers, we carried out all-atom MD simulations of each lipid bilayer system at 7.9 waters/lipid (corresponding to 86% relative humidity). The transbilayer distributions for the acyl-chain methyl groups exhibit broad wings similar to those observed experimentally, accounting for ∼11% and 6% of the terminal methyl groups in DOPC and DOPC/cholesterol, respectively (see solid curves in Fig. 3, B and D). An advantage of such simulations is that they can reveal the transbilayer distributions of the acyl-chain methyls of each bilayer leaflet. The purple and magenta curves in Fig. 3, B and D, show that the methyl distributions associated with each leaflet are highly asymmetric and exhibit long tails that extend into their respective polar headgroup regions. The area shared by the purple and magenta curves reveals the extent of interleaflet mixing of acyl-chain methyls in the absence and presence of cholesterol.
Figure 3.

Simulated transbilayer distributions of terminal methyl groups in liquid-disordered and -ordered DOPC/cholesterol (2:1) bilayers. (A) Snapshot of the all-atom MD simulation of DOPC. The terminal methyl groups are represented as spheres and colored purple and magenta to distinguish the methyls of each leaflet. Acyl chains shown in stick representation are gray. Phosphatidylcholine headgroups are also shown in stick representation and colored according to the element (red, oxygen; blue, nitrogen; gold, phosphorous; white, hydrogen). Water is represented by the aquamarine bands. The simulation box contained 288 DOPC and 2276 water molecules. The d-spacing under NPT conditions was 48.6 ± 0.4 Å. (B) Transbilayer distribution of terminal methyls for DOPC observed in the all-atom MD simulations of the experimental results described in Fig. 1. The solid aquamarine curve shows the distribution for all terminal methyl groups. The broad wings observed experimentally are also observed in the simulation. The maroon and purple curves show the distributions of methyl groups associated with the left and right bilayer leaflets, respectively. (C) Snapshot from the all-atom MD 2:1 DOPC/cholesterol. Cholesterol molecules, colored goldenrod, are shown in stick representation. As observed experimentally, the bilayer is thicker than in panel A due to the ordering effect of the cholesterol molecules on the DOPC molecules. The simulation box contained 192 DOPC, 96 cholesterol, and 2285 water molecules. The d-spacing under NPT conditions was 53.1 ± 0.7 Å. (D) Transbilayer distribution of terminal methyls for DOPC in 2:1 DOPC/cholesterol bilayers observed in all-atom MD simulations of the experimental results described in Fig. 2. The solid aquamarine curve shows the distribution for all terminal methyl groups. As in the experiments, the DOPC methyls retract from the membrane interface in the presence of cholesterol. The maroon and purple curves show the distributions of methyl groups associated with the left and right bilayer leaflets, respectively.
Cholesterol significantly decreases interleaflet mixing. This finding is consistent with the generally accepted idea that the DOPC/cholesterol liquid-ordered phase arises as a result of the phospholipid acyl chains straightening without changing their fluidity or packing (4–9). This straightening is further supported by a comparison of the orientational order-parameter profiles for both the sn-1 and sn-2 chains, as shown in Fig. 4 A. The figure shows an increase by ∼50% in the magnitude of the order parameters for most methylene positions, as previously observed in NMR experiments (8). However, cholesterol has no effect on the fraction of gauche conformations of any carbon-carbon bond along either DOPC acyl chain (Fig. 4 B), suggesting that the ordering effect achieved by acyl-chain straightening is not accompanied by a change in packing of the lipid bilayer hydrocarbon core. But if the probability of each bond in the gauche configuration is not influenced by the presence of cholesterol, how can one explain chain straightening in the bilayers of DOPC/cholesterol mixtures? The straightening is a second-order effect. Although the overall probability for gauche bonds does not decrease, the probability of certain combinations of gauche bonds in a chain is reduced by cholesterol, thus preventing the bending of the chains' ends toward the interface. This is evident from the increased order parameters of the chains (Fig. 4 A).
Figure 4.
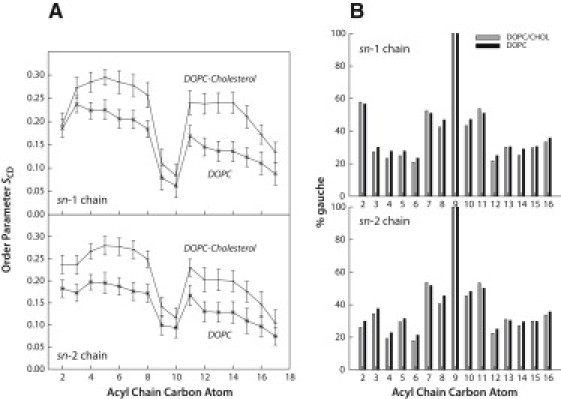
Order-parameter profiles and fraction of gauche conformations for DOPC acyl chains. (A) Order-parameter profiles for the acyl chains of DOPC in the absence and presence cholesterol (2:1 DOPC/cholesterol) determined from MD simulations. The orientational order parameters SCD of the DOPC oleoyl chains (sn-1 and sn-2) were calculated from the orientation of the C-H bonds of each methylene position relative to the bilayer normal. Specifically, SCD = |<P2(cosθ)>|, where P2 is the second Legendre polynomial, and θ is the angle between a C-H bond and the bilayer normal. (B) Fraction of gauche conformations along the DOPC sn-1 and sn-2 chains in the absence and presence of cholesterol (2:1 DOPC/cholesterol) determined by MD simulations. The fraction of gauche conformations was calculated for the DOPC and DOPC/cholesterol systems from the dihedral angle distributions along the sn-1 and sn-2 DOPC oleoyl chains. The data show that the presence of cholesterol has little effect on the distributions of gauche conformations.
Together, the results of our diffraction measurements and MD simulations are consistent with a partial ordering of phospholipid acyl chains by the rigid fused-ring structure of cholesterol. An unexpected result of our study is the observation of a high concentration of acyl-chain methyl groups in the polar headgroup region of liquid-disordered membranes. This finding reveals the extreme disorder of the bilayer hydrocarbon core and validates earlier NOESY NMR results that suggested contact between acyl-chain methyls and the polar headgroups. However, we did not anticipate the extent of the headgroup-methyl mixing from the NMR measurements. Cholesterol reduces this mixing, but does not eliminate it entirely. In the context of the raft hypothesis, it was previously suggested that coupling between bilayer leaflets might occur in rafts as a result of cholesterol's ordering effect on sphingolipids in the outer leaflet and glycerolipids in the cytoplasmic leaflet (1,45). The DOPC/cholesterol Lo membranes examined here lack the lipid asymmetry of plasma membranes; nevertheless, the results suggest that cholesterol is more likely to decrease interleaflet coupling rather than enhance it. However, with or without cholesterol, interleaflet coupling is significant.
Acknowledgments
This work was supported in part by the National Institutes of Health (NIGMS grant GM74737 to S.H.W., Program Project GM86685 from NIGMS and NINDS to S.H.W., D.T., and R.C.) and the National Science Foundation (grant CHE-0750175 to D.T.). E.J.-V. was supported by a UC MEXUS-CONACyT postdoctoral fellowship. Computer time was provided by the National Science Foundation-supported TeraGrid resources at the Texas Advanced Computing Center, and the National Institute of Standards and Technology, U.S. Department of Commerce, provided the neutron research facilities used for the neutron diffraction experiments. The identification of any commercial product or trade name does not imply any endorsement or recommendation by the National Institute of Standards and Technology.
Supporting Material
References
- 1.Simons K., Ikonen E. Functional rafts in cell membranes. Nature. 1997;387:569–572. doi: 10.1038/42408. [DOI] [PubMed] [Google Scholar]
- 2.Lingwood D., Kaiser H.-J., Simons K. Lipid rafts as functional heterogeneity in cell membranes. Biochem. Soc. Trans. 2009;37:955–960. doi: 10.1042/BST0370955. [DOI] [PubMed] [Google Scholar]
- 3.Ipsen J.H., Karlstrom G., Zuckermann M.J. Phase equilibria in the phosphatidylcholine-cholesterol system. Biochim. Biophys. Acta. 1987;905:162–172. doi: 10.1016/0005-2736(87)90020-4. [DOI] [PubMed] [Google Scholar]
- 4.Levine Y.K., Wilkins M.H.F. Structure of oriented lipid bilayers. Nat. New Biol. 1971;230:69–76. doi: 10.1038/newbio230069a0. [DOI] [PubMed] [Google Scholar]
- 5.Hsia J.C., Long R.A., Gesser H.D. Steroid-phosphatidylcholine interactions in oriented multibilayers-A spin label study. Biochim. Biophys. Acta. 1972;290:22–31. doi: 10.1016/0005-2736(72)90048-x. [DOI] [PubMed] [Google Scholar]
- 6.Zhao J., Wu J., Feigenson G.W. Phase studies of model biomembranes: complex behavior of DSPC/DOPC/cholesterol. Biochim. Biophys. Acta. 2007;1768:2764–2776. doi: 10.1016/j.bbamem.2007.07.008. [DOI] [PMC free article] [PubMed] [Google Scholar]
- 7.Godici P.E., Landsberger F.R. The dynamic structure of lipid membranes. A 13C nuclear magnetic resonance study using spin labels. Biochemistry. 1974;13:362–368. doi: 10.1021/bi00699a022. [DOI] [PubMed] [Google Scholar]
- 8.Vist M.R., Davis J.H. Phase equilibria of cholesterol/dipalmitoylphosphatidylcholine mixtures: 2H nuclear magnetic resonance and differential scanning calorimetry. Biochemistry. 1990;29:451–464. doi: 10.1021/bi00454a021. [DOI] [PubMed] [Google Scholar]
- 9.Polozov I.V., Gawrisch K. Characterization of the liquid-ordered state by proton MAS NMR. Biophys. J. 2006;90:2051–2061. doi: 10.1529/biophysj.105.070441. [DOI] [PMC free article] [PubMed] [Google Scholar]
- 10.Risselada H.J., Marrink S.J. The molecular face of lipid rafts in model membranes. Proc. Natl. Acad. Sci. USA. 2008;105:17367–17372. doi: 10.1073/pnas.0807527105. [DOI] [PMC free article] [PubMed] [Google Scholar]
- 11.Wiener M.C., White S.H. Structure of a fluid dioleoylphosphatidylcholine bilayer determined by joint refinement of x-ray and neutron diffraction data. II. Distribution and packing of terminal methyl groups. Biophys. J. 1992;61:428–433. doi: 10.1016/S0006-3495(92)81848-9. [DOI] [PMC free article] [PubMed] [Google Scholar]
- 12.Hitchcock P.B., Mason R., Shipley G.G. Structural chemistry of 1,2 dilauroyl-DL-phosphatidylethanolamine: molecular conformation and intermolecular packing of phospholipids. Proc. Natl. Acad. Sci. USA. 1974;71:3036–3040. doi: 10.1073/pnas.71.8.3036. [DOI] [PMC free article] [PubMed] [Google Scholar]
- 13.Wiener M.C., Suter R.M., Nagle J.F. Structure of the fully hydrated gel phase of dipalmitoylphosphatidylcholine. Biophys. J. 1989;55:315–325. doi: 10.1016/S0006-3495(89)82807-3. [DOI] [PMC free article] [PubMed] [Google Scholar]
- 14.Nagle J.F., Zhang R., Suter R.M. X-ray structure determination of fully hydrated Lα phase dipalmitoylphosphatidylcholine bilayers. Biophys. J. 1996;70:1419–1431. doi: 10.1016/S0006-3495(96)79701-1. [DOI] [PMC free article] [PubMed] [Google Scholar]
- 15.Büldt G., Gally H.U., Zaccai G. Neutron diffraction studies on selectively deuterated phospholipid bilayers. Nature. 1978;271:182–184. doi: 10.1038/271182a0. [DOI] [PubMed] [Google Scholar]
- 16.Wiener M.C., King G.I., White S.H. Structure of a fluid dioleoylphosphatidylcholine bilayer determined by joint refinement of x-ray and neutron diffraction data. I. Scaling of neutron data and the distribution of double-bonds and water. Biophys. J. 1991;60:568–576. doi: 10.1016/S0006-3495(91)82086-0. [DOI] [PMC free article] [PubMed] [Google Scholar]
- 17.Feller S.E., Yin D.X., MacKerell A.D., Jr. Molecular dynamics simulation of unsaturated lipid bilayers at low hydration: parameterization and comparison with diffraction studies. Biophys. J. 1997;73:2269–2279. doi: 10.1016/S0006-3495(97)78259-6. [DOI] [PMC free article] [PubMed] [Google Scholar]
- 18.Benz R.W., Castro-Román F., White S.H. Experimental validation of molecular dynamics simulations of lipid bilayers: A new approach. Biophys. J. 2005;88:805–817. doi: 10.1529/biophysj.104.046821. [DOI] [PMC free article] [PubMed] [Google Scholar]
- 19.Klauda J.B., Kucerka N., Nagle J.F. Simulation-based methods for interpreting x-ray data from lipid bilayers. Biophys. J. 2006;90:2796–2807. doi: 10.1529/biophysj.105.075697. [DOI] [PMC free article] [PubMed] [Google Scholar]
- 20.Xu Z.-C., Cafiso D.S. Phospholipid packing and conformation in small vesicles revealed by two-dimensional 1H nuclear magnetic resonance cross-relaxation spectroscopy. Biophys. J. 1986;49:779–783. doi: 10.1016/S0006-3495(86)83705-5. [DOI] [PMC free article] [PubMed] [Google Scholar]
- 21.Forbes J., Husted C., Oldfield E. High-field, high-resolution proton “magic angle” sample-spinning nuclear magnetic resonance spectroscopic studies of gel and liquid crystalline lipid bilayers and effects of cholesterol. J. Am. Chem. Soc. 1988;110:1059–1065. [Google Scholar]
- 22.Huster D., Gawrisch K. NOESY NMR crosspeaks between lipid headgroups and hydrocarbon chains: Spin diffusion or molecular disorder? J. Am. Chem. Soc. 1999;121:1992–1993. [Google Scholar]
- 23.Dura J.A., Pierce D.J., White S.H. AND/R: a neutron diffractometer/reflectometer for investigation of thin films and multilayers for the life sciences. Rev. Sci. Instrum. 2006;77:074301. doi: 10.1063/1.2219744. [DOI] [PMC free article] [PubMed] [Google Scholar]
- 24.Wiener M.C., White S.H. Structure of a fluid dioleoylphosphatidylcholine bilayer determined by joint refinement of x-ray and neutron diffraction data. III. Complete structure. Biophys. J. 1992;61:434–447. doi: 10.1016/S0006-3495(92)81849-0. [DOI] [PMC free article] [PubMed] [Google Scholar]
- 25.Krepkiy D., Mihailescu M., Swartz K.J. Structure and hydration of membranes embedded with voltage-sensing domains. Nature. 2009;462:473–479. doi: 10.1038/nature08542. [DOI] [PMC free article] [PubMed] [Google Scholar]
- 26.Worcester D.L., Franks N.P. Structural analysis of hydrated egg lecithin and cholesterol bilayers. II. Neutron diffraction. J. Mol. Biol. 1976;100:359–378. doi: 10.1016/s0022-2836(76)80068-x. [DOI] [PubMed] [Google Scholar]
- 27.Phillips J.C., Braun B., Schulten K. Scalable molecular dynamics with NAMD. J. Comput. Chem. 2005;26:1781–1802. doi: 10.1002/jcc.20289. [DOI] [PMC free article] [PubMed] [Google Scholar]
- 28.Klauda J.B., Venable R.M., Pastor R.W. Update of the CHARMM all-atom additive force field for lipids: validation on six lipid types. J. Phys. Chem. B. 2010;114:7830–7843. doi: 10.1021/jp101759q. [DOI] [PMC free article] [PubMed] [Google Scholar]
- 29.Jorgensen W.L., Chandrasekhar J., Klein M.L. Comparison of simple potential functions for simulating liquid water. J. Chem. Phys. 1983;79:926–935. [Google Scholar]
- 30.Darden T., York D., Pedersen L. Particle mesh Ewald: an N•log(N) method for Ewald sums in large systems. J. Chem. Phys. 1993;98:10089–10092. [Google Scholar]
- 31.Essmann U., Perera L., Pedersen L.G. A smooth particle mesh Ewald method. J. Chem. Phys. 1995;103:8577–8593. [Google Scholar]
- 32.Grubmüller H., Heller H., Schulten K. Generalized Verlet algorithm for efficient molecular dynamics simulations with long-range interactions. Mol. Simul. 1991;6:121–142. [Google Scholar]
- 33.Ryckaert J.-P., Ciccotti G., Berendsen H.J.C. Numerical integration of the Cartesian equations of motion of a system with constraints: molecular dynamics of n-alkanes. J. Comput. Phys. 1977;23:327–341. [Google Scholar]
- 34.Miyamoto S., Kollman P. An analytical version of the SHAKE and RATTLE algorithm for rigid water models. J. Comput. Chem. 1992;13:952–962. [Google Scholar]
- 35.Martyna G.J., Tobias D.J., Klein M.L. Constant-pressure molecular-dynamics algorithms. J. Chem. Phys. 1994;101:4177–4189. [Google Scholar]
- 36.Feller S.E., Zhang Y., Brooks B.R. Constant pressure molecular dynamics simulation: the Langevin piston method. J. Chem. Phys. 1995;103:4613–4621. [Google Scholar]
- 37.Humphrey W., Dalke W., Schulten K. VMD: Visual molecular dynamics. J. Mol. Graph. 1996;14:33–38. doi: 10.1016/0263-7855(96)00018-5. [DOI] [PubMed] [Google Scholar]
- 38.White S.H., Jacobs R.E., King G.I. Partial specific volumes of lipid and water in mixtures of egg lecithin and water. Biophys. J. 1987;52:663–665. doi: 10.1016/S0006-3495(87)83259-9. [DOI] [PMC free article] [PubMed] [Google Scholar]
- 39.McIntosh T.J., Magid A.D., Simon S.A. Repulsive interactions between uncharged bilayers: hydration and fluctuation pressures for monoglycerides. Biophys. J. 1989;55:897–904. doi: 10.1016/S0006-3495(89)82888-7. [DOI] [PMC free article] [PubMed] [Google Scholar]
- 40.Hristova K., White S.H. Determination of the hydrocarbon core structure of fluid dioleoylphosphocholine (DOPC) bilayers by x-ray diffraction using specific bromination of the double-bonds: effect of hydration. Biophys. J. 1998;74:2419–2433. doi: 10.1016/S0006-3495(98)77950-0. [DOI] [PMC free article] [PubMed] [Google Scholar]
- 41.Wiener M.C., White S.H. Fluid bilayer structure determination by the combined use of X-ray and neutron diffraction. I. Fluid bilayer models and the limits of resolution. Biophys. J. 1991;59:162–173. doi: 10.1016/S0006-3495(91)82208-1. [DOI] [PMC free article] [PubMed] [Google Scholar]
- 42.Wiener M.C., White S.H. Fluid bilayer structure determination by the combined use of X-ray and neutron diffraction. II. “Composition-space” refinement method. Biophys. J. 1991;59:174–185. doi: 10.1016/S0006-3495(91)82209-3. [DOI] [PMC free article] [PubMed] [Google Scholar]
- 43.Sirota E.B., Smith G.S., Clark N.A. X-ray scattering studies of aligned, stacked surfactant membrances. Science. 1988;242:1406–1409. doi: 10.1126/science.242.4884.1406. [DOI] [PubMed] [Google Scholar]
- 44.Lecuyer H., Dervichian D.G. Structure of aqueous mixtures of lecithin and cholesterol. J. Mol. Biol. 1969;45:39–57. doi: 10.1016/0022-2836(69)90208-3. [DOI] [PubMed] [Google Scholar]
- 45.Simons K., Toomre D. Lipid rafts and signal transduction. Nat. Rev. Mol. Cell Biol. 2000;1:31–39. doi: 10.1038/35036052. [DOI] [PubMed] [Google Scholar]
Associated Data
This section collects any data citations, data availability statements, or supplementary materials included in this article.