

Abstract
Reconstituted systems mimicking cells are interesting tools for understanding the details of cell behavior. Here, we use an experimental system that mimics cellular actin cortices, namely liposomes developing an actin shell close to their inner membrane, and we study their dynamics of spreading. We show that depending on the morphology of the actin shell inside the liposome, spreading dynamics is either reminiscent of a bare liposome (in the case of a sparse actin shell) or of a cell (in the case of a continuous actin shell). We use a mechanical model that qualitatively accounts for the shape of the experimental curves. From the data on spreading dynamics, we extract characteristic times that are consistent with mechanical estimates. The mechanical characterization of such stripped-down experimental systems paves the way for a more complex design closer to a cell. We report here the first step in building an artificial cell and studying its mechanics.
Introduction
The cell membrane is sustained by a polymer network that provides versatile mechanical properties to the cell. Such a cell cortex is found in cellular systems as simple as red blood cells, where the spectrin network lies underneath the membrane, or in more complex systems like mammalian cells. In this case, the cortex is made of dynamic actin filaments associated with myosin motors and plays an important role in cell shape changes involved in essential cell fates like division, motility, and development. The specific role of the cell cortex and its influence in a given cellular process are difficult to dissect with living cells. The use of cortex-altering drugs or the lack of one protein is nevertheless informative.
For example, it has been clearly shown that the disintegration of the actin cortex disturbs cell fate (1,2). However, the mechanism of processes as seemingly simple as cell spreading is not comprehensively deciphered. Although a hydrodynamic description of cell spreading at early stages is commonly accepted, the origin of the driving force and the dissipation mechanism are still under debate. Cuvelier et al. (3) proposed a macroscopic model in which a global adhesive power accounts for the driving force of cell spreading before lamellipodium extension. More recently, lamellipodium extension was modeled by a hydrodynamic model based on experimental data and simulations (4,5), and in this case the driving force is attributed to actin filaments pushing the membrane forward. Interestingly, both approaches lead to the same power law of spreading area as a function of time, and the spreading dynamics are characterized by the same characteristic time that depends on medium viscosity, thickness of the actin structure (cortex or lamellipodium thickness), and membrane tension. Note that different models taking into account the additional complexity of focal adhesion and stress fibers during spreading are reviewed in Loosli et al. (6).
To gain quantitative insight into the mechanical properties of the cell cortex, we designed a cortex-biomimicking system made of a liposome filled with the actin machinery (7). Actin is assembled at the inner membrane of a liposome and forms a thin shell. We study how such liposomes deform upon adhesion on a surface and show that their spreading dynamics depend on the cortex morphological properties. We show that early spreading of liposomes can be well described by distinct power laws depending on the homogeneity of the actin cortex. Remarkably, by using the coarse-grained hydrodynamic model with adhesion as a driving force, we find that our liposomes decorated with an underlying cortex reproduce the spreading behavior of eukaryotic cells.
Materials and Methods
Proteins and reagents
Actin, Arp2/3, VCA-GST, gelsolin, and ADF/cofilin were purchased from Cytoskeleton (Denver, CO) and used without further purification. Alexa Fluor 594-labeled actin (red actin) and Alexa Fluor 488-labeled actin (green actin) were from Molecular Probes (Eugene, OR). N-WASP fragment WWA (aa400-501) was expressed as a recombinant protein with an N-terminal His6 tag out of a plasmid that was a gift from Dr. Mullins' laboratory (Department of Cellular and Molecular Pharmacology, University of California) (see Zalevsky et al. (8)). We call this fragment “VVCA-His” in the following. Dextran (from Leuconostoc mesenteroides average mol wt 35,000–45,000), casein (β-casein from bovine milk), polyhistidine, dithiothreitol (DTT), and diazabicyclo (2,2,2)octane (Dabco) were obtained from Sigma-Aldrich (St. Louis, MO).
Lipids
L-α-phosphatidylcholine from egg yolk (EPC), cholesterol, and 1,2-dioleoyl-sn-glycero-3-{[n(5-amino-1-carboxypentyl)iminodiacetic acid]succinyl}nickel salt (DOGS-NTA-Ni) were purchased from Avanti Polar Lipids (Alabaster, AL).
Buffers and protein solutions
The proteins mix was first placed in a buffer corresponding to nonpolymerizing conditions, maintaining actin in its globular (G) form; we call this buffer the IG-buffer, and it was made of 0.2 mM ATP, 0.1 mM CaCl2, 10 mM HEPES (pH 7.6), 100 mg/mL dextran, 1 mM DTT, 0.5 mM Dabco, and 280 mM sucrose. Proteins were added to the IG-buffer at 4°C to a final total volume of 10 μL, with the following concentrations: 0.24 μM Arp2/3, 0.1 μM gelsolin, 4 μM ADF-cofilin, 13 μM G-actin (including 20% fluorescently labeled actin), and 2.2 μM VVCA-His. Note that some of the experiments seen later in Fig. 5 D were done with VCA-GST instead of VVCA-His with no visible difference in cortex formation. These 10 μL were added at 4°C to 10 μL of the polymerization buffer (IP-buffer) containing 10 mM ATP, 4 mM MgCl2, 10 mM HEPES (pH 7.6), 100 mg/mL dextran, 1 mM DTT, 0.5 mM Dabco, 100 mM KCl, and 70 mM sucrose.
Figure 5.
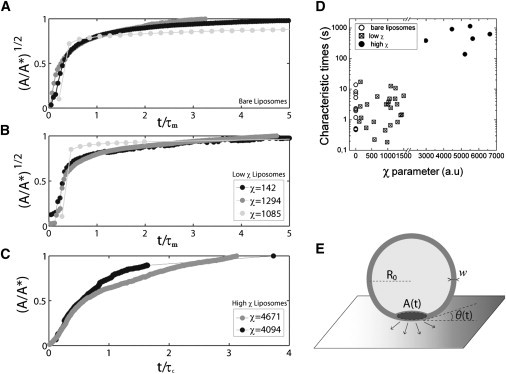
Spreading dynamics of liposomes with varying actin content. Spreading of (A) bare, (B) low χ, and (C) high χ liposomes on polyhistidine-coated coverslips. The contact area is normalized by the steady-state spread area A∗, and the time is normalized by the fitted time constant for each curve, τm for panels A and B, and τc for panel C. (D) Fitted time constants τm for bare liposomes (open circles) and liposomes displaying a low χ (squares), with τc for liposomes displaying a high χ (solid circles) as a function of the χ-value. Bare liposomes correspond to χ = 0. (E) Schematic representation of an adhered liposome during early spreading with notations.
Actin polymerization was triggered upon heating up the sample to room temperature. In this condition, the entire inside solution (I′-solution) reached the following concentrations: 5 mM ATP, 2 mM MgCl2, 10 mM HEPES (pH 7.6), 50 mg/mL dextran, 1 mM DTT, 0.5 mM Dabco, 50 mM KCl, 0.05 mM CaCl2, 175 mM sucrose, 0.12 μM Arp2/3, 50 nM gelsolin, 2 μM ADF-cofilin, 6.5 μM G-actin, and 1.1 μM VVCA-His. Two other buffers were used: the outside buffer (O-buffer) for the preparation of the liposomes (10 mM HEPES (pH 7.5), 2 mM MgCl2, 0.2 mM CaCl2, 0.5 mM Dabco, 1 mM DTT, 2 mM ATP, 275 mM glucose, and 0.01 mg/mL casein) and the S-buffer for the spreading experiment (same conditions as O-buffer but without casein). The osmolarities of those buffers were adjusted to 308 (IP-buffer), 306 (IG-buffer), 318 (O-buffer), and 340 mOsm (S-buffer).
Liposome preparation
Liposome preparation was inspired by Pontani et al. (7) and Pautot et al. (9) and adapted to the absence of pores. Phospholipids (EPC, cholesterol, and DOGS-NTA-Ni phospholipids at a ratio of, respectively, 53:37:10) were dissolved in mineral oil at a concentration of 0.5 mg/mL. The oil was then sonicated at room temperature in a bath for 30 min and heated to 50°C for 3 h. The mixture was finally cooled to room temperature and stored at 4°C for up to a week.
A few microliters of I-solution containing the proteins was added to the phospholipid-containing oil at a ratio of 1:200 and suspended by gentle back-and-forth pumping with a glass syringe. In separate tubes, 30 μL of oil was placed on top of the same volume of O-buffer to allow for the assembly of a monolayer of lipids at the interface. A volume of 50 μL of the emulsion was then poured on top of the oil layer of those tubes before their centrifugation (100 × g during 12 min). Finally, I′-solution-filled liposomes were obtained in a bath of O-buffer. Note that the O-buffer contains casein to passivate the plastic tube surfaces during liposome processing.
Surface coating
Glass coverslips were first rinsed with distilled water before being dried under filtered air. The obtained coverslips were used right away for the experiment. Polyhistidine was dissolved to 10 mg/mL in a 0.1 M CH3COOH solution and stored at −20°C. Before use, this solution was diluted five times in a buffer containing 10 mM PBS. Glass coverslips were treated with polyhistidine as follows: a 50 μL droplet of this solution was spread on the glass coverslip, gently covered with parafilm, and incubated in a closed box at 4°C from 3 h up to overnight. Just before use, the coverslip was washed with distilled water and dried with filtered air.
Visualization of the contact area between liposomes and substrates
A 70 μL droplet of the S-buffer was poured on the treated coverslip and 30 μL of liposomes were gently injected into this droplet. Liposomes were observed with a model No. IX70 inverted microscope and a model No. 100/N.A. 1.35 phase-contrast objective (Olympus, Tokyo, Japan). The dynamics of cell spreading was followed by time-lapse reflection interference contrast microscopy (RICM): the illumination beam wavelength was insured by a 200-W mercury lamp (OSRAM, Munich, Germany) and centered at ∼488 nm through the use of an exciter filter of a U-MWIB cube (Olympus). The beam was reflected on a simple glass slide replacing the dichromatic mirror of a classic fluorescence filter block and the diaphragm opening was narrowed. RICM allowed us to discern the adhered area of the vesicles in dark. Images were recorded with a Coolsnap ES charge-coupled device camera (three images/s; Roper Scientific, Trenton, NJ) and a Sensicam QE camera (50–100 images/s; PCO, Kelheim, Germany) driven by MetaMorph software (Universal Imaging, Downingtown, PA). Acquired images were then converted to binary, and the contact area was measured via ImageJ (National Institutes of Health, Bethesda, MD) and custom-written MATLAB routines (The MathWorks, Natick, MA).
Characterization of cortices: morphology
The uniformity of the actin cortex was characterized as follows: the density of the actin cortex was quantified by imaging the actin fluorescence of the basal surface of each adherent liposome through epifluorescence. Because the fluorescent signal varied spatially (see Fig. 2, G and I, and Fig. S1 in the Supporting Material), we characterized its mean two-dimensional variance χ by
| (1) |
where W and H are, respectively, the width and height of the selected window (expressed in pixels), i is the fluorescence intensity of the pixel at point (x,y), and μ is the mean fluorescence value over the selected window. The pixel size was 64.5 nm. We took a two-pixel side window (W = H = 2 pixels) for an optimal definition of χ, so as to discriminate structural features in the actin cortex, but not average multiple features together. The higher the χ-value, the denser and more continuous the cortex. The case χ = 0 corresponds to actin-free liposomes. The χ-parameter is thus taken as an empirical morphological parameter.
Figure 2.
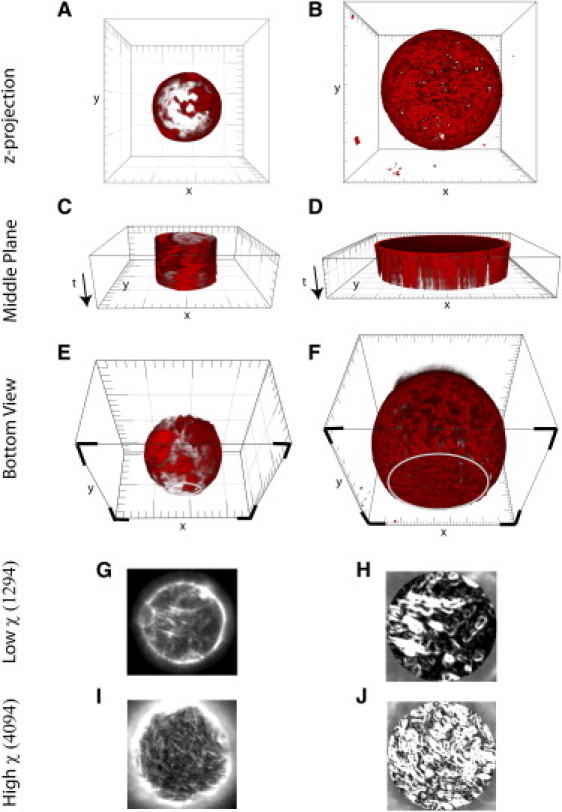
Actin cortices observed by confocal microscopy in a small liposome (radius R = 4.5 μm, left column) and in a large liposome (radius R = 18 μm, right column). (A and B) Three-dimensional top view. (C and D) Equatorial fluorescence as a function of time. (E and F) Three-dimensional bottom view, with the plane of contact indicated by the four solid corners; the open lines indicate the contour of the contact area. The small liposome (left column) appears patchier than the large one (right column). Unit square = 5 μm. (G and I) Fluorescence images of the contact area observed by epifluorescence microscopy for different value of χ. (H and J) Calculations of variance, χ in the fluorescence intensity in panels G and I, over a window of two pixels. The χ parameter characterizes the density of actin.
Confocal microscopy (A1R-A1, Eclipse Ti Inverted Microscope; Nikon, Melville, NY) was used to visualize the actin shell. The fluorescence intensity was adjusted linearly to the threshold that emphasizes the structural features of the actin cortex (using the software Imaris; Bitplane, Zurich, Switzerland). The rendering was done as a blend projection, to highlight the depth of a three-dimensional object in a two-dimensional image. The density of the cortex was characterized by two methods.
Method 1
From a qualitative viewpoint, equatorial sections of the liposomes were imaged as a function of time (see Fig. 2, C and D). If actin patches were not moving, the three-dimensional graph of the equatorial section as a function of time displayed vertical straight lines, and we concluded that the actin shell was sufficiently dense and contained overlapping Arp2/3-branched actin networks. If actin patches were diffusing as a function of time on the membrane of the liposome, we concluded that the actin shell was made of independent patches freely moving on the fluid membrane.
Method 2
Diffusion coefficients of actin patches were directly measured by monitoring the pseudo-two-dimensional displacement of micron-sized apical actin patches (see Fig. 3). This was done by identifying and segmenting local regions of high intensity as surface objects, identifying their geometric centers, and tracking them over time (using the Imaris; Bitplane). The MSD (Eq. 2 below) of the actin patches were then measured, as the difference in position r, in the time interval t, for each actin patch, i, for the entire set of actin patches (N) within the apical slice:
| (2) |
In free diffusion, the slope of the MSD (that is in the linear regime) is related to the self-diffusion constant of the actin patch, D, by
| (3) |
where d is the dimension of the system, and as we only look at diffusion within a quasi-two-dimensional optical slice, d = 2.
Figure 3.
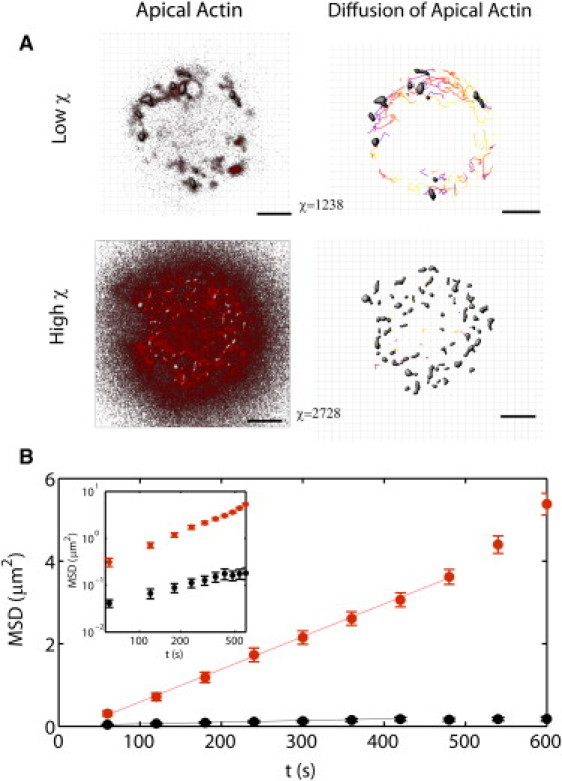
Tracking of actin patches distinguishes continuous from discontinuous cortices. (A) Fluorescent actin patches within an apical confocal slice. The actin cortex may be discontinuous with low χ (top left, the slice is taken at 31 μm from the surface), or continuous with high χ-cortices (bottom left, the slice is taken at 17 μm from the surface). Isosurface rendering and surface tracking of the actin patches maps out their trajectories over time (A, right). Shaded regions are the tracked actin patches, and the trajectories are colored to reflect time, getting darker as time progresses. Grid is 1 μm. (B) MSD for the individual surfaces in panel A, on a linear plot, and log plot (inset). (Lines) Linear fits of the MSD.
Results and Discussion
Spreading of liposomes carrying a cortex
The actin machinery was encapsulated into liposomes using an inverted emulsion technique as described in Pontani et al. (7) with the modification that instead of using pores to trigger actin polymerization, the ATP and salt were introduced in the emulsion droplets and the whole process was carried out at 4°C to avoid early actin polymerization. The reaction was triggered by heating the sample at room temperature and actin polymerization was directed to the membrane through the use of the protein fragment of the activator N-WASP (VVCA-His) carrying a histidine tag in interaction with the nickel-lipids of the membrane. A mixture of VVCA-His, actin, the Arp2/3 complex, ADF-cofilin, gelsolin, and ATP was therefore incorporated into liposomes (see Materials and Methods).
Because the liposomes contained sucrose, they sank in the glucose-containing buffer. When the liposomes containing nickel-lipids reached the histidine-coated glass substrate, they spread over the surface and we could observe them under the microscope. Their contact area with the surface was monitored by RICM as a function of time, as described in Materials and Methods. As shown in Fig. 1, the spreading area A of the liposomes increased, until steady state was approached. While the A(t) curves for all investigated liposomes roughly display the same features of an increase followed by a plateau, we may already notice that the characteristic times to approach steady state vary from seconds to hundreds of seconds. A quantitative analysis of this apparent variability requires a more detailed investigation of the cortex morphology at steady state.
Figure 1.
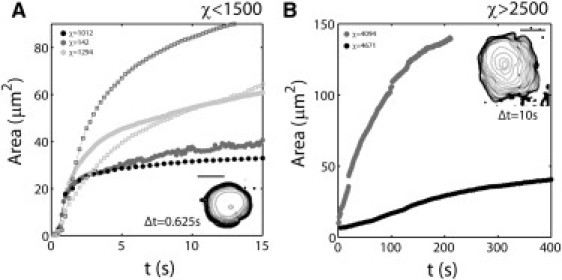
Dynamics of spreading. Area of contact as a function of time observed by RICM (A) for low χ and (B) for high χ conditions. (Insets) Time lapse of RICM outline of spreading area with indicated time interval; scale bars are 5 μm. Squares in panel A are curves for bare liposomes, solid dots are curves for different values of χ, as indicated in the insets.
Morphology of actin cortices
Confocal microscopy of the actin shells inside liposomes (see Materials and Methods) revealed that the density and fibrous morphology of the cortical actin network significantly vary between liposomes (see Fig. 2, A, B, E, and F). Yet, for a given liposome, the actin fluorescence on the adhering surface is comparable to the whole cortex, thus the heterogeneity of cortices can be characterized by the heterogeneity of the basal surface (see Fig. S1). The actin content of the basal surface of the adhered liposome can be conveniently imaged through epifluorescence (Fig. 2, G and I) and quantified by the χ parameter (Fig. 2, H and J), as defined in Materials and Methods. For a high density of repeated structures, such as small puncta or fibers, χ was >2500. Contrastingly, χ was low (χ < 1500) for regions of low density, or regions that contain empty space. The inherent stochasticity in the encapsulation of protein concentrations may be responsible for the variation in cortex morphology and χ parameter, thus providing either a patchy cortex or a more homogeneous one (Fig. 2 and Fig. S1).
However, for a spherical liposome of radius R0, because the volume of encapsulated protein scales like R03 and the surface area of the liposome scales like R02, the amount of actin deposited at the surface of the inner leaflet is expected to increase proportionally with liposome radius. Indeed we found that small liposome cortices (liposomes with radius R0 < 4 μm) are most variable, with low densities of actin present at the membrane, and isolated patches of actin that undergo diffusion along the inner membrane (Fig. 2, A, C, and E). With larger liposomes (radius R0 > 4 μm), the distribution of actin appears more uniform and actin patches hardly move along the membrane over time (Fig. 2, B, D, and F).
Diffusion was quantitatively assessed by monitoring the mean-square displacement of actin patches of ∼1 μm (±0.8 μm) in radius as a function of time (Fig. 3). Analysis was carried out for vesicles characterized by different χ parameter values. We found that the diffusion coefficient was 1.96 × 10⁻³ ± 6.17 × 10⁻⁵ μm2.s−1 for low χ cortices (χ < 1500). Following the Saffman and Delbrück formalism (10), the two-dimensional diffusion coefficient of an inclusion of radius r is directly related to the two-dimensional membrane viscosity ηm,
| (4) |
where kBT is the thermal energy, ηw the viscosity of water, and γ = 0.5772 a numerical factor. From Eq. 4 we extract a value of ηm = 1.187 × 10⁻⁶ ± 4.4 × 10⁻⁸ Pa.s., which is in good agreement with previously reported values for lipid membranes (11). By contrast, the diffusion coefficient estimated in the same framework for high χ (χ > 2500) cortices is typically one order of magnitude lower (D = 9.12 × 10⁻⁵ ± 5.35 × 10⁻⁶ μm2.s−1), which would imply a membrane viscosity one order of magnitude higher of ∼10−5 N.s.m−1 that has never been reported for lipid bilayers. This suggests that the value for the diffusion coefficient of actin patches in high χ cortices is not per se indicative of the viscosity of the lipid membrane: actin patches undergo a Brownian motion in a continuous actin cortex, which is intrinsically more viscous than a pure lipid membrane.
We thus found that our synthetic cortices can be classified in two groups based on their distinct diffusive properties, and these two groups can be characterized by the value of χ. It emerges that free two-dimensional diffusion corresponds to cases where χ < 1500, whereas slower diffusivity corresponds to χ > 2500. Transition from cortices characterized by isolated actin patches to dense cortices forming a uniform actin shell can thus be considered to occur at χc ≈ 2000. Moreover, we have already mentioned that actin-decorated liposomes exhibit two kinds of spreading kinetics (Fig. 1, A and B). Interestingly, fast spreading is observed for cortices with χ < χc, while cortices characterized by χ > χc typically spread 100 times slower. In the rest of the work, we will keep this criterion for classifying our biomimetic cortices in two groups and discuss them separately. High χ refers to χ > 2500 dense cortices whereas low χ refers to χ < 1500 and free diffusive, patchy cortices.
Shape of spread actin cortices at steady state
Confocal microscopy was also used to image the shape of adhered liposomes at steady state at the end of a spreading experiment. An example is given Fig. 4 B: actin cortices then display an adhering droplet-like shape, characterized by a contact angle θ∗. Let us note A∗ the area of the adhesive patch, and Rl the radius of the spread liposome (see scheme Fig. 4 A), both being measured at steady state. The corresponding contact angle θ∗ is defined by sinθ∗ = (A∗/π)1/2/Rl, if one assumes that the adhesive patch is shaped like a disk of radius R, which is indeed experimentally observed (Fig. 1). We find that θ∗ values are peaked around an average value of 49° ± 15° that is independent of the liposome size and χ-value. This suggests that steady state is primarily characterized by the adhesion energy between the lipid membrane and the substrate, and is insensitive to the actin content. Note that the measured contact angle may not solely reflect the specific interaction between nickel-tagged lipids and polyhistidine, because 1), we cannot rule out additional nonspecific interactions; and 2), casein, which is known as a passivating agent, is present in the liposome solution. Let us now estimate the adhesion energy.
Figure 4.
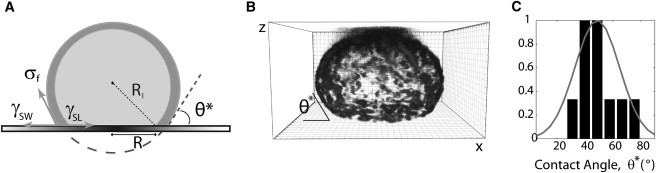
Liposome at steady state of spreading. (A) Schematic representation of an adhered liposome at steady state with notations. Surface tension (or force per unit contact length) are γSW between the solid substrate and the aqueous solution surrounding the liposome, γSL between the substrate/liposome surface, and σf is the final membrane tension. (B) The adhered liposome is observed by confocal microscopy and characterized by the contact angle θ∗ between the liposome and the coated surface. Unit square is 1 μm. (C) Contact angle θ∗ distribution for liposomes of all χ. The plot is normalized by its maximum. The average value is 〈θ∗〉 = 48.8°. The histogram is fit by a Gaussian (line) with a variance of 252.3.
An estimate of the adhesion energy at steady state
From geometric considerations on a truncated sphere with a contact angle θ∗ (Fig. 4, A and B) that keeps the same volume as the initial sphere, one finds that the relative liposome area increase is
| (5) |
with S0 = 4πR02, the surface area of the liposome before contact with the surface.
The change in membrane tension due to the increase of membrane surface area can then be numerically calculated from (12)
| (6) |
where κ is the bending rigidity (∼10 kBT), Ka is the area expansion modulus (∼200 mN/m) (12), and σf is the final membrane tension whereas σ0 is the initial membrane tension.
For θ∗ = 49° = 0.8 rad (Fig. 4 C), Eq. 5 gives ΔS/S0 ∼ 3%. Such a small variation in membrane area, however, induces an increase in membrane tension (Eq. 6) by approximately three orders of magnitude. If the initial tension of the floating liposome is in the 10−7–10−6 N/m range, because they are prepared in slightly deflating conditions (an osmotic pressure difference of ∼20 mOsm), we find that the equilibrium tension of the adhered liposome at steady state, σf, is between 3 × 10⁻⁴ and 10−3 N/m. Note that these membrane tensions, although very high, are below or close to typical values for the lysis threshold (∼10−3 N/m) (12).
In the case of liposomes, the adhesion energy density J (in Joule per square meter), which is the work per unit area required to separate the adhered liposome from the substrate, depends on the membrane tension and the interaction with the substrate, and can be defined as (13)
with γSW the surface tension between the solid substrate and the aqueous solution surrounding the liposome, and γSL the substrate/liposome surface tension. By further using Young's law (see sketch in Fig. 4 A where tensions are represented as forces per unit contact length),
| (7) |
one finds the following equation at steady state,
| (8) |
which indicates that J and σf have the same order of magnitude because θ∗ ≠ 0.
More precisely, using the values estimated above for σf, we find J to be ∼10−4 to 3 × 10⁻⁴ J/m2, which is in good agreement with reported values for similar adhesive surfaces (see references given in Cuvelier et al. (3)). Here, two remarks can be made. First, the total energy of an adhered liposome at steady state should a priori be written as the sum of two contributions: the adhesion energy JA∗ and the energy cost due to membrane bending upon spreading, which is given by the bending modulus κ. Because κ ≈ 10−19 J (12) and A∗ ≈ 100 μm2, the adhesion energy is five orders of magnitude larger than the bending energy, which means that our experimental conditions correspond to a regime of strong adhesion (14,15), for which the bending energy can be neglected. Second, the obtained estimate of J lies on the assumption that the membrane tension of liposomes increases continuously upon spreading. This hypothesis holds if liposomes keep their integrity, i.e. if no pore is formed in the membrane. In fact, pore opening would lead to tension relaxation and favor further spreading. Because pancake-like liposomes have not been observed, pore-mediated spreading of liposomes may be discarded.
Dynamics of spreading
Let us now study the details of spreading dynamics. Typical raw A(t) curves are given Fig. 1 for different liposomes with actin-rich continuous cortices (χ > 2500), and with actin-poor discontinuous cortices (χ < 1500). All spreading dynamics exhibit two discernable phases. At long times, the growth rate of the adhesion area slows down as the size of the adhesive patch approaches the steady state area A∗, regardless of the actin content of the liposomes. Contrastingly, at short times, the spreading dynamics of the liposomes strikingly differ depending on their actin content, and the increase in the spreading area is much steeper for low χ or bare liposomes (Fig. 1 A) than for high χ liposomes (Fig. 1 B). This observation prompted us to focus primarily on the early phase of adhesion and to correlate the spreading dynamics with the morphology of the reconstituted actin cortex, which is well characterized by the parameter χ.
General theoretical framework of actin cortex spreading
We now wish to dissect the mechanics of actin cortex spreading from the detailed observation of the early stages. As discussed above, at the late stage of steady state, membrane tension is higher than the initial tension of the liposome due to area increase during liposome spreading. This effect is only important at steady state whereas far from steady state, i.e., in early stage of spreading, the membrane tension of the liposomes can be considered as constant. Indeed, using Eq. 5 and the membrane tension-excess area relationship (Eq. 6), we find that σ increases by less than e-fold (e ≈ 2.7) provided that θ(t) < θc ≈ 0.5 rad. For the sake of simplicity, we will thus assume that spreading occurs at constant membrane tension σ (and then σ = σ0 the initial liposome membrane tension) if the dynamical angle θ(t) does not exceed the threshold contact angle θc.
Because the dynamical contact angle θ(t) remains small, the radius of the liposome can then be considered as the same as the liposome before spreading, R0 (see scheme in Fig. 5 E). During these early stages of spreading, the increase in liposome contact area is driven by the adhesion between the membrane and the surface, which is primarily governed by the noncompensated Young force
obtained like in Eq. 7, except that we are no longer at steady-state equilibrium and θ(t) < θ∗.
Concomitantly, liposome spreading causes dissipation through 1), a viscous flow in the liquid wedge squeezed between liposome and substrate, and 2), cortex deformation in the flat contact zone. Note here that two assumptions are made. First, membrane bending is neglected (see above). Second, diffusion of Ni-NTA lipids along the membrane is also neglected, which is valid as we focus on timescales t such that the diffusion length is smaller than the size of the contact area A∗ (16). The dynamical balance between the adhesive gain of energy (Young force) and both dissipative contributions determines the temporal evolution of the adhesive contact.
Let us now estimate each of the three contributions. Since the membrane tension increases slowly at early time (σ ≈ σ0) whereas the contact angle increases more quickly to a plateau θ ≈ θ∗, the non-compensated Young driving force per unit length is derived from Eq. 7 and reads
with θ(t) ≈ R(t)/R0 the dynamical contact angle, 0 < θ(t)< θc<θ∗ (see the scheme in Fig. 5 E), and R(t) the radius of the contact zone. In the following, we note
For a rate of change of the contact area (as the contact zone has a disklike shape), the rate of energy gain (or adhesive power) for this driving force is then
| (9) |
The opposing force due to viscous flow in the liquid wedge near the contact line can be estimated by analogy with the wetting of a solid substrate by a liquid drop, (17), where ℓ is a logarithmic factor of ∼10 and ηw is the viscosity of water. The associated energy dissipation rate is directly given by
| (10) |
The dissipation due to cortical shell flattening during spreading is of the classical form, considering that dissipation occurs in the cortical actin shell of thickness w and radius R,
| (11) |
with ηc the cortex viscosity, w the cortex thickness, and the deformation rate. This energy is dissipated in the characteristic volume of ∼R2w, which is mostly restricted to the cortex. Equation 11 then becomes
| (12) |
Finally, balancing the adhesive power (Eq. 9) with the two dissipative contributions (Eqs. 10 and 12) leads to
| (13) |
In the case of bare liposomes (χ = 0), the second term of the left-hand side of Eq. 13 is irrelevant. Equation 12 leads then to the growth law previously proposed to describe the spreading dynamics of lipid vesicles on adhesive solid surfaces (16,18).
Conversely, for high χ cortices, the first term on the left-hand side of Eq. 13 becomes negligible providing that
Taking w = 300 nm as previously measured by Pontani et al. (7), ηc = 15 Pa.s from experiments using a falling ball viscosimeter in pure actin (19) assuming that the presence of the Arp2/3 complex does not change the gel viscosity (20), and R0 ≈ 10 μm, we find that this condition is fulfilled for R > 50 nm. This approximation should thus hold over the entire spreading course of high χ cortices. Note that similar arguments have been proposed by Cuvelier et al. (3) to account for the spreading dynamics of living cells.
In the rest of this work, we will successively study the spreading dynamics of low χ and high χ cortices corresponding to the two above-mentioned limiting cases.
Spreading of bare and actin-poor (low χ) liposomes
Bare liposomes were prepared the same way as liposomes with cortices except that the proteins were omitted. Bare liposome spreading was then investigated and compared to liposomes carrying a cortex. As displayed in Fig. 1 A, the spreading characteristic time of bare liposomes is ∼1 s, similar to liposomes of low χ. We conclude that the model used for the spreading dynamics of bare liposomes should be applicable for liposomes of low χ. Equation 13 thus reduces to
| (14) |
Then, as already reported in Cuvelier and Nassoy (18), in the limit of small contact angles, Eq. 14 reads
| (15) |
with R0 the initial radius of the liposome, before contact with the substrate.
The contact angle between liposome and surface thus increases exponentially with time, and the characteristic rise time is
| (16) |
At very short times t < τm, because A ≈ π(R0 θ)2, we obtain
| (17) |
In Fig. 5, A and B, we have plotted the dimensionless parameter (A/A∗)1/2 as a function of time to compare bare liposomes with actin-poor (low χ) liposomes. First, the graphs of both kinds of liposomes are indistinguishable, which confirms that the presence of a discontinuous cortex does not significantly influence the dynamics of liposome spreading. Second, the early phase of spreading is characterized by a constant growth rate that defines 1/τm. Note, however, that τm depends on R0 and σ, which are likely to vary within a population of liposomes. Nonetheless, Fig. 5 D, which displays the histogram of the τm values derived for all liposomes characterized by χ < 1500, shows a reasonably narrow distribution with a mean value of ≈ 3.2 s. The width of the distribution may also be partly assigned to insufficient time resolution. Even though the images were acquired at a rate higher than 30 frames per second, the spreading kinetics was so fast that only few data points are usually available in the early phase. Note also that a linear fit of (A/A∗)1/2 as a function of time is then more accurate than a power law fit of A/A∗. By taking θ∗ = 49° = 0.8 rad, ℓ = 10, ηw = 10−3 Pa.s, and R0 between 4 and 40 μm, Eqs. 16 and 17 yield σ0 = 2 × 10⁻⁷ to 2 × 10⁻⁶ N/m, which is a typical value for the membrane tension of floppy liposomes and was confirmed independently by interferometric membrane fluctuation detection using optical tweezers (data not shown) (21).
In brief, the simple wetting model described above quantitatively accounts for the observed A∼t2 growth law in the early spreading phase of actin-poor liposomes. It allows us to conclude that membrane deformation, which occurs during liposome spreading, is not sensitive to the presence of a discontinuous, actin-poor cortex, but solely governed by the elastic properties of the lipid bilayer (via its membrane tension) and the viscosity of the external solution.
Spreading of actin-rich (high χ) liposomes
With increased χ, there is enhanced resistance to membrane deformation, which slows down spreading as experimentally observed (Fig. 1 B). By considering the limiting case of Eq. 13 for which the viscous flow of the cortical actin shell is dominant, we obtain
| (18) |
Remarkably, because of the characteristic spreading times in the short time phase (∼100 s) and the size of the liposomes (R0 ∼ 10 μm), the deformation rate
is ∼0.01 Hz. At these characteristic deforming frequencies, the mechanical response of cells (22) has been shown to be mostly viscous, which validates that any elastic contribution of the cortex can be neglected. Providing the additional assumption that membrane tension remains constant during the early stages of spreading (as discussed above), the growth law is expected to be
| (19) |
which gives the following expression for τc:
| (20) |
Note that in this description, all dissipation occurs in the actin shell (observed by confocal microscopy in Fig. 2) that is designed to have grown next to the membrane. This is in agreement with the rheology timescales of a cell, where elastic effects occur on a timescale of a second, whereas viscous effects occur at a timescale of 100 s. Let us have a closer look at the definition of the tension σ0: it corresponds here to the apparent tension, which is the sum of the lipid bilayer tension and a term taking into account the averaged adhesion between the membrane and the cytoskeleton, as described in Sheetz (23). Because, in living cells, the lipid bilayer tension is negligible, due to a large excess in membrane area, the apparent tension is dominated by the adhesion energy (24) (per unit surface), of ∼10−5 N/m (23). Here, the bilayer tension is nonnegligible and of ∼10−6 N/m, and thus the average adhesion energy in this work is at most on the same order. However, this means that a detachment of the membrane from the cytoskeleton, although not observed experimentally (see Fig. S2), would not change the framework of the model because it does not change the dissipation term and has a negligible effect on σ0.
To check whether Eqs. 19 and 20 could be consistent with our spreading experiments, the early stage in the A(t) curves for high χ was fitted with a power law
We found an exponent α of 1 ± 0.1 and a characteristic time τc that ranges from 100 to 1000 s for χ > 2500. Remarkably, these values are in good agreement with the characteristic times reported in previous works (4,22). The linear spreading law of our actin-rich cortices allows us to estimate an order of magnitude for the expected characteristic time τc. It only depends on three physical parameters—namely the shell thickness and viscosity, and the initial membrane tension. Taking w = 300 nm, ηc = 15 Pa.s, and σ0 = 10−7–10−6 N/m, we expect τc values to be ∼50–500 s, which is close to the range of the fitted values presented in Fig. 5 D (as we have omitted numerical factors in the derivation of τc). We conclude from this analysis that liposomes carrying a continuous cortex capture the main mechanical properties of a viscous actin shell in the early stages of spreading, as was shown in cells (3). Interestingly, the characteristic time
has the same expression of the time that characterizes lamellipodium spreading in the hydrodynamical model developed recently in Fardin et al. (4). However, in the latter model, the surface tension does not represent the true Helfrich surface tension but contains the effect of actin filament polymerization. Nevertheless, both studies point toward a unified and generic model of cell spreading where characteristic time constants and spreading power laws are the same. This remark leads us to further discuss the analogies and differences between living cells and our biomimetic cortices in the context of spreading.
Cells exhibit apparent different behaviors when spreading on substrates depending on their capacity to be motile. For highly motile cells (e.g., Dictyostelium discoideum (25)), spreading is nonmonotonic whereas for less motile cells (e.g., fibroblasts (26,27)) spreading is more regular. In both cases, the basic underlying mechanism is generally considered to be driven by actin polymerization and depolymerization. Conversely, it is now well accepted that nonmotile cells spread passively (4) like our actin shells here. However, it is of note that, even in the case of moderately motile cells, the initial phase of spreading, which precedes lamellipodium formation and typically lasts 5–30 min (see (4) and references therein) has also been shown to be governed by passive, viscous dissipation of the actin cortex. Thus, we propose that our liposomes are good candidates to investigate either the behavior of nonmotile cells or the early stages of spreading of motile cells that subsequently form dynamic lamellipodia.
Remarks on the late stages of spreading
We have shown that the underlying physical mechanism that controls the early phase of spreading strongly depends on the texture and homogeneity of the reconstituted cortex (as quantified by the χ-value). Contrastingly, the approach to steady state does not seem to differ for low χ and high χ liposomes (Fig. 1). A phenomenological fit with a power law of the second phase of spreading leads to a mean scaling exponent αl.t.= 0.15 ± 0.13, regardless of their actin content.
On the one hand, in the case of bare liposomes, Brochard-Wyart and de Gennes (16) have proposed that the growth of the contact area is slowed down by the increase in membrane tension upon adhesion, and is characterized by growth laws such as A∼(ln t)1/2, depending on the precise mechanism of spreading, which involves diffusion of membrane receptors and recruitment within the adhesive contact area. Note that such a behavior, which practically means that the growth is almost blocked, could be equally fitted with power laws with exponents α << 1, in qualitative agreement with our findings. On the other hand, in the case of dense actin cortices, the late time regime as described in the viscous shell model is dominated by viscous dissipation through the whole cell volume upon cell flattening, and would lead to a A∼t1/2 scaling law (3). However, although this description, which relies on the assumption of constant tension over the whole course of spreading, is very likely valid for cells that are provided with a large and variable membrane reservoir, it cannot hold for liposomes, for which spreading is accompanied with a significant increase of membrane tension, as seen above. A refined model taking into account all of these effects would thus be required to reach a comprehensive description of the spreading dynamics of biomimetic cortices at longer times.
Conclusions
In this work, we have characterized the morphology and spreading behavior of liposomes containing cortical actin. We show that the mechanical properties of these biomimetic liposomes are mostly governed by the density of the cortical shell. The design strategy that we have pursued mainly yields two kinds of model systems: the first category, which is characterized by low actin content, and more importantly by a patchy disconnected cortex, exhibits a spreading behavior similar to the one of bare liposomes. The second category is made of dense actin cortices reconstituted inside liposomes, which are shown to follow the early time spreading dynamics of entire cells.
We find that at a mesoscopic scale, the same characteristic time expression and power law apply for lamellipodium spreading in cells (4), cell cortex spreading (3), and biomimetic cortex spreading. Such biomimetic systems pave the way for a molecular description of cell spreading as was done for lamellipodium growth (5), as they are versatile systems for protein content which could serve to address the role of actin polymerization in a generic model of cell spreading.
Acknowledgments
This work was supported by a grant from the French National Agency of Research (Project ANR Blanc and Systèmes Complexes) and from a Human Frontier Science Program grant. M.M. was funded by an exchange MIT-France and a fellowship from ICAM (Institute for Complex Adaptative Matter).
Footnotes
Michael Murrell's present address is University of Chicago, Center for Integrative Science, GCIS W309, 929 E. 57th St., Chicago, IL 60637.
Lea-Laetitia Pontani's present address is Center for Soft Matter Research, Department of Physics, New York University, 4 Washington Place, New York, NY 10003.
Supporting Material
References
- 1.Kunda P., Pelling A.E., Baum B. Moesin controls cortical rigidity, cell rounding, and spindle morphogenesis during mitosis. Curr. Biol. 2008;18:91–101. doi: 10.1016/j.cub.2007.12.051. [DOI] [PubMed] [Google Scholar]
- 2.Paluch E., Piel M., Sykes C. Cortical actomyosin breakage triggers shape oscillations in cells and cell fragments. Biophys. J. 2005;89:724–733. doi: 10.1529/biophysj.105.060590. [DOI] [PMC free article] [PubMed] [Google Scholar]
- 3.Cuvelier D., Théry M., Mahadevan L. The universal dynamics of cell spreading. Curr. Biol. 2007;17:694–699. doi: 10.1016/j.cub.2007.02.058. [DOI] [PubMed] [Google Scholar]
- 4.Fardin M.A., Rossier O.M., Sheetz M.P. Cell spreading as a hydrodynamic process. Soft Matter. 2010;6:4788–4799. doi: 10.1039/c0sm00252. [DOI] [PMC free article] [PubMed] [Google Scholar]
- 5.Xiong Y., Rangamani P., Iyengar R. Mechanisms controlling cell size and shape during isotropic cell spreading. Biophys. J. 2010;98:2136–2146. doi: 10.1016/j.bpj.2010.01.059. [DOI] [PMC free article] [PubMed] [Google Scholar]
- 6.Loosli Y., Luginbuehl R., Snedeker J.G. Cytoskeleton reorganization of spreading cells on micro-patterned islands: a functional model. Philos. Transact. A Math. Phys. Eng. Sci. 2010;368:2629–2652. doi: 10.1098/rsta.2010.0069. [DOI] [PubMed] [Google Scholar]
- 7.Pontani L.L., van der Gucht J., Sykes C. Reconstitution of an actin cortex inside a liposome. Biophys. J. 2009;96:192–198. doi: 10.1016/j.bpj.2008.09.029. [DOI] [PMC free article] [PubMed] [Google Scholar]
- 8.Zalevsky J., Lempert L., Mullins R.D. Different WASP family proteins stimulate different Arp2/3 complex-dependent actin-nucleating activities. Curr. Biol. 2001;11:1903–1913. doi: 10.1016/s0960-9822(01)00603-0. [DOI] [PubMed] [Google Scholar]
- 9.Pautot S., Frisken B.J., Weitz D.A. Production of unilamellar vesicles using an inverted emulsion technique. Langmuir. 2003;19:2870–2879. [Google Scholar]
- 10.Saffman P.G., Delbrück M. Brownian motion in biological membranes. Proc. Natl. Acad. Sci. USA. 1975;72:3111–3113. doi: 10.1073/pnas.72.8.3111. [DOI] [PMC free article] [PubMed] [Google Scholar]
- 11.Cicuta P., Keller S.L., Veatch S.L. Diffusion of liquid domains in lipid bilayer membranes. J. Phys. Chem. B. 2007;111:3328–3331. doi: 10.1021/jp0702088. [DOI] [PubMed] [Google Scholar]
- 12.Evans E., Rawicz W. Entropy-driven tension and bending elasticity in condensed-fluid membranes. Phys. Rev. Lett. 1990;64:2094–2097. doi: 10.1103/PhysRevLett.64.2094. [DOI] [PubMed] [Google Scholar]
- 13.Brochard-Wyart F., de Gennes P.G. Unbinding of adhesive vesicles. C. R. Phys. 2003;4:281–287. [Google Scholar]
- 14.Seifert U., Lipowsky R. Adhesion of vesicles. Phys. Rev. A. 1990;42:4768–4771. doi: 10.1103/physreva.42.4768. [DOI] [PubMed] [Google Scholar]
- 15.Tordeux C., Fournier J.B., Galatola P. Analytical characterization of adhering vesicles. Phys. Rev. E Stat. Nonlin. Soft Matter Phys. 2002;65:041912. doi: 10.1103/PhysRevE.65.041912. [DOI] [PubMed] [Google Scholar]
- 16.Brochard-Wyart F., de Gennes P.G. Adhesion induced by mobile binders: dynamics. Proc. Natl. Acad. Sci. USA. 2002;99:7854–7859. doi: 10.1073/pnas.112221299. [DOI] [PMC free article] [PubMed] [Google Scholar]
- 17.de Gennes P.G. Wetting: statics and dynamics. Rev. Mod. Phys. 1985;57:827–863. [Google Scholar]
- 18.Cuvelier D., Nassoy P. Hidden dynamics of vesicle adhesion induced by specific stickers. Phys. Rev. Lett. 2004;93:228101. doi: 10.1103/PhysRevLett.93.228101. [DOI] [PubMed] [Google Scholar]
- 19.MacLean-Fletcher S.D., Pollard T.D. Viscometric analysis of the gelation of Acanthamoeba extracts and purification of two gelation factors. J. Cell Biol. 1980;85:414–428. doi: 10.1083/jcb.85.2.414. [DOI] [PMC free article] [PubMed] [Google Scholar]
- 20.Nakamura F., Osborn E., Stossel T.P. Comparison of filamin A-induced cross-linking and Arp2/3 complex-mediated branching on the mechanics of actin filaments. J. Biol. Chem. 2002;277:9148–9154. doi: 10.1074/jbc.M111297200. [DOI] [PubMed] [Google Scholar]
- 21.Betz T., Lenz M., Sykes C. ATP-dependent mechanics of red blood cells. Proc. Natl. Acad. Sci. USA. 2009;106:15320–15325. doi: 10.1073/pnas.0904614106. [DOI] [PMC free article] [PubMed] [Google Scholar]
- 22.Wottawah F., Schinkinger S., Käs J. Optical rheology of biological cells. Phys. Rev. Lett. 2005;94:098103. doi: 10.1103/PhysRevLett.94.098103. [DOI] [PubMed] [Google Scholar]
- 23.Sheetz M.P. Cell control by membrane-cytoskeleton adhesion. Nat. Rev. Mol. Cell Biol. 2001;2:392–396. doi: 10.1038/35073095. [DOI] [PubMed] [Google Scholar]
- 24.Dai J.W., Sheetz M.P. Membrane tether formation from blebbing cells. Biophys. J. 1999;77:3363–3370. doi: 10.1016/S0006-3495(99)77168-7. [DOI] [PMC free article] [PubMed] [Google Scholar]
- 25.Heinrich D., Youssef S., Gerisch G. Actin-cytoskeleton dynamics in non-monotonic cell spreading. Cell Adh. Migr. 2008;2:58–68. doi: 10.4161/cam.2.2.6190. [DOI] [PMC free article] [PubMed] [Google Scholar]
- 26.Döbereiner H.G., Dubin-Thaler B., Sheetz M.P. Dynamic phase transitions in cell spreading. Phys. Rev. Lett. 2004;93:108105. doi: 10.1103/PhysRevLett.93.108105. [DOI] [PubMed] [Google Scholar]
- 27.Dubin-Thaler B.J., Giannone G., Sheetz M.P. Nanometer analysis of cell spreading on matrix-coated surfaces reveals two distinct cell states and STEPs. Biophys. J. 2004;86:1794–1806. doi: 10.1016/S0006-3495(04)74246-0. [DOI] [PMC free article] [PubMed] [Google Scholar]
Associated Data
This section collects any data citations, data availability statements, or supplementary materials included in this article.