

Abstract
Objective
Low-frequency repetitive transcranial magnetic stimulation (rTMS) is emerging as a therapeutic tool in epilepsy. In recent years, several open-label trials have shown an encouraging reduction in seizure frequency in patients with epilepsy. However, the data from controlled trials are mixed with respect to antiepileptic rTMS efficacy, and the field would benefit from further carefully controlled trials. Prior to initiating new trials, it is important assess the magnitude of the placebo effect of presently used sham rTMS methods.
Methods
We systematically analyzed individual subject data from three placebo-controlled trials and measured the placebo effect at follow-up intervals of 2, 4, and 8 weeks after sham rTMS treatment. Given the relatively small subgroup sample size, placebo condition data were pooled for analysis.
Results
Three methods for sham rTMS were employed in the reviewed studies: (1) coil positioning orthogonal to the scalp, (2) a spring-loaded sham coil, and (3) a double active-sham coil. The placebo response overall was consistently low across follow-up intervals, both for median change in seizure frequency (Kruskal-Wallis, P>0.4, df = 2) and for responder (defined as ≥50% seizure frequency reduction) rate (Fisher's exact rest, P>0.9, df = 2). The aggregate effect of the placebo condition was a 0–2% median seizure reduction rate and a responder rate of 16–20%.
Conclusion
We anticipate that these data will contribute to future power analysis as well as selection and design of sham rTMS methods for controlled rTMS trials.
Keywords: Repetitive transcranial magnetic stimulation, Epilepsy, Placebo
1. Introduction
Transcranial magnetic stimulation (TMS) is a noninvasive method for focal electrical brain stimulation whereby small intracranial electrical currents are generated by a rapidly changing extracranial magnetic field [1]. Low-frequency (0.3–1 Hz) repetitive TMS (rTMS) can induce a lasting reduction in cortical excitability and has plausible therapeutic potential for epilepsy [2]. In recent years, several open-label trials have shown that low-frequency rTMS may reduce seizure frequency in patients with refractory epilepsy [3–8]. However, there are only three published placebo-controlled trials, each employing distinct rTMS protocols and subject selection, with inconsistent conclusions. The first found that the clinical effect of rTMS was mild and short-lived [9]. The second showed significant seizure reduction and improvement of the interictal EEG in the treated group, relative to sham [10]. The third concluded that active rTMS was no better than placebo for seizure reduction, but that it significantly reduced interictal EEG epileptiform abnormalities [11]. These inconsistent findings with respect to seizure suppression in the controlled trials, as well as the discrepancy between the open-label and controlled data, suggest that further placebo-controlled trials of rTMS in epilepsy are necessary to fully characterize its antiepileptic potential.
Estimation of the placebo effect of rTMS is necessary for future trial design, particularly for power analyses and sample size calculations. In addition, because of the limitations of available sham rTMS methods, it is important to investigate whether there are differences in placebo effect among the sham methods used in published trials. Accordingly, we conducted a meta-analysis of individual data from placebo-controlled rTMS trials to estimate the rTMS placebo effect.
2. Methods
Using PubMed we identified three English-language publications describing placebo-controlled rTMS trials in epilepsy published from January 1990 to December 2009. The search criteria relied on the following key terms: TMS, transcranial magnetic stimulation, rTMS, repetitive transcranial magnetic stimulation, epilepsy, seizure. Individual subject data were obtained after personal communication with the corresponding author of each trial, each also a co-author of the present article [9–11]. The individual subject data were systemically analyzed to calculate the median seizure frequency before rTMS, change in seizure frequency after rTMS, and proportion of patients who showed 50% or more reduction in seizure frequency (responder rate) after rTMS treatment.
We used STATA 9.0, and SPSS 14.0 software for statistical analysis. Baseline seizure frequency and seizure frequency change after treatment were computed from average weekly seizure frequencies before and after rTMS treatment for each patient. The subject data were further categorized into three treatment groups corresponding to one of three treatment conditions: placebo rTMS (sham condition), target rTMS (where the coil was positioned directly over a superficial seizure focus), and nontarget rTMS (where the coil was not positioned directly over a cortical seizure focus). For the present analysis, stimulation over the temporal region in subjects who had an identified mesial temporal seizure focus was defined as nontarget rTMS because of the distance between the coil and the anatomic seizure focus [9].
Because the distribution of the change in seizure frequency is not symmetric around the mean (data were not normally distributed), the median was used for the definition of central tendency for this data set. For purposes of graphic analysis, we generated a forest plot for median seizure frequency change inclusive of 95% confidence interval after rTMS for each of the three treatment conditions (placebo rTMS, target rTMS, and nontarget rTMS) at posttreatment follow-up intervals of 2, 4, and 8 weeks. The confidence intervals of median seizure frequency reduction were computed with the 2500 bootstrapped median data sets using a bias-corrected method that adjusts skewness in the bootstrap sampling distribution (STATA 9.0). We also obtained the responder rate and the proportion of patients who showed a ≥50% reduction in seizure frequency for three treatment conditions and three follow-up intervals. Percentage change in seizure frequency was computed from mean weekly seizure frequency at baseline and at follow-up intervals for each individual. The median seizure frequency change was compared across groups using nonparametric Kruskal-Wallis and Mann-Whitney tests. Responder rates across groups were compared by a χ2 test.
3. Results
3.1. Data summary and placebo conditions
Our literature search confirmed three placebo-controlled anti-epileptic rTMS trials (N = 87 individual subjects). Table 1 summarizes placebo rTMS methods, rTMS parameters, and overall findings for each study. The mean baseline seizure frequency calculated from pooled placebo condition data was 8.7 seizures/week (95% CI = 5.7–11.8). Follow-up data for 2 and 4 weeks after rTMS were available in all three trials; however, follow-up data for 8 weeks after treatment were available for only two of the three trials (N = 44 subjects from Fregni et al. [10] and Theodore et al. [9]). Each of the three referenced trials employed a distinct placebo rTMS method. Theodore et al. [9] used a figure-of-eight coil angled at 90° away from the scalp for control patients (placebo N = 11). Fregni et al. [10] used a specially designed spring-loaded figure-of-eight sham coil (Medtronic, Minneapolis, MN, USA), which produced a loud click, but did not induce any intracranial current (placebo N = 9). Most recently, Cantello et al. [11] applied two adjacent circular coils where only one was active and the subject was blind as to which was positioned over the scalp (placebo N = 43). Although three different methods for placebo rTMS were employed, the change in seizure frequency attributable to placebo rTMS was similar across studies (Kruskal-Wallis, P>0.2, df = 2). Thus, for further analysis, because of a relatively small sample size, we combined placebo rTMS data from the three studies.
Table 1.
Controlled antiepileptic rTMS trials.
| Theodore et al. [9] | Fregni et al. [10] | Cantello et al. [11] | |
|---|---|---|---|
| Year | 2002 | 2006 | 2007 |
| Number of subjects (condition) | 12 (treatment) | 12 (treatment) | 43 (crossover study) |
| 11 (placebo | 9 (placebo) | ||
| Age, mean ± SD | 40 ± 14 | 21.9 ± 8.1 | 36.9 ± 13 |
| Gender | 13 women, 11 men | All women | All men |
| rTMS frequency (Hz) | 1 | 1 | 0.3 |
| Number of stimuli | 900/train | 1200/train | 500/train |
| Intensity | 120% Motor threshold | 70% Machine output | 100% Motor threshold (N=34) |
| 65% Machine output (N=9) | |||
| Coil | Figure-of-eight | Figure-of-eight | Circular |
| Sham rTMS method | Coil positioning orthogonal to scalp | Spring-loaded sham coil | Double active-sham coil |
| Duration (min) | 15 | 20 | 30 |
| Intertrain interval (s) | Not reported | Not applicable | 30 |
| Session schedule | 1 train twice daily for 1 week | 1 train daily for 5 days | 2 trains per day for 5 days |
| Coil position | Seizure focus | Cz/vertex (N=3) | Vertex |
| Seizure focus (N=9) | |||
| Number of ≥50% seizure frequency reduction responders at earliest reported follow-up period | 4 of 12 (33.3%) in treatment group and 2 of 11 (18.2%) in placebo group at 2 weeks of follow-up | 11 of 12 (91.7%) in treatment group and 0 of 9 in placebo group at 2 weeks of follow-up | 6 of 43 (13%) in treatment session and 8 of 43 in placebo session (18.6%) at 2 weeks of follow-up |
Note. Use of AEDs was continued during rTMS. Where available in the reference, 10–20 International System for EEG electrode placement was used to indicate coil position. Otherwise, the authors' description of coil position is provided.
3.2. Change in seizure frequency after placebo repetitive transcranial magnetic stimulation
The pooled data reveal that median seizure frequency was essentially unchanged by placebo rTMS. Following placebo rTMS (N=63 subjects), the overall median change in seizure frequency, calculated per subject at each of the three posttreatment follow-up intervals, was consistently low (Fig. 1): 2% median reduction (N=63, 95% CI=0–6%) at 2 weeks; 0% median reduction (N=63, 95% CI=4-0%) at 4 weeks; and 0% median reduction (N=20, 95% CI=(0–7%) at 8 weeks after treatment (Kruskal-Wallis, p>0.4, df=2).
Fig. 1.
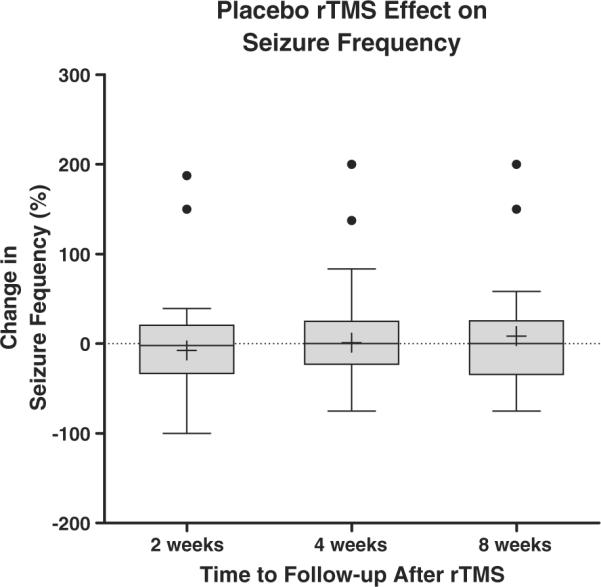
Change in seizure frequency following placebo rTMS. Box plots with Tukey error bars are shown. Central boxes represent data within the second and third quartiles. Central horizontal lines in boxes are medians. Whiskers mark limits of 3/2 interquartile (first and third quartiles) distance. +, Mean value in the data set. Filled circles represent outlier data points >3/2 outside the first and third interquartile range. The lowest and highest horizontal lines outside the box represent minimum and maximum values, respectively (Kruskal-Wallis, P>0.4, df = 2).
As a second outcome measure, we evaluated the responder rate in the placebo rTMS condition (Fig. 2). Similarly, the responder rate did not differ significantly across follow-up intervals: 16% 2 weeks after treatment; 16% 4 weeks after treatment; 20% 8 weeks after treatment (Fisher's exact test, P>0.9, df = 2).
Fig. 2.
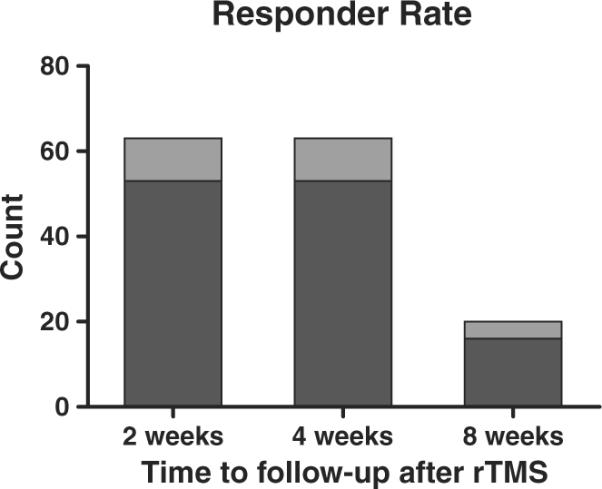
Responder rate following placebo rTMS. Dark bars represent <50% reduction in seizure frequency, and light bars, ≥50% reduction in seizure frequency. Two weeks after rTMS, 10 of 63 subjects showed ≥50% reductions in seizure frequency; 4 weeks after rTMS, 10 of 63 subjects showed ≥50% reductions in seizure frequency; 8 weeks after rTMS, 4 of 20 subjects showed ≥50% reductions in seizure frequency.
3.3. Efficacy of repetitive transcranial magnetic stimulation relative to placebo
To characterize further the placebo rTMS effect, we tested whether it could be statistically distinguished from real rTMS. The overall median changes (from pooled data) in seizure frequency were significantly greater for real rTMS than for placebo (Mann-Whitney, P>0.001). However, in these data we find differential effects across rTMS modalities and follow-up intervals (Fig. 3–Forest Plots). Nontarget rTMS (N=52 subjects), although trending toward greater reduction in seizure frequency than the placebo condition, did not significantly affect seizure frequency at any point after treatment (Mann-Whitney: P=0.774 at 2 weeks, P=0.094 at 4 weeks, P=0.113 at 8 weeks). In contrast, target rTMS, delivered directly over the seizure focus, was associated with a significantly median reduction in seizure frequency relative to placebo 2 weeks after treatment (Mann-Whitney: P>0.001 at 2 weeks, P=0.062 at 4 weeks, P=0.437 at 8 weeks).
Fig. 3. Forest Plots.

Median seizure frequency change after real and placebo rTMS. Results from each placebo rTMS-controlled trial are represented in the forest plots at three follow-up intervals after treatment. Data from each study are color-coded by treatment condition. Circles are centered on the median seizure frequency change, and each circle area is proportional to the number of patients in the treatment condition. Error bars represent 95% confidence interval. Dashed vertical lines mark overall median change in seizure frequency per treatment condition. Detailed data are as follows [9–11]:
(A) Target rTMS–Theodore et al., 2002 (N = 6, median = 41.8, 95% CI = −33.3 to 90.2%); Fregni et al., 2006 (N = 9, median = 75, 95% CI = 66.7 to 95.7%). Nontarget rTMS–Theodore et al., 2002 (N = 6, median = 22.9, 95% CI = −20 to 50%); Fregni et al., 2006 (N = 3, median = 66.7, 95% CI = 50 to 70%); Cantello et al., 2007 (N = 43, median = 2.8, 95% CI = -4.3 to 17.6%). Placebo rTMS–Theodore et al., 2002 (N = 11, median = 12.5, 95% CI = −14.3 to 86.2%); Fregni et al., 2006 (N = 9, median = 0, 95% CI = 0 to 25%); Cantello et al., 2007 (N = 43, median = 6.3, 95% CI = 2.4 to 44.6%).
(B) Target rTMS–Theodore et al., 2002 (N = 6, median = 33.5, 95% CI = −5.9 to 54.4%); Fregni et al., 2006 (N = 9, median = 47.8, 95% CI = 25.7 to 80%). Nontarget rTMS–Theodore et al., 2002 (N = 6, median = −1.7, 95% CI = −26.3 to 71.1%); Fregni et al., 2006 (N = 3, median = 66.7, 95% CI = 66.7 to 90%); Cantello et al., 2007 (N = 43, median = 6.3, 95% CI = 0 to 23.9%). Placebo rTMS–Theodore et al., 2002 (N = 11, median = 18.8, 95% CI = −3.8 to 74.4%); Fregni et al., 2006 (N = 9, median = 0 to 95% CI = −40 to 0%); Cantello et al., 2007 (N = 43, median = −4.4, 95% CI = −13.2 to 10.1%).
(C) Target rTMS–Theodore et al., 2002 (N = 6, median = 34.8, 95% CI = 15.4 to 100%); Fregni et al., 2006 (N = 9, median = 50, 95% CI = 40 to 90%). Nontarget rTMS–Theodore et al., 2002 (N = 6, median = 22.9, 95% CI = −40.1 to 42.6%); Fregni et al., 2006 (N = 3, median = 66.7, 95% CI = (66.7 to 90%). Placebo rTMS–Theodore et al., 2002 (N = 11, median = 17.4, 95% CI = −11.5 to 58.6%); Fregni et al. 2006 (N = 9, median = 0, 95% CI = −30 to 0%).
As with the median change in seizure frequency, the overall responder rates were significantly greater for real rTMS than for the placebo condition (Pearson's χ2 = 8.2, P = 0.004) (Fig. 3–Bar Graphs). When separated by rTMS modality, the overall responder rate for target rTMS was significantly higher than that for placebo rTMS (Pearson's χ2 = 19.8, P>0.001), whereas nontarget rTMS did not significantly differ from placebo rTMS (Pearson's χ2 = 1.8, P = 0.184). Further, nontarget rTMS did not significantly affect the responder rate at any time point (Pearson's χ2: P = 0.636 at 2 weeks, P = 0.328 at 4 weeks; continuity-corrected χ2: P = 0.361 at 8 weeks), whereas target rTMS elicited a significantly higher responder rate relative to placebo 2 weeks after treatment (continuity-corrected χ2: P>0.001 at 2 weeks, P = 0.239 at 4 weeks, P = 0.359 at 8 weeks).
4. Discussion
In the present review of individual subject data from three controlled trials, we find that the placebo rTMS effect is relatively small and consistent over a range of posttreatment follow-up intervals. Our estimate suggests a 0–2% median change in seizure frequency attributable to placebo rTMS conditions, where the appearance and sound of the stimulating coil are approximated without inducing appreciable intracranial electrical current.
We note that with small subgroup sample sizes as we have here, calculating a change in seizure frequency, even with bootstrap methods, may lead to spurious values. This uncertainty in our estimate is illustrated by the wide 95% CI values in the forest plot of Fig. 3, which underscores the uncertainty of any estimate derived from the available data. For this reason, to improve outcome validity, our statistical analyses and calculations of responder rates were performed on pooled data rather than data within individual trials.
The placebo responder rate (16–20%) at follow-up intervals of 2, 4, and 8 weeks is within the range of other placebo conditions in epilepsy trials [12]. We note that this change in seizure frequency is consistent with the identified responder rate and may be related to normal intrasubject seizure frequency variability. In other words, because seizure frequency for any single subject is rarely constant, in a population of patients there will be a proportion of subjects who will experience a reduction in seizures after any treatment; thus, a positive responder rate is expected with most placebo clinical trial conditions.
Repetitive TMS, in principle, carries the potential for a sizeable placebo effect, as the procedure involves a large and loud device and physical contact of the operator with the subject. Additionally, low-frequency rTMS is a relatively lengthy procedure, generally in the range of 30–45 minutes for the entire session, during which the patient interacts verbally with the treating physician or technologist, which also may serve to augment the placebo effect. In this regard, our results, showing a relatively modest placebo response, are encouraging and can inform future study designs.
Another important discussion point is whether the low placebo rTMS response reflects unblinding during the trial. For instance, the Cantello et al. trial involved a crossover study design in which subjects could deduce which treatment they were receiving if the placebo rTMS experience was not identical to real rTMS [11]. It is plausible that subjects may have become unblinded by the real rTMS testing of motor threshold, or learned that rTMS is associated with a tapping sensation over the scalp. In part, these will remain valid concerns as the available sham rTMS technology does not yet completely mimic the real rTMS experience for the subject and operator. However, the large placebo rTMS effect size in major depression, comparable to antidepressant drug trials, suggests that unblinding is not an adequate explanation for the small observed rTMS placebo effect in epilepsy trials, and that the effect may be disease specific [13].
In rTMS epilepsy trials, placebo responses may be due to nonspecific effects such as: (1) natural cyclical fluctuation of seizure frequency; (2) regression to the mean, particularly if the selected population has severe symptoms at the start of a trial; and (3) therapist and observer bias. Therefore, future rTMS trials may benefit from inclusion of objective outcome measures such as severity of epileptiform abnormalities on the EEG.
A complete analysis of rTMS antiepileptic efficacy is limited by the small number of available placebo-controlled trials which differ in subject selection and rTMS. Given these limited published data, we propose that rTMS antiepileptic efficacy will have to be determined in future randomized placebo-controlled trials, which may use the results from this estimate of the rTMS placebo effect for power analysis and trial design.
Acknowledgments
A.R. acknowledges the Siegel Family Fund for Epilepsy Research for support. A.P.L. received support through National Institutes of Health Grants K24 RR018875 and UL1 RR025758.
Footnotes
Ethical approval We confirm that we have read the Journal's position on issues involved in ethical publication and affirm that this report is consistent with those guidelines.
Conflict of interest statement None of the authors has any conflict of interest to disclose.
References
- [1].Kobayashi M, Pascual-Leone A. Transcranial magnetic stimulation in neurology. Lancet Neurol. 2003;2:145–56. doi: 10.1016/s1474-4422(03)00321-1. [DOI] [PubMed] [Google Scholar]
- [2].Theodore WH. Transcranial magnetic stimulation in epilepsy. Epilepsy Curr. 2003;3:191–7. doi: 10.1046/j.1535-7597.2003.03607.x. [DOI] [PMC free article] [PubMed] [Google Scholar]
- [3].Daniele O, Brighina F, Piazza A, Giglia G, Scalia S, Fierro B. Low-frequency transcranial magnetic stimulation in patients with cortical dysplasia - a preliminary study. J Neurol. 2003;250:761–2. doi: 10.1007/s00415-003-1080-6. [DOI] [PubMed] [Google Scholar]
- [4].Fregni F, Thome-Souza S, Bermpohl F, et al. Antiepileptic effects of repetitive transcranial magnetic stimulation in patients with cortical malformations: an EEG and clinical study. Stereotact Funct Neurosurg. 2005;83:57–62. doi: 10.1159/000086674. [DOI] [PubMed] [Google Scholar]
- [5].Kinoshita M, Ikeda A, Begum T, Yamamoto J, Hitomi T, Shibasaki H. Low-frequency repetitive transcranial magnetic stimulation for seizure suppression in patients with extratemporal lobe epilepsy-a pilot study. Seizure. 2005;14:387–92. doi: 10.1016/j.seizure.2005.05.002. [DOI] [PubMed] [Google Scholar]
- [6].Joo EY, Han SJ, Chung S-H, Cho J-W, Seo DW, Hong SB. Antiepileptic effects of low-frequency repetitive transcranial magnetic stimulation by different stimulation durations and locations. Clin Neurophysiol. 2007;118:702–8. doi: 10.1016/j.clinph.2006.11.008. [DOI] [PubMed] [Google Scholar]
- [7].Menkes DL, Gruenthal M. Slow-frequency repetitive transcranial magnetic stimulation in a patient with focal cortical dysplasia. Epilepsia. 2000;41:240–2. doi: 10.1111/j.1528-1157.2000.tb00146.x. [DOI] [PubMed] [Google Scholar]
- [8].Tergau F, Naumann U, Paulus W, Steinhoff BJ. Low-frequency repetitive transcranial magnetic stimulation improves intractable epilepsy. Lancet. 1999;353:2209. doi: 10.1016/S0140-6736(99)01301-X. [DOI] [PubMed] [Google Scholar]
- [9].Theodore WH, Hunter K, Chen R, et al. Transcranial magnetic stimulation for the treatment of seizures: a controlled study. Neurology. 2002;59:560–2. doi: 10.1212/wnl.59.4.560. [DOI] [PubMed] [Google Scholar]
- [10].Fregni F, Otachi PTM, Do Valle A, et al. A randomized clinical trial of repetitive transcranial magnetic stimulation in patients with refractory epilepsy. Ann Neurol. 2006;60:447–55. doi: 10.1002/ana.20950. [DOI] [PubMed] [Google Scholar]
- [11].Cantello R, Rossi S, Varrasi C, et al. Slow repetitive TMS for drug-resistant epilepsy: clinical and EEG findings of a placebo-controlled trial. Epilepsia. 2007;48:366–74. doi: 10.1111/j.1528-1167.2006.00938.x. [DOI] [PubMed] [Google Scholar]
- [12].Beyenburg S, Stavem K, Schmidt D. Placebo-corrected efficacy of modern antiepileptic drugs for refractory epilepsy: systematic review and meta-analysis. Epilepsia. 2010;51:7–26. doi: 10.1111/j.1528-1167.2009.02299.x. [DOI] [PubMed] [Google Scholar]
- [13].Brunoni AR, Lopes M, Kaptchuk TJ, Fregni F. Placebo response of non-pharmacological and pharmacological trials in major depression: a systematic review and meta-analysis. PLoS One. 2009;4:e4824. doi: 10.1371/journal.pone.0004824. [DOI] [PMC free article] [PubMed] [Google Scholar]