

Abstract
We report on the characterization of actin driven lamellipodial protrusion forces and velocities in keratocytes. A vertically mounted glass fiber acted as a flexible barrier positioned in front of migrating keratocytes with parallel phase contrast microscopy. A laser beam was coupled into the fiber and allowed detecting the position of the fiber by a segmented photodiode. Calibration of the fiber was carried out with the thermal oscillation method. Deflection and force signals were measured during lamellipodial protrusion. Velocity was constant during initial contact whereas loading force increased until finally the cell was stalled at higher forces. Stall forces were on the order of 2.9 ± 0.6 nN, which corresponds to a stall pressure of 2.7 ± 1.6 nN/μm2. Assuming a density of actin filaments of 240 filaments per μm, we can estimate a stall force per actin filament of 1.7 ± 0.8 pN. To check for adaption of the cell against an external force, we let the cell push toward the glass fiber several times. On the timescale of the experiment (∼1 min), however, the cell did not adapt to previous loading events.
Introduction
Cell migration is involved in many physiological and pathological processes such as immune response, wound healing, embryonic growth processes, and cancer (1). Cell migration with a protruding lamellipodium can be envisaged by the simultaneous action of several components: the protrusion of the lamellipodium is accompanied by the release and reformation of adhesion points to the substratum as well as the contraction of the cell body (2). The machinery driving the lamellipodium forward is an actin network with the barbed ends polymerizing toward the direction of membrane protrusion. This lamellipodial actin network is supposed to be highly branched due to the presence of the Arp2/3 complex (3), which possibly binds to existing actin filaments and nucleates new actin filaments as side branches (4). However, the mechanism is still under discussion. The details of this process are not well understood, even to the extent that a recent study doubted the reported branching of the actin network inside the lamellipodium and considered these previous results as a preparation artifact (5). Regeneration of actin monomers is achieved by a constant disassembly of the network at the rear side of the lamellipodium, supported by several proteins such as ADF/cofilin (3).
A number of models have been developed to describe the detailed mechanisms of cell motility and force generation based on directed actin polymerization in the lamellipodium of crawling cells (6). The Brownian ratchet models describe force generation by a rectification of thermal fluctuations of the membrane due to monomer addition to actin filaments (7–9). When including other effects, like membrane tension, the shape of migrating cells can be understood in a very concise way (10). A model for a hypothetical end-tracking motor has been developed, in which actin filament elongation against a load is facilitated by motor proteins and the hydrolysis of energy-rich molecules (11). Another model, referred to as autocatalytic branching, describes the growth of an actin network against a loading force with a filament branching rate proportional to the number of existing filaments (12,13). Furthermore, Brownian dynamics simulations have been used to simulate the growth of an actin network with the branch promoting complex Arp2/3 against a disk at variable load forces (14). Most of the models predict F-v relationships, describing the velocity of the network growth as a function of the applied force exerted by an obstacle (15).
The only study, where F-v curves of the lamellipodial protrusion were actually measured, reported a complex shape of the F-v curve with an initial sharp drop of velocity followed by a regime, where the velocity of the lamellipodium was constant and independent of the applied force until the lamellipodium was stalled completely at higher forces (16). This experimental data have been used to develop a model that includes the effects of excluded volume and adhesion to the substrate to reproduce the observed force velocity data (15). A different study investigated F-v curves using artificial branched actin networks (17). There, Parekh and coauthors reported concave (bending down) F-v curves as well as an interesting history dependent behavior. When a force was applied to a growing actin network, with a subsequent lowering of the force, the growth velocity of the network was increased afterward. This was interpreted as an indicator for the autocatalytic branching model, which predicts an increasing network density as a response to a force (13,17).
In this study, F-v curves with higher force resolution (∼10 pN) than in our previous study (16) were determined by using glass fibers as a vertical barrier for the lamellipodium of keratocytes (Fig. 1). These cells are well suited for the investigation of motility, because they move relatively fast (several μm/min) while keeping a constant direction. The glass fibers used as barrier were calibrated with the thermal fluctuations method (18) as often used in atomic force microscopy (AFM). A laser beam was coupled into the glass fiber and allowed a very accurate determination of the position of the fiber with simultaneous phase contrast video-microscopy. By analysis of the data the lamellipodial stall pressure and the stall force per filament could be obtained, both important parameters for further biophysical modeling of the lamellipodial protrusion. The influence of the loading history on the growth velocity was investigated by performing repetitive F-v measurements at the same spot of the lamellipodium by retracting the fiber from the direction of the migrating cell several times.
Figure 1.
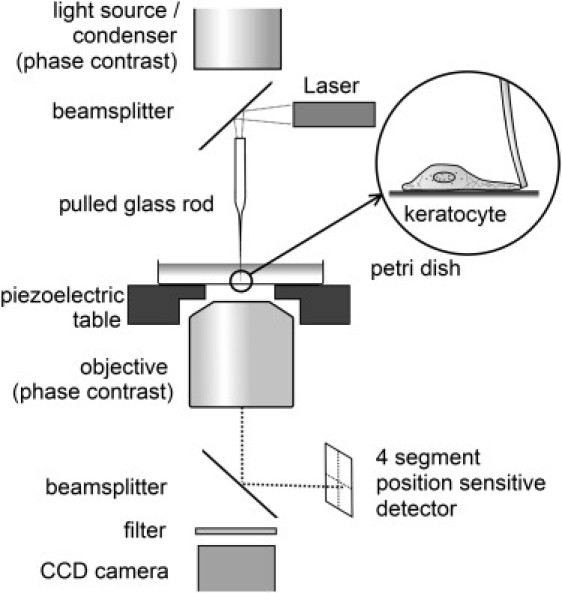
Force microscopy setup for measurement of keratocyte lamellipodial protrusion forces. A laser beam was coupled into a pulled glass rod with a diameter of 5–10 μm at its apex. The thin fiber end of the glass rod was used as a flexible obstacle toward which keratocytes are migrating. The deflection of the fiber was detected on a segmented photo detector.
Materials and Methods
Primary cell culture of keratocytes
Start medium was prepared by mixing 45.6% (v/v) RPMI medium 1640 without phenol red (11835-030, Biochrome, Berlin, Germany), 9.7% heat inactivated fetal bovine serum, 36.3% Fish-Ringer buffer (0.22 mM NaCl, 4 mM KCl, 4.8 mM NaHCO3, 2 mM CaCl2, and 2 mM Tris), 2.6% Steinberg-medium (0.52 M NaCl, 3 mM Ca(NO3)2, 6 mM KCl, and 8.6 mM MgSO4), 3.1% penicillin/streptomycin solution (100×, Sigma, St. Louis, MO), 2.4% 1 M HEPES, and 0.3% water. Running medium consisted of 16.4% (v/v) Fish-Ringer buffer, 0.8% Steinberg-medium, 0.8% 1 M HEPES, and 82% water.
A gold fish (Carassius auratus) was narcotized for a short time (<4 min) by introducing the fish in cold water (4–6°C) with 320 μL/L clove oil as anesthetic as described in greater detail elsewhere (19). A scale was drawn with forceps and the fish relocated to the aquaculture. The scale was washed several times with start medium, placed in a petri dish and covered with a small glass slide. Start medium (100 μL) was added into the space between glass slide and petri dish, and 700 μL of start medium were added on a piece of filter paper placed inside the petri dish to prevent drying. The petri dish was closed and incubated at 16°C. After 2 days, newly formed tissue mainly consisting of keratocytes formed next to the scale. Keratocytes were isolated by adding 50 μl of a solution containing 1 g/l EDTA and 0.5 g/l trypsin for 20 s and extensive washing with start medium. Isolated keratocytes started migrating after a few minutes. For force measurement experiments the start medium was replaced by running buffer.
Fiber pulling
A solid borosilicate glass rod with a diameter of 1 mm (BR-100-10, Sutter Instrument, Novato, CA) was heated and pulled with a micropipette puller (P-97, Sutter Instrument) resulting in two pieces per glass rod, each with a thick and a thin fiber end. The thin fiber side was cut with a sharp scalpel to an end diameter of 5–10 μm. The thick end with 1 mm in diameter was polished with aluminum oxide polishing sheets (5 μm and 1 μm grit size, Thorlabs, Ely, UK).
Force measurement microscopy
An inverted optical microscope (Axiovert 135TV, Carl Zeiss MicroImaging, Jena, Germany) in phase contrast configuration was modified for single cell force measurements (Fig. 1). The microscope stage was replaced by an XYZ piezo stage with 200 μm × 200 μm × 20 μm operational range (Physik Instrumente, Germany). A laser beam (57CFM, λ = 786 nm, Schäfter & Kirchhoff, Hamburg, Germany) was focused on the polished end of a pulled glass rod by reflection on a 50% mirror in the optical path of the microscope. The laser, the pulled glass rod, and the reflecting mirror were mounted on a thick aluminum plate (omitted in Fig. 1 for simplicity) supported by three adjustable points. All parts in the optical path of the microscope were transparent (either glass or polycarbonate). The laser beam leaving the fiber end of the glass rod was detected by a segmented photodiode (UDT-4D, Osi Optoelectronics, Hawthorne, CA).
From the quadrant detector signals the horizontal and vertical fiber deflections were calculated by using a differential amplifier circuit. Deflection signals of the fiber were stored and analyzed by using a computer connected to a 16-bit analog to digital card (NI-6030E, National Instruments, McAllen, TX) with a scientific software package (IGORPro, WaveMetrics, Portland, OR). Noise reduction during the force and deflection measurements was carried out by oversampling the data with 33.3 kHz and down sampling to 6 Hz. For further analysis, the radial deflection was calculated from the vertical and horizontal deflection signals. Simultaneous phase contrast microscopy was carried out by using a CCD camera (4912-5100/0000, Cohu, Poway, CA) and a time-lapse video recorder (TL300, Panasonic, Osaka, Japan).
Calibration of the sensitivity in nm/mV was carried out by touching the surface with the fiber and moving the surface for a known distance with the piezo stage. Calibration of the spring constant of the fiber was carried out with the thermal fluctuations method (18) in air as described in the results section in greater detail. Forces were calculated from the fiber deflection according to Hooke's law.
To measure lamellipodial protrusion forces of moving keratocytes, it was necessary to position the fiber tip in close proximity to the petri dish surface without touching it. The contact point was determined by oscillating the surface in x or y direction while moving the glass fiber vertically. In contact with the surface the fiber followed the oscillation. Subsequently the fiber was retracted and positioned ∼20 nm above the surface. This procedure could be done right before the cell touched the glass fiber to assure that the distance between fiber and support was maintained during the course of the experiment.
For the repetitive force measurements, a few seconds after a change of the deflection signal due to the contact with the lamellipodium was observed, the cell was retracted horizontally for 6 μm in the direction opposite to the cell movement by using the piezoelectric stage. Only signals with a large (>75%) overlap of the lamellipodial contact regions for the subsequent runs were used for further analysis.
Results and Discussion
Calibration of glass fibers
Previously used only for AFM cantilevers, the procedure of calibrating the spring constant with the thermal fluctuations method (18) was applied here to glass fibers.
The x position of the glass fiber tip will fluctuate around its average position due to thermal motion. This is described by the equipartition theorem
| (1) |
where k is the spring constant, kB the Boltzmann constant, T the absolute temperature, and the time average of the squared position of the fiber. Thus, by measuring it is possible to determine the spring constant of the fiber. However, because every mode of the oscillating fiber contains an energy of kBT/2 and contributes to , simply measuring the average squared position would result in an underestimation of k. This problem is circumvented by calculating the Fourier transformation X(f) of the N data points of the signal x(t). According to Parseval's theorem, integration of the power spectral density over the peak for the first mode yields the mean squared deflection for this mode. For discrete data, this results in the following equation:
| (2) |
The factor of 2 arises from the fact, that the one-sided result of the Fourier transformation was used and negative frequencies were omitted. Fig. 2 shows a typical spectrum obtained from the recorded signal for a fiber. Three modes of oscillation can be observed. The first mode with a frequency of ∼620 Hz was used for calibration (the baseline of the power spectrum was subtracted). Use of Eq. 2 yielded 10−10 m and a spring constant of k = 14.3 mN/m.
Figure 2.

Power spectral density of the thermal noise of a glass fiber showing the first three modes of oscillation (labeled 1, 2, 3). Mode 2 has reduced amplitude because it actually exhibits a node at the end of the fiber, whereas mode 1 and 3 correspond to a freely moving end of the fiber. Integration over the first mode yields the mean square displacement of this mode and allows calibration of the glass fiber spring constant.
The spring constant was confirmed by calibration of the glass fiber with an AFM tip of known spring constant by using the reference spring method (data not shown) (20).
Force measurements
Fig. 3 A shows typical time courses of force and deflection signals of a migrating keratocyte hitting the glass fiber. The deflection and force measurements can be subdivided in several phases. Initially (0–27 s) the fiber was free, as indicated by fluctuations in the signal, which were presumably due to thermal and mechanical noise. At 27 s the lamellipodium hits the fiber, which is deflected until complete stall at around 35 s (Fig. 3 B). Subsequently, the deflection decreased. We assume that either the lamellipodium squeezes in the gap and slide under the glass fiber, or that neighboring parts are starting to pull on the glass fiber via the area in contact with the fiber. The former possibility is very unlikely because the gap is only of the order of 50 nm or less. At ∼75 s, the cell body touched the fiber and deflected it strongly. With further migration, the cell lost contact with the fiber and the fiber jumped back to its initial position.
Figure 3.
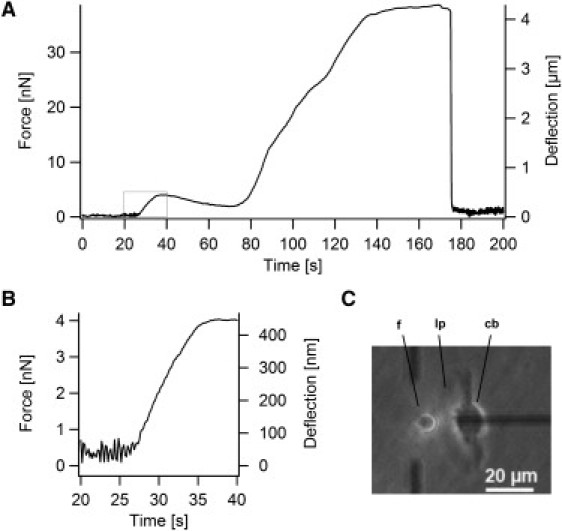
(A) Deflection and force signal of a migrating keratocyte hitting the glass fiber. The deflection (of the glass fiber) is directly measured, which corresponds also to the position of the contact point between cell and fiber. The force is obtained by multiplying the deflection with the force constant of the glass fiber, whereas the velocity can be derived as the derivative (slope) of the deflection. The initial increase in force is due to the lamellipodium touching the fiber (see boxed area in A), whereas the large force and deflection is a result of the cell body deflecting the fiber. (B) Magnification of the deflection and force signal during initial contact with the lamellipodium (boxed area in A). Initially the deflection increases roughly linear with time until the lamellipodium is stalled at higher forces. (C) Phase contrast image during force microscopy. A migrating keratocyte moves toward the fiber. Abbreviations used: cb, cell body; f, fiber; lp, lamellipodium.
The maximal force exerted by the cell body, slowing it down to v ≈ 0 was 39 nN ± 14 nN (n = 11). This is in good agreement with previously reported stall forces for keratocyte cell bodies of 34 ± 6 nN (lateral component) (21).
The stall force Fs, corresponding to the force needed to locally stop the lamellipodium to v = 0, was determined from the measurements for one fiber to be Fs = 2.91 nN ± 0.63 nN (n = 10). However, the stall force depends on the contact area between the fiber and the lamellipodium. A more general parameter is the stall pressure, which was calculated from the stall force and the contact area. The contact area was estimated from the contact along the fiber radius and the vertical contact height between lamellipodium and fiber. Typically the fiber was positioned ∼20 nm above the surface of the petri dish. Because the height of a keratocyte lamellipodium is ∼170 nm (22), the vertical contact height between fiber and lamellipodium was estimated as 150 nm. For the contact along the fiber radius only the component sp, perpendicular to the measured force had to be considered. During stall, the lamellipodium touched half of the fiber circumference, which was justified by the microscopy images. Around this position sp is close to 2r, because sp approaches 2r asymptotically at half contact. For a fiber with radius 3.5 μm an estimated contact area of 1.05 μm2 was obtained. A stall pressure of 2.7 ± 1.6 nN/μm2 resulted. Assuming a density of 241 ± 100 actin filaments per μm (23), the stall force per filament was 1.7 ± 0.8 pN. This is significantly lower than the prediction of 5 pN per actin fiber by the elastic Brownian ratchet model (8). However, it must be added that the calculation of the stall force per filament critically depends on the estimated contact area between fiber and lamellipodium. In the case of a lower contact area, higher stall forces per filament would be obtained.
By smoothing the deflection and force signals of the lamellipodium with a cubic spline and calculating the time derivative of the smoothed deflection, the velocity with which the fiber was pushed could be obtained. Fig. 4 A shows the force velocity relation corresponding to the signals shown in Fig. 3 B. In Fig. 4 B several typical F-v curves are shown, normalized to the maximum force and velocity respectively. All F-v curves have a concave (bending down) shape, with an initial increase of the measured velocity at low forces. We can show, that the initial increase in velocity is an artifact, caused by the curved geometry of the fiber. Due to the fiber curvature, the contact area between fiber and lamellipodium increases with time. Mechanically speaking, we have two elastic springs in series: 1), the glass fiber; and 2), the cell itself, due to the intrinsic stiffness of the actin cytoskeleton. Because the contact area between cell and fiber increases, the apparent stiffness of the lamellipodium increases during contact. The velocity with which the cell pushes the glass fiber depends on the ratio of the two stiffness values, therefore more and more of the lamellipodial movement is transduced to the fiber causing the initial increase of velocity (see Appendix A and B). This initial increase in velocity is also visible in Fig. 3 B for a short time after contact.
Figure 4.
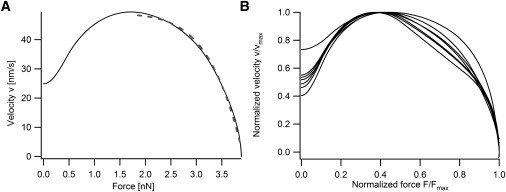
(A) Force velocity (F-v) relation of a typical experiment. The initial increase of velocity is due to the curved geometry of the glass fiber. The contact area between cell and fiber increases during initial contact, resulting in an increase of the apparent stiffness of the lamellipodium. Because the deflection of the fiber depends on the ratio of the fiber and the lamellipodial force constant, the velocity exhibits an increase. Once contact area is maximized, the effective stiffness of the lamellipodium will be constant. Therefore this relation can be characterized as follows: initially the velocity is constant and insensitive to the applied force, when the force exceeds half of the stall force, the velocity begins to decline to zero. The F-v relation was obtained by smoothing the measured deflection by a cubic spline and plotting the derivative of the smoothed deflection versus force. The dashed line represents a fit according to Keren et al. (10) (see text) with an exponent w = 6.1. (B) Normalized force velocity relations for several experimental runs. All curves show a similar behavior.
Taking this into account, the intrinsic force velocity curve of the lamellipodium can be described as follows: initially the velocity is approximately independent of the force. If the force F exceeds ∼50% of the stall force Fs (e.g., F > 0.5 Fs) the velocity decreases to stall (v = 0).
Recently, Keren et al. (10) proposed a force-velocity relationship in the form of v = v0(1 − (F/FS)w). In this function, the exponent w determines the type of the F-v relation as convex for 0 < w < 1 or concave for w > 1. Large values of w indicate a lower sensitivity of the velocity to an opposing force F approaching the stall force Fs. For small values of w the velocity rapidly drops with increasing force. Therefore, w can be used as a characteristic parameter describing the measured F-v relationship. By fitting our data for forces F > 0.5 Fs where the influence of the fiber geometry on the measurement is low, an exponent w = 6.1 ± 1.1 was obtained (Fig. 4 A). A similar value (w = 8) was determined indirectly in Keren et al. (10) by measuring the aspect ratio of fish keratocytes and their velocity.
In a previous study on the keratocyte lamellipodial protrusion, an initial decrease of measured velocity (by an average factor of ∼7) compared to the speed of the trailing edge of the cell was assumed. This was followed by a measured concave (bending down) F-v relation comparable to the F-v relation determined here (16). We conclude that the assumed initial drop of velocity in the previous study is a consequence of the measuring process itself, because it was neglected that the displacement δ = vt due to the motion of the cell is distributed between the probe (a vertically mounted AFM cantilever) and the lamellipodium. Depending on their spring constants kC and kL the displacement δ = δc + δL is transduced to the cantilever δc and the lamellipodium δL according to the ratio δC/δL = kL/kC. The effective spring constant of the lamellipodium kL in contact with the cantilever in the previous study can be estimated with the equation kL = EA/l with E, the elastic modulus, A, the contact area, and l, the length of the lamellipodium. By inserting reasonable values (E = 3.7 kPa (17), A = 0.5 μm2, and l = 2 μm (24)) a spring constant of kL = 0.925 mN follows. The cantilever spring constant in the previous study was 7 mN/m, hence the ratio kl/kc is close to 1/7. Therefore, it is obvious that the velocity of the probe is slower than that of the cell, because immediately after contact both, probe and lamellipodium, are deflected or indented respectively. In the discussed study only 1/7 of the total deflection was transduced to the cantilever, nicely corresponding to the observed average velocity drop of a factor of 7. Hence, by excluding this initial velocity drop of the previous investigation (16), our F-v curves are consistent with this study, but with highly improved force and deflection resolution.
In another study, a growing actin network with Arp2/3 mediated branching was investigated by AFM in vitro and a similar type of F-v relationship with an initial load insensitive regime was obtained. Furthermore this study revealed a 2.1-fold increase in the growth velocity of the network in the case of a second measurement after a previously applied force (17). This was taken as an indicator for the autocatalytic branching model, because according to this model, the network density is a function of the loading force and can thereby maintain a constant velocity (12,13). The increased velocity after a previously applied force was therefore interpreted as an indicator for a remodeling of the artificial actin network (17).
To examine the lamellipodium of a living cell with respect to the observed hysteresis behavior of the artificial network, we carried out repetitive measurements at the same location of the lamellipodium. In the case of a higher density of the actin network, the velocity of the measured deflection would increase in subsequent runs. A network hardening due to the increasing density would result in a higher fraction of the given cellular velocity transduced to the fiber (see also Appendix A and B).
Fig. 5 shows a measurement with the lamellipodium pushing against the fiber for three times. By linear fit, growth velocities v1 and v2 were obtained for the first and second contact with the fiber (only contact one and two were further analyzed, because a third contact could only be achieved in three experiments). A comparison of the individual growth velocity ratio v2/v1 is shown in Fig. 6. The average change in velocity was negligible with v2/v1 = 1.03 ± 0.18 (n = 10). This is also reflected in the almost identical velocities of repetitive measurements with v1 = 58 ± 22 nm/s (n = 10) and v2 = 59 ± 20 nm/s (n = 10). This behavior is in contrast to the reported history dependence of the growth velocity of an artificial actin network under an AFM cantilever (17). It must be noted that in our study the contact time between fiber and lamellipodium (e.g., time of applied force before the second contact) were rather short (∼5–10 s) and a different result in the case of a longer application of a force cannot be excluded with certainty. Due to the dynamic organization of the lamellipodium with constant changes in shape and direction, it was not possible to achieve longer times of preapplied forces with our setup. However, the highest applied forces in the repetitive measurements were close to the stall force, therefore we assume that longer contact times would have not resulted in a different behavior. Additionally, we can not exclude that adaption to a loading force may occur on a faster than our experimental timescale.
Figure 5.
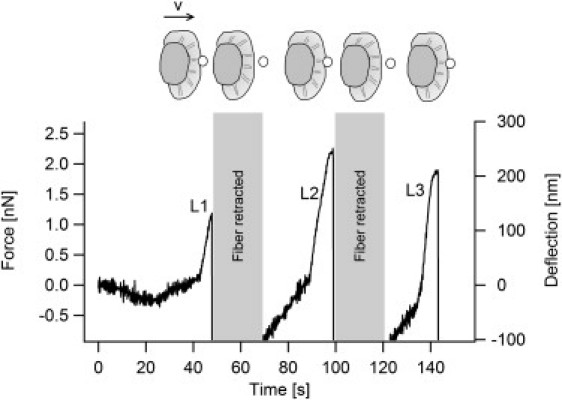
Consecutive measurements of protrusion forces at the same position. When the cell touches the fiber and a first increase in force is detected, the fiber tip is retracted horizontally by a few microns, such that the cell will touch it again after 15–40 s. Thus it was possible to measure the force exerted by the cell up to three times at the same position to test for force adaption of the cell due to loading. An adaption of the actin network (e.g., by increasing the number of filaments or cross-links) would result in an increased effective stiffness of the lamellipodium, which will result in an increase in velocity with which the cell pushes the fiber tip.
Figure 6.

Plot of the relative increase in velocity against experiment number in the repetitive measurements. In average the increase in velocity of the lamellipodial protrusion was v2/v1 = 1.03 ± 0.18 and therefore negligible.
Several models for protrusion, such as the elastic Brownian ratchet (8) and the elastic propulsion model (25) predict F-v curves, which drop rapidly under low loads. This shape is not what we have observed. The shape of the experimentally determined F-v curves is consistent with the end-tracking motor model. However, this model depends on many parameters resulting in many possible shapes of F-v curves (11) and so far no end-tracking motor for actin filaments at the leading edge has been discovered. Furthermore, the end-tracking models predict relatively high stall forces per actin filament (>10 pN) (11) much higher than the value of 1.7 pN determined by our measurements. The autocatalytic branching model is also in agreement with the force independent behavior of the velocity at low forces (12,13). However, our results from the repetitive measurements indicate no increased density of the network as predicted by the autocatalytic branching model.
The highest consistency with our results was obtained by recent Brownian dynamics simulations in the case of stiff F-actin filaments (lp ≥ 0.1 μm) (14). In these simulations, activated Arp2/3 was emitted from a disk resulting in the nucleation of new branches at existing filaments preferentially in a region close to the Arp2/3 emitting disk. The disk was pushed by the growing network. Our results correspond well with two major predictions of this model: the initial force independent velocity of the simulated F-v relationship and the decrease of velocity at F > 0.5 Fs. In the case of stiff filaments, the simulation resulted in an unchanged density of F-actin as a response to a load, which is in accordance to the constant speed observed in our repetitive measurements. The Brownian dynamics model resulted in a velocity in the load independent regime, which is directly controlled by the actin polymerization rates, whereas the decrease in velocity at higher loads is a result of mechanical instability of the network. It is unclear if the details of these simulations correspond to the actual situation in the lamellipodium, considering the recent study (5), that the actin inside the lamellipodium is not branched.
Conclusions
In this study, we have made precise direct measurements of the lamellipodial protrusion against an external force. On initial contact, the protrusion velocity of the lamellipodium stays constant even when the loading force increases. At higher loading forces the velocity decreases until finally the lamellipodium stalls. Typical stall forces are on the order of 2.9 ± 0.6 nN, corresponding to stall pressures of 2.7 ± 1.6 nN/μm2. The decrease in velocity starts at ∼50% the stalling force. Subsequent measurements of protrusion forces and velocities did not show any effect on previous loading indicating that the cell does not adapt to previous loading events on the timescale of the experiments (∼1 min). Our experimental data should be helpful in further developing and improving models to describe force generation in protruding lamellipodia.
Appendix: Influence of the Cylindrical Fiber Geometry on the Measurement
The curved geometry of the glass fiber influences the deflection and force measurements, because the contact area between the approaching lamellipodium and the fiber increases with time. In the following section, we will derive an expression for the effective spring constant of the part of the lamellipodium, which touches the fiber. Further, an expression for the measured deflection is derived by using simple assumptions.
Appendix A: effective spring constant of the lamellipodium
The tip of the glass fiber is approximated as a cylinder with radius r. The contact length s between the lamellipodium and the glass fiber can be written as (Fig. 7 A):
| (3) |
Figure 7.
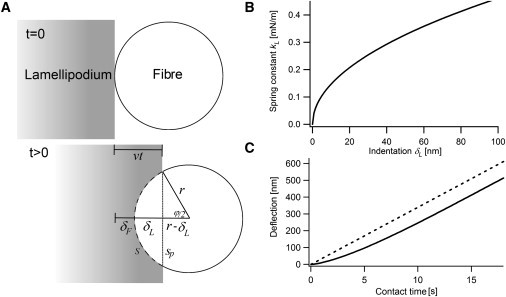
(A) Simplified model of the change in contact area between cell and tip. The lamellipodium moves from the left toward the glass fiber and touches it at t = 0. Due to the cylindrical geometry of the fiber, the contact length s will increase as a function of time. (B) With increasing indentation δL of the lamellipodium also the contact area with the fiber increases. This results in an increase of the effective force constant kL of the gel, because the loading force of the fiber is distributed over an increasing area of the gel. (C) Predicted signal for a glass fiber probe (solid line) and a vertically mounted AFM cantilever with constant contact area as in Prass et al. (16) (dashed line). In the case of the glass fiber, the signal has a convex shape due to the increasing effective spring constant of the cell, which transduces more and more of the movement into the fiber. At later stages of the measurement, the signal of the fiber increases almost linearly and therefore similar to the cantilever. Parameters used: E = 3700 Pa (17), h = 150 nm, r = 3.5 μm, l = 2 μm (24), k = 9 mN/m, v = 10 μm/min. For the cantilever, a contact length of 6 μm and a spring constant of 6.5 mN/m was assumed.
The component sp perpendicular to the applied force of the lamellipodium is
| (4) |
Let us look at a cell moving with a constant velocity v and touching the fiber at t = 0. At t > 0, without the influence of the fiber, the cell would crawl for the distance vt. In the presence of the fiber, this distance is distributed between the lamellipodium indented with an indentation δL and the fiber deflected with a deflection of δF (Fig. 7 A). Then the angle ϕ is given by
| (5) |
Combining Eqs. 4 and 5 yields
| (6) |
The increase in contact length results in an apparent hardening of the lamellipodium with time, because more and more of the actin gel is in force balance with the glass fiber. The effective spring constant kL of the lamellipodium with elastic modulus E, contact area A, and length of the lamellipodium l can be written as
| (7) |
The contact area A can be obtained by multiplying the height of the lamellipodium minus the distance of the tip from the surface h with sp, the component of the contact length perpendicular to the applied force. Using Eq. 7 this results in
| (8) |
This equation describes the increase of the effective spring constant of the lamellipodium during contact with the glass fiber (Fig. 7 B).
Appendix B: expression for the measured deflection
Once the lamellipodium, described by the time dependent spring constant kL, hits the glass fiber with spring constant k, both are in force balance. The lamellipodium is indented by δL and the fiber deflected by δF:
| (9) |
The cell body is moving with speed v. After contact this motion is distributed between the deflection of the fiber and indentation of the lamellipodium:
| (10) |
Combining Eqs. 9 and 10 results in the following expression for the deflection of the fiber:
| (11) |
By inserting Eq. 8 for kL and using Eq. 10 an implicit function describing the deflection of the fiber follows, which can be solved for each time by finding the root:
| (12) |
Fig. 7 C shows a plot of the solutions of Eq. 12 in comparison with the calculated signal for a constant contact area (e.g., obtained by an vertically aligned AFM cantilever (16)). In the case of a fiber the velocity with which the cell deflects the fiber will increase, although a constant velocity of the cell body was assumed. This shape results from the increasing spring constant of the lamellipodium due to increasing contact area. However, this effect is only important during the first few seconds of contact. For later stages of the measurement, the deflection increases almost linear and therefore similar to an obstacle with constant contact area, which shows a perfectly linear deflection (Fig. 7 C). Hence, for higher times the artefacts generated by the geometry are much smaller than for the first phase of contact. The reason behind this is the very fast increase in effective spring constant of the lamellipodium at the beginning of contact and the much slower increase at longer times after contact (Fig. 7 B). Shape and physical dimensions of this predicted deflection signal are in very good agreement with the measured signals (compare Fig. 3). This indicates that Eqs. 8 and 12 are suitable in describing the process of signal generation during initial contact.
Supporting Material
References
- 1.Ridley A., Schwartz M., Horwitz A. Cell migration: integrating signals from front to back. Science. 2003;302:1704–1709. doi: 10.1126/science.1092053. [DOI] [PubMed] [Google Scholar]
- 2.Small J., Anderson K., Rottner K. Actin and the coordination of protrusion, attachment and retraction in cell crawling. Biosci. Rep. 1996;16:351–368. doi: 10.1007/BF01207261. [DOI] [PubMed] [Google Scholar]
- 3.Svitkina T., Borisy G. Arp2/3 complex and actin depolymerizing factor/cofilin in dendritic organization and treadmilling of actin filament array in lamellipodia. J. Cell Biol. 1999;145:1009–1026. doi: 10.1083/jcb.145.5.1009. [DOI] [PMC free article] [PubMed] [Google Scholar]
- 4.Pollard T. Regulation of actin filament assembly by Arp2/3 complex and formins. Annu. Rev. Biophys. Biomol. Struct. 2007;36:451–477. doi: 10.1146/annurev.biophys.35.040405.101936. [DOI] [PubMed] [Google Scholar]
- 5.Urban E., Jacob S., Small J. Electron tomography reveals unbranched networks of actin filaments in lamellipodia. Nat. Cell Biol. 2010;12:429–435. doi: 10.1038/ncb2044. [DOI] [PubMed] [Google Scholar]
- 6.Mogilner A. On the edge: modeling protrusion. Curr. Opin. Cell Biol. 2006;18:32–39. doi: 10.1016/j.ceb.2005.11.001. [DOI] [PubMed] [Google Scholar]
- 7.Peskin C., Odell G., Oster G. Cellular motions and thermal fluctuations: the Brownian ratchet. Biophys. J. 1993;65:316–324. doi: 10.1016/S0006-3495(93)81035-X. [DOI] [PMC free article] [PubMed] [Google Scholar]
- 8.Mogilner A., Oster G. Cell motility driven by actin polymerization. Biophys. J. 1996;71:3030–3045. doi: 10.1016/S0006-3495(96)79496-1. [DOI] [PMC free article] [PubMed] [Google Scholar]
- 9.Mogilner A., Oster G. Force generation by actin polymerization II: the elastic ratchet and tethered filaments. Biophys. J. 2003;84:1591–1605. doi: 10.1016/S0006-3495(03)74969-8. [DOI] [PMC free article] [PubMed] [Google Scholar]
- 10.Keren K., Pincus Z., Theriot J. Mechanism of shape determination in motile cells. Nature. 2008;453:475–480. doi: 10.1038/nature06952. [DOI] [PMC free article] [PubMed] [Google Scholar]
- 11.Dickinson R., Caro L., Purich D. Force generation by cytoskeletal filament end-tracking proteins. Biophys. J. 2004;87:2838–2854. doi: 10.1529/biophysj.104.045211. [DOI] [PMC free article] [PubMed] [Google Scholar]
- 12.Carlsson A. Growth of branched actin networks against obstacles. Biophys. J. 2001;81:1907–1923. doi: 10.1016/S0006-3495(01)75842-0. [DOI] [PMC free article] [PubMed] [Google Scholar]
- 13.Carlsson A. Growth velocities of branched actin networks. Biophys. J. 2003;84:2907–2918. doi: 10.1016/S0006-3495(03)70018-6. [DOI] [PMC free article] [PubMed] [Google Scholar]
- 14.Lee K., Liu A. Force-velocity relation for actin-polymerization-driven motility from Brownian dynamics simulations. Biophys. J. 2009;97:1295–1304. doi: 10.1016/j.bpj.2009.06.014. [DOI] [PMC free article] [PubMed] [Google Scholar]
- 15.Schreiber C.H., Stewart M., Duke T. Simulation of cell motility that reproduces the force–velocity relationship. Proc. Natl. Acad. Sci. USA. 2010;107:9141–9146. doi: 10.1073/pnas.1002538107. [DOI] [PMC free article] [PubMed] [Google Scholar]
- 16.Prass M., Jacobson K., Radmacher M. Direct measurement of the lamellipodial protrusive force in a migrating cell. J. Cell Biol. 2006;174:767–772. doi: 10.1083/jcb.200601159. [DOI] [PMC free article] [PubMed] [Google Scholar]
- 17.Parekh S., Chaudhuri O., Fletcher D. Loading history determines the velocity of actin-network growth. Nat. Cell Biol. 2005;7:1119–1123. doi: 10.1038/ncb1336. [DOI] [PubMed] [Google Scholar]
- 18.Hutter J., Bechhoefer J. Calibration of atomic force microscope tips. Rev. Sci. Instrum. 1993;64:1868–1873. [Google Scholar]
- 19.Mylonas C., Cardinaletti G., Polzonetti-Magni A. Comparative efficacy of clove oil and 2-phenoxyethanol as anesthetics in the aquaculture of European sea bass (Dicentrarchus labrax) and gilthead sea bream (Sparus aurata) at different temperatures. Aquaculture. 2005;246:467–481. [Google Scholar]
- 20.Gibson C., Watson G., Myhra S. Determination of the spring constants of probes for force microscopy/spectroscopy. Nanotechnology. 1996;7:259–262. [Google Scholar]
- 21.Brunner C., Ehrlicher A., Goegler M. Cell migration through small gaps. Eur. Biophys. J. 2006;35:713–719. doi: 10.1007/s00249-006-0079-1. [DOI] [PubMed] [Google Scholar]
- 22.Laurent V., Kasas S., Meister J. Gradient of rigidity in the lamellipodia of migrating cells revealed by atomic force microscopy. Biophys. J. 2005;89:667–675. doi: 10.1529/biophysj.104.052316. [DOI] [PMC free article] [PubMed] [Google Scholar]
- 23.Abraham V., Krishnamurthi V., Lanni F. The actin-based nanomachine at the leading edge of migrating cells. Biophys. J. 1999;77:1721–1732. doi: 10.1016/S0006-3495(99)77018-9. [DOI] [PMC free article] [PubMed] [Google Scholar]
- 24.Ponti A., Machacek M., Danuser G. Two distinct actin networks drive the protrusion of migrating cells. Science. 2004;305:1782–1786. doi: 10.1126/science.1100533. [DOI] [PubMed] [Google Scholar]
- 25.Marcy Y., Prost J., Sykes C. Forces generated during actin-based propulsion: a direct measurement by micromanipulation. Proc. Natl. Acad. Sci. USA. 2004;101:5992–5997. doi: 10.1073/pnas.0307704101. [DOI] [PMC free article] [PubMed] [Google Scholar]
Associated Data
This section collects any data citations, data availability statements, or supplementary materials included in this article.