

Abstract
Fluorescence fluctuation spectroscopy (FFS) quantifies the interactions of fluorescently-labeled proteins inside living cells by brightness analysis. However, the study of cytoplasmic proteins that interact with the plasma membrane is challenging with FFS. If the cytoplasmic section is thinner than the axial size of the observation volume, cytoplasmic and membrane-bound proteins are coexcited, which leads to brightness artifacts. This brightness bias, if not recognized, leads to erroneous interpretation of the data. We have overcome this challenge by introducing dual-color z-scan FFS and the addition of a distinctly colored reference protein. Here, we apply this technique to study the cytoplasmic interactions of the Gag proteins from human immunodeficiency virus type 1 (HIV-1) and human T-lymphotropic virus type 1 (HTLV-1). The Gag protein plays a crucial role in the assembly of retroviruses and is found in both membrane and cytoplasm. Dual-color z-scans demonstrate that brightness artifacts are caused by a dim nonpunctate membrane-bound fraction of Gag. We perform an unbiased brightness characterization of cytoplasmic Gag by avoiding the membrane-bound fraction and reveal previously unknown differences in the behavior of the two retroviral Gag species. HIV-1 Gag exhibits concentration-dependent oligomerization in the cytoplasm, whereas HTLV-1 Gag lacks significant cytoplasmic Gag-Gag interactions.
Introduction
Two-photon fluorescence fluctuation spectroscopy (FFS) monitors the fluorescence fluctuations caused by single molecules that migrate in and out of a diffraction-limited observation volume. Analysis of the fluctuations provides information on the concentration, mobility, and brightness of fluorescent proteins (1–3). An exciting application of FFS lies in the characterization of protein-protein interactions in living cells by brightness analysis (1,4). However, caution is required because the cellular environment is far more complex than that in an aqueous solution. We recently demonstrated that cytoplasmic brightness analysis leads to artifacts if the observation volume exceeds the physical boundaries of the cell (5). Z-scan FCS was introduced to account for artifacts in the study of diffusion in both model and cellular lipid bilayers (6–8). Our group adapted this technique to account for the brightness artifacts observed in thin cells (5). Here we expand the repertoire of FFS by characterizing retroviral Gag proteins (9,10), which are found both in the cytoplasm and on the plasma membrane. Gag molecules are retroviral structural proteins that have been shown to be sufficient for the production and release of viral-like particles (VLPs). VLPs exhibit similar size and morphology to immature infectious virions (11,12). Hundreds to thousands of Gag proteins assemble and organize at the plasma membrane to form individual VLPs (13–15). It is believed, however, that the process of viral assembly is initiated in the cytoplasm, followed by Gag targeting to the membrane for further assembly (16–18). In this study, we investigated the cytoplasmic Gag-Gag interactions of two viruses (HIV-1 and HTLV-1) to characterize the initial steps of the virus particle assembly pathway.
Cells expressing Gag display bright puncta at the membrane, which are the putative assembly sites of VLPs. Although it is easy to avoid puncta, FFS measurements resulted in artifacts that were ultimately traced to the existence of a nonpunctate Gag-population at the membrane. The finite thickness of cytoplasmic sections leads to coexcitation of cytoplasmic and membrane-bound Gag, which obfuscates brightness analysis. In this work, we introduced a modified z-scan FFS technique to identify appropriate measurement positions for brightness analysis of cytoplasmic Gag proteins. The modified FFS technique relies on a dual-color z-scan, which was recently introduced into FCS (6).
We applied the technique to quantify cytoplasmic Gag-Gag interactions using brightness analysis for the first time (to our knowledge). Our results demonstrate interesting differences in the behavior of HTLV-1 and HIV-1 Gag, which appear related to the myristic acid moiety known to be involved in Gag membrane targeting (16–18). We anticipate that the methodology described in this article will prove useful in the characterization of other cytoplasmic proteins that interact with the membrane.
Materials and Methods
FFS instrumentation
A mode-locked Ti:Sapphire laser (Tsunami, Spectra-Physics, Mountain View, CA) serves as a source for two-photon excitation of a modified Axiovert 200 microscope (Zeiss, Thornwood, NY) as previously described (1). Cells reside in a chamber slide mounted on a motorized stage (PZ2000 piezo stage; ASI, Eugene, OR). The location and positioning of cells expressing both the Gag-EYFP construct and mCherry was achieved using fluorescence epi-illumination. The microscope was subsequently switched to bright-field illumination to verify cell-health as well as to locate a measurement position which appeared free from organelles. Finally, fluorescence epi-illumination was used to ensure that no puncta were present at the chosen measurement location.
Once a cell was selected, the excitation source was switched to the Ti:Sapphire laser for FFS experiments. Excitation light is focused through a 63× Plan Apochromat (Zeiss) oil immersion objective (N.A. = 1.4). Control experiments (data not shown) confirm that 0.3 mW excitation power is sufficiently low to avoid saturation and photobleaching effects. Each FFS measurement lasts 82 s and uses two-photon excitation of the sample at 1000 nm. Intensity z-scans were obtained using a PZ2000 piezo stage (ASI, Eugene, OR) to move the sample in the axial direction. Scan voltages were controlled by a model No. 33250A arbitrary waveform generator (Agilent Technologies, Santa Clara, CA) running a linear ramp signal with a frequency of 30.5 mHz and a peak-to-peak amplitude of 1.4 V. This voltage corresponds to an axial travel of 14.2 μm. The fluorescence emission of the FFS and z-scan measurements was separated into two different detection channels with a 580-nm dichroic mirror (585DCXR; Chroma Technology, Bellows Falls, VT). Photon counts were detected with avalanche photodiodes (SPCM-AQ-14; Perkin-Elmer, Boston, MA) and recorded by a data acquisition card (ISS, Champaign, IL), which stores the complete sequence of photon counts using sampling frequencies ranging from 20 to 200 kHz. Two-photon imaging is described in the Supporting Material.
Sample preparation and data analysis
Plasmid construction, transfection, and cell treatment are described in the Supporting Material. The photon counts were analyzed with programs written in IDL 6.0 (Research Systems, Boulder, CO). The determination of protein concentrations and brightness values from FFS experiments has been described previously (1,2,4). The z-scan fluorescent intensity traces F(z;h) were fit using (5)
| (1) |
The fluorescent intensity at position z for a slab of height h depends on the amplitude A and the spatial convolution of the radially integrated point spread function (PSF) with a sample shape factor S. For cell measurements the shape factor is modeled as a slab of height h,
| (2) |
The parameter h0 is required to describe the difference between the initial position of the z-scan and the start position of the slab. The radially integrated PSF of the observation volume is modeled using a modified Gaussian-Lorentzian PSF as previously described (5). The beam parameters of the PSF were determined daily from fits of z-scan profiles to Eq. 1 and changed very little. The axial beam waist ZR is ∼0.7 μm and the y factor is ∼1.9.
Results
Cells which express either the HIV-1 Gag-EYFP or the HTLV-1 Gag-EYFP construct exhibit both bright puncta and a diffuse, dim fluorescence from cytoplasmic regions of the cell (see Fig. S1 of the Supporting Material). The puncta are generally believed to be plasma membrane-anchored sites of VLP assembly containing hundreds to thousands of individual Gag copies (19–21), whereas the diffuse staining is believed to be the cytoplasmic fraction of Gag. To investigate the poorly understood cytoplasmic oligomerization-state of HTLV-1 and HIV-1 Gag, FFS brightness measurements of cytoplasmic Gag need to be conducted. To avoid contamination of the cytoplasmic Gag fluorescence by the puncta, FFS measurements are conducted at cellular locations that are free of puncta. The normalized brightness values acquired by this method are shown in Fig. 1 as a function of concentration for HTLV-1 Gag-EYFP measured in HeLa cells. Each point in the graph represents a separate cytoplasmic measurement. Normalized brightness b is determined by calculating the ratio of the brightness of Gag-EYFP (λapp) to the brightness of an EYFP monomer (λmonomer) (1). Normalized brightness provides a measure of the average stoichiometry of the labeled proteins. For example, a normalized brightness of b = 2 corresponds to a dimer. The data has been screened for fluorescence intensity spikes that were found infrequently as described in the Supporting Material.
Figure 1.
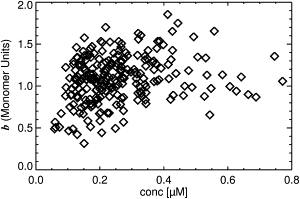
Normalized brightness of HTLV-1 Gag-EYFP expressed in HeLa cells measured at locations that appeared free of puncta. The data were screened to eliminate artifacts due to intensity spikes. Normalized brightness values of <1 indicate an unphysical stoichiometry of <1 for Gag-EYFP.
Despite avoiding puncta and the removal of intensity spikes, the brightness values in Fig. 1 exhibit an unusual feature. Whereas the majority of the data fall between monomeric and dimeric brightness values, a substantial fraction of the data shows a normalized brightness significantly below a value of 1. Such low brightness values correspond to an unphysical Gag-EYFP stoichiometry of less than monomer. Despite the unphysical results, fluorescence autocorrelation data exhibited no unusual features. A discussion of the autocorrelation data is provided in the Supporting Material. This unexpected result warrants a careful examination of potential artifacts that arise in FFS experiments.
One source of experimental artifacts in cytoplasmic brightness measurements is the cell thickness (5). FFS defines brightness as the average fluorescence intensity of a single molecule sampled at all locations of the observation volume. Focusing on the midsection of a thin sample excludes access of the fluorophore to the outer edges of the observation volume, where the intensity is lowest. As a consequence, cytoplasmic Gag-EYFP spends most of the time in the higher intensity, central areas of the excitation light, and the resulting spatial average skews the apparent brightness upwards. Z-scan FFS was introduced to correct this geometry-related artifact (5). In this technique, the observation volume is scanned uniformly along the z axis at a given cell location.
The FFS measurement is performed at the same location with the focus at the midsection of the cell. The intensity trace of the z-scan is determined by the convolution of the observation volume with the geometric profile of the cell at the location of the measurement. Based on previous work we modeled the observation volume of two-photon excitation by a modified Gaussian-Lorentzian PSF and the cell profile as a slab of thickness L with uniform fluorophore distribution (5). The fit of the intensity trace to Eq. 1 determines the shape factor γ2, which incorporates the geometry effect of sample thickness (5,22). This shape factor is used to calculate the corrected brightness of the FFS measurement. Our earlier study found that without this correction the bias in brightness could be as high as a factor of 2, but would always lead to an increase in brightness. Thus, z-scan FFS has the potential to reduce some of the high brightness scatter in the Gag-EYFP data, but cannot explain abnormally low brightness values.
Another factor potentially influencing FFS experiments is the presence of Gag-EYFP at the plasma membrane. Although we selected measurement sites that appear free of puncta, we cannot rule out the presence of membrane-bound Gag-EYFP with certainty. The fluorescence contributions from a population of Gag-EYFP at the membrane could influence brightness determination and complicate positioning of the observation volume. Brightness measurements are typically conducted at the center of the cellular slab, which is identified by focusing the observation volume at the point of maximum fluorescent intensity along the z-profile of the cell. If plasma membrane-bound fluorescent protein is present, the maximum of the fluorescent intensity can shift toward the periphery of the cell, which leads to an off-center position of the observation volume. These issues confound the interpretation of brightness measurements. However, it is difficult to identify experimentally the existence of a membrane fraction if its fluorescence intensity is of the same order as the cytoplasmic intensity. We found that autocorrelation analysis of the FFS data is not sufficient to identify unequivocally the presence of membrane-bound protein as discussed in the Supporting Material.
These challenges prompted us to introduce an internal standard by coexpressing the red fluorescent protein mCherry together with Gag-EYFP. Because mCherry is a soluble protein that does not interact with membrane, it is a suitable protein for finding the center of the cell slab, determining cell thickness, and identifying Gag-EYFP at the membrane. The green channel records the fluorescence from Gag-EYFP, whereas the red channel records mCherry fluorescence as long as the crosstalk from Gag-EYFP is removed as described in the Supporting Material. For simplicity, we refer to the red channel when specifying mCherry fluorescence without explicitly stating the correction procedure.
Fig. 2 shows two-color z-scan intensity traces of HeLa cells expressing HTLV-1 Gag-EYFP and mCherry. It should be noted that HIV-1 Gag-EYFP-expressing cells yielded data with the same features as presented in Fig. 2. All intensity curves have been normalized to a maximum intensity of 1 to facilitate comparison. The z-scan profiles of Fig. 2 A illustrate perfect overlap between red- and green-channel data. Separate fits of the red- and the green-channel intensity profile to the slab model (Eq. 1) determined a thickness of 1.86 ± 0.02 μm for both channels with reduced χ-square values of 1.4 and 1.5. Both the Gag-EYFP and mCherry fluorescence intensity profiles coincide and are well described by a simple slab model as expected for purely cytoplasmic protein. We refer to z-scans with these attributes as membrane-negative, because of the absence of membrane-associated Gag-EYFP. Next, the observation volume is focused at the center of the slab using the red channel and the brightness of Gag-EYFP is determined. The cell thicknesses obtained from the z-scan data is used to account for the impact of sample thickness on the brightness. Fig. 3 A is a cartoon illustrating the hypothesized cellular conditions which gives rise to the z-scan data seen in Fig. 2 A. The observation volume (gradient filled oval) is positioned in the center of the cytoplasm, with cytoplasmic Gag-EYFP being the sole Gag species present at the measurement position.
Figure 2.
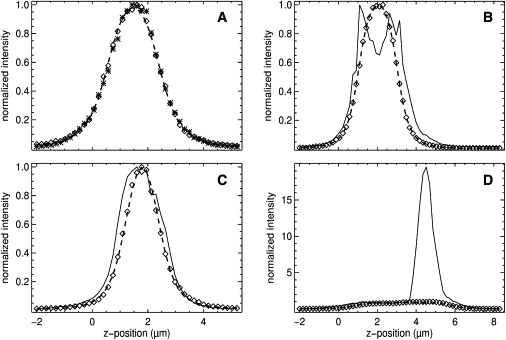
Dual-color z-scan intensity traces from HeLa cells expressing HTLV-1 Gag-EYFP and mCherry. Fluorescence intensity traces were obtained for Gag-EYFP (green channel) and mCherry (red channel) as detailed in the article. The intensity trace with amplitude normalized to 1 is graphed versus the axial beam position. (A) Example of a membrane-negative z-scan. The normalized intensity trace of the green (asterisks) and red (diamonds) channels overlaps completely. The fit (dashed line) of the trace to a slab model identifies a thickness of 1.86 ± 0.02 μm. Purely cytoplasmic Gag-EYFP yields a membrane-negative z-scan. (B) Example of a membrane-positive z-scan. The distinct shape of the green-channel curve (solid line) indicates the presence of membrane-bound Gag-EYFP. For comparison, cytosolic mCherry is represented by the red-channel data (diamonds) and its fit (dashed line) to a slab model. (C) Example of a membrane-positive z-scan. Here the shape of the green-channel data (solid line) is not sufficient to recognize the presence of membrane-bound Gag-EYFP. Comparison with the red-channel curve (diamonds) is needed to identify the existence of membrane-bound Gag. (Dashed line) Fit of the red-channel data to a slab model. (D) Example of a z-scan at a puncta location. Normalization of the amplitude of the green-channel curve (solid line) was performed outside the region with the intensity spike to illustrate the high intensity of the punctum. The mCherry fluorescence (diamonds) of the red channel and its fit (dashed line) to a slab model is shown for reference. Comparison of the green and red channels reveals in addition a dim nonpunctate Gag-EYFP membrane fraction at the bottom membrane.
Figure 3.
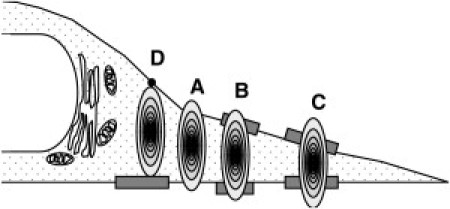
Depiction of the vertical cross section of a cell with the FFS observation volume (oval) placed at four different cytoplasm locations. The image includes cytoplasmic Gag (dotted fill pattern), nonpunctate membrane-bound Gag (shaded bar), and punctate Gag (solid circle). The four measurement locations (A–D) provide an interpretation of the z-scans of Fig. 2. (A) Location with purely cytoplasmic Gag. (B) Thick cytoplasmic slab with nonpunctate Gag at the top and bottom membranes. (C) Thin cytoplasmic slab with nonpunctate Gag at the top and bottom membranes. (D) Cytoplasmic slab with punctum at the top membrane and nonpunctate Gag at the bottom membrane.
Fig. 2 B shows z-scan data from a different cell location than Fig. 2 A, but with comparable thickness. We notice immediately that the intensity profiles of the green and red channel are distinctly different. The intensity trace of the red channel (diamonds) is symmetric, has a single peak, and is well approximated by a fit to a simple slab model (dashed line) with a thickness of 1.96 ± 0.01 μm. Thus, the z-scan data of the red channel demonstrate that mCherry is cytoplasmic. In contrast, the intensity profile of the green channel (solid line) has two peaks, is wider than the profile of mCherry, and cannot be reproduced by a simple slab model. The green channel data exhibits features that are consistent with a significant population of membrane-bound Gag-EYFP at both the top and bottom membranes, giving rise to the two peaks as illustrated in Fig. 3 B.
The valley between the two peaks is formed by the signal from cytoplasmic Gag-EYFP with additional contributions from membrane-associated Gag-EYFP, which is excited at the periphery of the observation volume. We refer to z-scans that share the characteristics seen in Fig. 3 B as membrane positive, because the data reveal the presence of membrane-bound Gag-EYFP. Although Fig. 3 B illustrates an example with Gag-EYFP at both the top and bottom membranes, we also found membrane-positive z-scans with Gag-EYFP only visible at one of the two membranes. It is important to note that the measurement site was selected in a region that appeared devoid of puncta. Thus, the membrane-bound Gag-EYFP (shown as shaded boxes in Fig. 3 B) has to represent a population of Gag that is distinct from the puncta. Its intensity has to be much lower than that of puncta, which indicates a low degree of oligomerization and a concentration comparable to cytoplasmic Gag. The population of membrane-bound Gag is further believed to be nonpunctate as discussed at a later point. Immediately before taking the z-scan, an FFS measurement was performed at the center of the slab, which was identified using the red-channel intensity. The normalized brightness of the measurement was, b = 0.5, which is <<1. This result strongly suggests that the unphysical low brightness values observed in Fig. 1 are associated with the presence of membrane-bound Gag-EYFP.
Fig. 3 C is an example in which the Gag-EYFP's intensity profile of the green channel suggests the absence of membrane-bound Gag. However, comparison of the intensity profile of the green and red channel reveals a lack of overlap between them. The profile of the green channel (solid line) is broadened, which indicates the presence of a Gag membrane fraction. The mCherry fluorescence profile of the red channel (diamonds) is reproduced by a fit (dashed line) to a slab model with a cell thickness of 1.11 ± 0.03 μm. However, the profile of the green channel can also be approximated by a fit to a slab model, which results in a thickness of 1.75 ± 0.02 μm and a reduced χ-square of 1.9. Thus, the data of the green channel on its own might lead to the false conclusion that the Gag protein is purely cytoplasmic. The z-scan traces of Fig. 2 C are an example in which the dual-color comparison of red and green channels is essential for the positive identification of Gag-EYFP at the membrane. The cartoon of Fig. 3 C illustrates conditions that can give rise to the z-scan data of Fig. 2 C. Just as in the case of Fig. 3 B, both cytoplasmic and membrane-associated Gag are present at the measurement site.
The crucial difference, which gives rise to the difference in the appearance of the two z-scans, is the cell thickness at the point of measurement. The spatial resolution of the observation volume is insufficient to identify the Gag fluorescence from the bottom and top membranes as independent peaks. The thin sample geometry effectively merges the membrane and cytoplasmic fluorescence contributions into a single, albeit slightly broadened peak. This result implies that the relative broadening of the z-scan profile of the green channel to that of the red channel diminishes as the sample thickness decreases. For this reason, measurement locations with a thickness of ∼0.5 μm or less were rejected, because the spatial resolution is insufficient to unequivocally identify membrane-positive data. An FFS measurement was performed at the center of the cellular slab to determine the thickness-corrected brightness of Gag-EYFP. Although the normalized brightness at this measurement position was higher, b = 0.71, than that measured at the position of Fig. 2 B, it is still sufficiently low to be unphysical.
Thus far, all measurements have been performed at locations free of puncta. We now purposefully target puncta to capture their fluorescence in a z-scan experiment. Fig. 2 D displays a successful z-scan measurement of a punctum. It should be noted that for purposes of clarity the green channel (solid line) was normalized using data outside of the large intensity spike present in the data. The normalization was performed in this manner to emphasize the spike's relative scale versus the red-channel control (diamonds). The data clearly displays the profound impact of a Gag punctum positioned at the measurement site on the fluorescence intensity profile of the green channel. A cartoon of cellular conditions that give rise to the z-scan data seen in Fig. 2 D is illustrated in Fig. 3 D. The highly oligomerized Gag punctum resides at the top cellular membrane (solid circle). Though it is difficult to see due to the scale differences, the fluorescent intensity profile at the bottom membrane of the cell also exhibits a membrane-positive signature, which must be due to nonpunctate membrane-bound Gag (shaded box). This difference in intensity scale clearly establishes that there are two distinct pools of Gag at the membrane—bright puncta and dim nonpunctate Gag.
All brightness experiments described in this article have been performed on HeLa cells using z-scan FFS. In selected cases, multiple FFS measurements have been conducted in the same cell at different locations. We found both membrane-positive and membrane-negative z-scans within the same cell. In addition, the experiments revealed that FFS measurements at membrane positive locations resulted in some, but not all cases, in an unphysical low brightness. These observations clearly spell out the need to discard all membrane-positive FFS experiments to ensure that the measured brightness faithfully represents cytoplasmic Gag. Selection of membrane-negative FFS experiments is in principle straightforward by examining the z-scan profiles. However, the z-scan and FFS measurement are not conducted simultaneously, but sequentially. If measurement locations switch from membrane-positive to -negative, or vice versa, during the timescale of the measurements, false-negatives and -positives are introduced, undermining the accuracy of the selection process. We performed a series of continuous z-scans and analyze the resulting kymographs to determine the temporal stability of membrane-positive and membrane-negative locations (see the Supporting Material). These experiments establish that the sequential z-scan and FFS experiments provide a robust method for identifying the presence or absence of Gag-EYFP at the membrane.
We now have the tools to revisit the brightness characterization of cytoplasmic Gag-EYFP. Dual-color z-scan FFS is used to select membrane-negative experiments and determine their brightness, while discarding any measurements with membrane-positive characteristics. Fig. 4 A shows the normalized brightness versus concentration for cytoplasmic HIV-1 Gag-EYFP (diamonds) measured at membrane-negative locations. It is immediately apparent that dual-color z-scan FFS has been successful in removing the unphysical low brightness values seen in Fig. 1. The lowest normalized brightness data are consistent with monomeric Gag-EYFP. Brightness values slightly below 1 reflect the statistical uncertainty in the experiment, which in our experience is ∼10% for cellular brightness measurements (see the Supporting Material for further details concerning brightness statistics).
Figure 4.
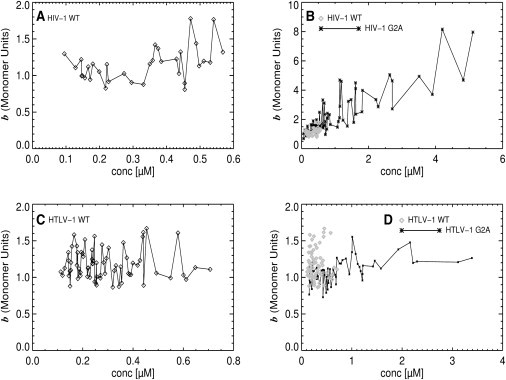
Normalized brightness of cytoplasmic Gag-EYFP versus concentration from membrane-negative dual-color z-scan FFS data taken in HeLa cells. (A) Normalized brightness of HIV-1 Gag-EYFP. (B) Normalized brightness of HIV-1 G2A Gag-EYFP (asterisks) and HIV-1 Gag-EYFP (shaded diamonds). (C) Normalized brightness of HTLV-1 Gag-EYFP. (D) Normalized brightness of HTLV-1 G2A Gag-EYFP (asterisks) and HTLV-1 Gag-EYFP (shaded diamonds). The data reveal distinct differences for the Gag-Gag interactions for both viruses as further discussed in the main article.
The data reveal the existence of monomeric HIV-1 Gag at low concentrations and hint at a concentration-dependent Gag oligomerization in the cytoplasm, because the data trends toward slightly elevated brightness values at the upper end of the measured concentrations. This result is consistent with the myristoyl switch model (16,17,23,24). This model predicts that Gag-Gag interactions in the cytoplasm directly lead to membrane-binding through the exposure of a myristic acid moiety at the N-terminus of the Gag molecules. Gag monomers, on the other hand, sequester the myristic acid moiety in a hydrophobic pocket of the matrix domain, and thus are restricted to the cytoplasm.
To facilitate observation of cytoplasmic Gag-Gag interactions, we measured the G2A Gag mutant, which lacks the myristoyl moiety and is therefore membrane-binding deficient (25,26). In contrast to wild-type HIV-1 Gag, the HIV-1 G2A mutant exhibits an increased brightness and concentration range (Fig. 4 B). Brightness of the G2A mutant (asterisks) increases monotonically with concentrations and reaches a value of ∼8, which reflects an average complex size of eight Gag molecules. Thus, dimerization of Gag is followed by further increase in oligomerization. In addition, G2A Gag mutants reach cytoplasmic concentrations almost a degree-of-magnitude-higher than wild-type HIV-1 Gag. Despite the contrast in the two results, the brightness of wild-type HIV-1 Gag (shaded diamonds) and G2A mutant (asterisks) are identical over the concentration range accessible to the wild-type protein.
Fig. 4 C shows the normalized brightness versus concentration for cytoplasmic HTLV-1 Gag-EYFP (diamonds) measured at membrane-negative locations. As with the HIV-1 Gag data, dual-color z-scan FFS has been successful in removing the unphysical low brightness values seen in Fig. 1. The lowest and highest normalized brightness values are 1 and 1.6 if the experimental uncertainty in brightness determination is taken into account. Unlike HIV-1 Gag, there is no discernible concentration-dependence of the brightness. We notice instead a large but uniform scatter in the brightness throughout the concentration range. This result points to a potential difference between HIV-1 and HTLV-1 Gag behavior.
Analogous to our approach to HIV-1 Gag, we now turn to the HTLV-1 Gag G2A mutant for further investigation of cytoplasmic Gag-Gag interactions (Fig. 4 D). Again, the G2A mutant lacks the myristoyl posttranslational modification, and so is deficient in membrane targeting. Although the G2A Gag mutant (asterisks) reaches cytoplasmic concentrations almost a degree-of-magnitude-higher than wild-type HTLV-1 Gag, its brightness behavior departs markedly from that of the HIV-1 G2A species. The normalized brightness remains close to 1 over the entire concentration range. The highest brightness values for the HTLV-1 G2A mutant, at ∼1.4, actually lie below the highest measured values for wild-type HTLV-1 Gag. Another striking difference between HTLV-1 mutant and wild-type is the degree of scatter in the G2A data (Fig. 4 D), which is considerably higher for the wild-type protein (shaded diamonds). The FFS characterization of HTLV-1 G2A Gag did not follow the results expected by the myristoyl-switch model. Our data point to the near-absence of HTLV-1 Gag oligomerization at all cytoplasmic concentrations.
Discussion
Retroviral Gag proteins are the structural proteins of retroviruses, assembling into the retroviral structural lattice consisting of hundreds to thousands of Gag molecules (13,14,27). It is believed that after Gag molecules initiate lattice assembly in the cytoplasm, the Gag-Gag interactions target small Gag complexes to the inner leaflet of the plasma membrane for further assembly (for reviews, see Swanstrom and Wills (9) and Klein et al. (10)). The degree of Gag oligomerization in the cytoplasm remains poorly understood. Techniques such as fluorescence resonance energy transfer have confirmed the presence of cytoplasmic Gag-Gag interactions, but quantification remains lacking (28,29). FFS brightness analysis (1,2,4) has the potential to shed light on this area of Gag behavior, but requires the development and adoption of new FFS protocols.
Previous brightness studies conducted by our group were restricted to soluble proteins residing exclusively in the nucleoplasm or cytoplasm of cells (1,2,4). The study of Gag characterizes a protein with simultaneous presence in the cytoplasm and as puncta at the plasma membrane. Although puncta were avoided in FFS measurements, the brightness of Gag-EYFP revealed unusual characteristics, which we ultimately linked to the presence of nonpunctate Gag-EYFP at the plasma membrane. Adding membrane-bound Gag-EYFP (Fig. 3 B) introduces a second species that is coexcited with cytoplasmic Gag. The exact brightness of a mixture of species depends on many details, but its value will always lie between the brightness of the dimmest and brightest species.
The membrane-bound species depicted in Fig. 3 B will contribute an unusually low brightness, because of its location at the periphery of the observation volume, where the excitation intensity is weak. This reasoning implies that membrane-bound Gag will have a lower brightness than cytoplasmic Gag. Consequently, the brightness of the mixture containing dim membrane-bound Gag is less than the brightness of cytoplasmic Gag. For example, if cytoplasmic Gag has a normalized brightness of 1, the mixture exhibits a value of <1. This scenario provides a qualitative explanation for the unphysical low brightness values observed in Fig. 1. We previously demonstrated that the presence of immobile fluorophores decreases brightness (30).
Note that the reduction of brightness for the current case is not caused by immobile fluorophores, but is due to a geometric effect that restricts mobile fluorophores to the periphery of the observation volume. Thus, the influence of membrane-bound Gag on FFS experiments depends in general on geometric factors. As the cell thickness reduces, the membrane-bound species moves closer to the center of the observation volume (Fig. 3 C), thereby increasing its brightness. Under these circumstances, the brightness at the membrane is not necessarily lower than for cytoplasmic Gag.
In fact, the small drop in brightness from the off-center positioning of the membrane can be sufficiently small that membrane-bound Gag is brighter than cytoplasmic Gag, if the degree of oligomerization at the membrane is higher than in the cytoplasm. For example, if Gag at the membrane is predominantly dimeric, its brightness should be higher or at least comparable to the brightness of cytoplasmic Gag. In conclusion, adding membrane-bound Gag to a population of cytoplasmic Gag may lead to either an increase or a decrease in the measured brightness. Correcting the change in brightness is difficult, because the sample geometry, the oligomeric state, and the concentration of all species play a role. Because these parameters are not sufficiently well known, it is best to avoid the complications that arise from membrane-bound Gag.
Measuring in thick sections, where the observation volume is completely contained in the cytoplasm, offers a straightforward solution that prevents excitation of proteins at the membrane. Because the height of spreading HeLa cells decreases rapidly outside the nuclear region of the cell, the only location thick enough to accommodate the observation volume is the perinuclear region. Unfortunately, performing quantitative FFS measurements in this region is exceedingly difficult, because organelles and fluorescence from internal membranes introduce analytically intractable artifacts. For this reason, we are forced to measure thin cell regions. This approach requires a technique that accurately identifies fluorescence contributions from the plasma membrane to prevent brightness artifacts.
We demonstrate in this article that z-scan FFS provides a suitable solution.
Because the z-profile of a protein with a cytoplasmic and membrane-bound population is complex, we implemented dual-color z-scan FFS to facilitate its characterization. The green channel detects the EYFP-labeled protein, whereas the red channel monitors mCherry, which serves as a marker of the cytoplasmic volume. A membrane-negative scan is defined by identical shapes for the green and red channels, which signals the absence of membrane-bound protein (Fig. 2 A). A membrane-positive scan is characterized by deviating shapes in both channels, which identify the presence of membrane-bound protein (Fig. 2 B). The z-profile of the green channel is often sufficient to identify membrane-positive scans (Fig. 3 B), but comparison with the red channel becomes crucial once the cell section becomes thinner (Fig. 2 C). It is important to recognize that the method breaks down once the cell thickness falls below a critical value, because the optical resolution of the z-scan is insufficient to pick out the broadening of the green-channel profile. We discarded all measurements with a thickness of <0.5 μm, which is the critical thickness for the setup discussed in this article.
The intensity contrast between the z-scan at a puncta-positive (Fig. 2 D) and experimental z-scans at puncta-negative (Fig. 2, B and C) positions clearly demonstrate the existence of a nonpunctate population of Gag at the membrane. The nonpunctate Gag population has to have a low degree of oligomerization, otherwise z-scan FFS measurements at thin cytoplasmic sections (Fig. 2 C) would yield large brightness values, which was not observed. In addition, kymographs confirm that the Gag membrane fraction persists for many minutes, whereas its fluorescence intensity fluctuates with time (see Fig. S2 B of the Supporting Material). This implies that the nonpunctate membrane fraction is mobile and spatially distributed.
The nonpunctate fraction is not uniformly distributed across the plasma membrane, because we have found both membrane-negative and membrane-positive locations within a single cell. To the best of our knowledge, our results provide the first direct observation of a nonpunctate Gag population at the plasma membrane of living cells. However, our finding is not unexpected, as it is well known that low-order HIV-1 Gag complexes are capable of binding the plasma membrane (for reviews, see Swanstrom and Wills (9) and Klein et al. (10)). In addition, biochemical experiments indicate the interaction of HTLV-1 Gag with the plasma membranes of 293T cells (31).
Because the focus of this article is the characterization of cytoplasmic Gag-Gag interactions, we eliminated membrane-positive measurements with dual-color z-scan FFS and directly recorded cytoplasmic Gag-EYFP brightness values that appear free of artifacts. Brightness analysis of wild-type HIV-1 Gag is consistent with the myristoyl-switch model. The protein is monomeric at low concentrations. The increase in brightness toward higher concentration (Fig. 4 A) indicates the onset of Gag-Gag interactions. Gag-Gag interactions initiate the myristoyl switch, which targets wild-type oligomers to the membrane, limiting Gag accumulation in the cytoplasm. By comparison, the HIV-1 G2A Gag mutant is membrane-binding-deficient as confirmed by the absence of membrane-positive z-scans. This allows for the accumulation and consequent oligomerization of G2A Gag in the cytoplasm. Both proteins indicate the onset of detectable Gag-Gag interactions at ∼500 nM, but only the mutant establishes the formation of dimer and higher-order Gag oligomers in the cytoplasm, as membrane-targeting depletes the wild-type oligomers (Fig. 4 B).
HTLV-1 and HIV-1 Gag show distinct differences in their oligomerization. This difference is most clearly visible when comparing their G2A mutants. The HTLV-1 G2A Gag lacked the concentration-dependent oligomerization behavior exhibited by HIV-1 G2A Gag, although both proteins reach comparable concentrations in the cytoplasm (Fig. 4, B and D). Although there is a slight trend upwards in the HTLV-1 G2A brightness data with concentration, the brightness data essentially indicate the absence of Gag oligomerization in the concentration range accessible to wild-type HTLV-1 Gag. Thus, according to the myristoyl switch model, HTLV-1 Gag should not interact with the membrane, which is clearly inconsistent with our experimental z-scan data. Based on the above results we would expect to observe monomeric HTLV-1 Gag in the cytoplasm. The experiment, however, detects a concentration-independent normalized brightness with an unusual large scatter with values ranging from 1 to 1.6 (Fig. 4, C and D). The amplitude of the scatter is much larger than expected from the experimental uncertainty of brightness measurements (see the Supporting Material). Although the reason for this scatter is unknown, its presence indicates that parameters other than concentration play a role in determining HTLV-1 Gag oligomerization.
Our data suggest that the myristoyl moiety might play a different role in Gag oligomerization for HTLV-1 when compared to HIV-1 Gag. Our observations are consistent with a model where HTLV-1 Gag is capable of targeting the membrane without the requirement of prior cytoplasmic interactions. This result implies myristoyl moiety exposure on HTLV-1 Gag monomers, which lies in contrast to the sequestered myristoyl moiety of HIV-1 Gag monomers. The evidence is consistent with previous biochemical work by Rayne et al. (31,32), which found no evidence for HTLV-1 G2A mutant interactions in cell extracts. This difference in membrane targeting that HTLV-1 Gag exhibits may be a contributing factor to the concentration-independent brightness scatter observed for the wild-type species. More work needs to be done to account for the impact of such a model in our interpretation of observed cytoplasmic brightnesses for HTLV-1 Gag.
Performing FFS measurements on cytoplasmic proteins with a membrane-bound population requires special precautions to avoid artifacts. Although it is straightforward to identify and avoid bright puncta, the presence of a dispersed membrane-bound population is much more difficult to recognize. The introduction of dual-color z-scan FFS provides a convenient method to identify the presence of membrane-bound protein. Furthermore, we removed brightness artifacts by selecting membrane-negative z-scan FFS data and performed the first quantification of Gag oligomerization in the cytoplasm of living cells. Our data demonstrate that cytoplasmic HIV-1 and HTLV-1 Gag differ in their interactions, which suggests differences in the assembly pathway of both viruses. Further work is needed to investigate these differences.
Cytoplasmic proteins that interact with the membrane are ubiquitous. We expect that dual-color z-scan FFS will prove useful in the brightness characterization of such proteins. At this point, dual color z-scan FFS is used to reject membrane-positive data. A potentially interesting and useful extension of the technique would allow the simultaneous characterization of cytoplasmic and membrane-bound proteins. In the future, we hope to apply such a technique toward a better understanding of retroviral assembly.
Acknowledgments
This work is supported by National Institutes of Health grants No. R01GM064589 (to J.D.M.) and No. R21AI81673 (to J.D.M., Y.C., and L.M.M.). K.H.F. was supported by grant No. T32 CA09138 (Cancer Biology Training Grant) and I.F.G. was supported by National Institutes of Health grant No. T32 DE07288 (MinnCResT Program).
Contributor Information
Louis M. Mansky, Email: mansky@umn.edu.
Joachim D. Mueller, Email: mueller@physics.umn.edu.
Supporting Material
References
- 1.Chen Y., Wei L.N., Müller J.D. Probing protein oligomerization in living cells with fluorescence fluctuation spectroscopy. Proc. Natl. Acad. Sci. USA. 2003;100:15492–15497. doi: 10.1073/pnas.2533045100. [DOI] [PMC free article] [PubMed] [Google Scholar]
- 2.Chen Y., Müller J.D., Gratton E. Molecular brightness characterization of EGFP in vivo by fluorescence fluctuation spectroscopy. Biophys. J. 2002;82:133–144. doi: 10.1016/S0006-3495(02)75380-0. [DOI] [PMC free article] [PubMed] [Google Scholar]
- 3.Berland K.M., So P.T.C., Gratton E. Two-photon fluorescence correlation spectroscopy: method and application to the intracellular environment. Biophys. J. 1995;68:694–701. doi: 10.1016/S0006-3495(95)80230-4. [DOI] [PMC free article] [PubMed] [Google Scholar]
- 4.Chen Y., Wei L.N., Müller J.D. Unraveling protein-protein interactions in living cells with fluorescence fluctuation brightness analysis. Biophys. J. 2005;88:4366–4377. doi: 10.1529/biophysj.105.059170. [DOI] [PMC free article] [PubMed] [Google Scholar]
- 5.Macdonald P.J., Chen Y., Mueller J.D. Brightness analysis by z-scan fluorescence fluctuation spectroscopy for the study of protein interactions within living cells. Biophys. J. 2010;99:979–988. doi: 10.1016/j.bpj.2010.05.017. [DOI] [PMC free article] [PubMed] [Google Scholar]
- 6.Stefl M., Kułakowska A., Hof M. Simultaneous characterization of lateral lipid and prothrombin diffusion coefficients by z-scan fluorescence correlation spectroscopy. Biophys. J. 2009;97:L01–L03. doi: 10.1016/j.bpj.2009.05.031. [DOI] [PMC free article] [PubMed] [Google Scholar]
- 7.Humpolícková J., Gielen E., Engelborghs Y. Probing diffusion laws within cellular membranes by z-scan fluorescence correlation spectroscopy. Biophys. J. 2006;91:L23–L25. doi: 10.1529/biophysj.106.089474. [DOI] [PMC free article] [PubMed] [Google Scholar]
- 8.Benda A., Benes M., Hof M. How to determine diffusion coefficients in planar phospholipid systems by confocal fluorescence correlation spectroscopy. Langmuir. 2003;19:4120–4126. [Google Scholar]
- 9.Swanstrom R., Wills J.W. Synthesis, assembly, and processing of viral proteins. In: Weiss R., Teich N., Varmus H., Coffin J.M., editors. Retroviruses. Cold Spring Harbor Laboratory Press; Cold Spring Harbor, NY: 1997. pp. 263–334. [PubMed] [Google Scholar]
- 10.Klein K.C., Reed J.C., Lingappa J.R. Intracellular destinies: degradation, targeting, assembly, and endocytosis of HIV Gag. AIDS Rev. 2007;9:150–161. [PubMed] [Google Scholar]
- 11.Gheysen D., Jacobs E., De Wilde M. Assembly and release of HIV-1 precursor Pr55gag virus-like particles from recombinant baculovirus-infected insect cells. Cell. 1989;59:103–112. doi: 10.1016/0092-8674(89)90873-8. [DOI] [PubMed] [Google Scholar]
- 12.Karacostas V., Nagashima K., Moss B. Human immunodeficiency virus-like particles produced by a vaccinia virus expression vector. Proc. Natl. Acad. Sci. USA. 1989;86:8964–8967. doi: 10.1073/pnas.86.22.8964. [DOI] [PMC free article] [PubMed] [Google Scholar]
- 13.Chen Y., Wu B., Mueller J.D. Fluorescence fluctuation spectroscopy on viral-like particles reveals variable gag stoichiometry. Biophys. J. 2009;96:1961–1969. doi: 10.1016/j.bpj.2008.10.067. [DOI] [PMC free article] [PubMed] [Google Scholar]
- 14.Grigsby I.F., Zhang W., Mansky L.M. Biophysical analysis of HTLV-1 particles reveals novel insights into particle morphology and Gag stoichiometry. Retrovirology. 2010 doi: 10.1186/1742-4690-7-75. [DOI] [PMC free article] [PubMed] [Google Scholar]
- 15.Carlson L.A., Briggs J.A., Kräusslich H.G. Three-dimensional analysis of budding sites and released virus suggests a revised model for HIV-1 morphogenesis. Cell Host Microbe. 2008;4:592–599. doi: 10.1016/j.chom.2008.10.013. [DOI] [PMC free article] [PubMed] [Google Scholar]
- 16.Zhou W.J., Resh M.D. Differential membrane binding of the human immunodeficiency virus type 1 matrix protein. J. Virol. 1996;70:8540–8548. doi: 10.1128/jvi.70.12.8540-8548.1996. [DOI] [PMC free article] [PubMed] [Google Scholar]
- 17.Resh M.D. A myristoyl switch regulates membrane binding of HIV-1 Gag. Proc. Natl. Acad. Sci. USA. 2004;101:417–418. doi: 10.1073/pnas.0308043101. [DOI] [PMC free article] [PubMed] [Google Scholar]
- 18.Tang C., Loeliger E., Summers M.F. Entropic switch regulates myristate exposure in the HIV-1 matrix protein. Proc. Natl. Acad. Sci. USA. 2004;101:517–522. doi: 10.1073/pnas.0305665101. [DOI] [PMC free article] [PubMed] [Google Scholar]
- 19.Le Blanc I., Blot V., Dokhélar M.C. Intracellular distribution of human T-cell leukemia virus type 1 Gag proteins is independent of interaction with intracellular membranes. J. Virol. 2002;76:905–911. doi: 10.1128/JVI.76.2.905-911.2002. [DOI] [PMC free article] [PubMed] [Google Scholar]
- 20.Wang H.T., Machesky N.J., Mansky L.M. Both the PPPY and PTAP motifs are involved in human T-cell leukemia virus type 1 particle release. J. Virol. 2004;78:1503–1512. doi: 10.1128/JVI.78.3.1503-1512.2004. [DOI] [PMC free article] [PubMed] [Google Scholar]
- 21.Jouvenet N., Bieniasz P.D., Simon S.M. Imaging the biogenesis of individual HIV-1 virions in live cells. Nature. 2008;454:236–240. doi: 10.1038/nature06998. [DOI] [PMC free article] [PubMed] [Google Scholar]
- 22.Thompson N.L. Fluorescence correlation spectroscopy. Topics Fluor. Spectrosc. 1991;1:337–378. [Google Scholar]
- 23.Resh M.D. Intracellular trafficking of HIV-1 Gag: how Gag interacts with cell membranes and makes viral particles. AIDS Rev. 2005;7:84–91. [PubMed] [Google Scholar]
- 24.Saad J.S., Miller J., Summers M.F. Structural basis for targeting HIV-1 Gag proteins to the plasma membrane for virus assembly. Proc. Natl. Acad. Sci. USA. 2006;103:11364–11369. doi: 10.1073/pnas.0602818103. [DOI] [PMC free article] [PubMed] [Google Scholar]
- 25.Göttlinger H.G., Sodroski J.G., Haseltine W.A. Role of capsid precursor processing and myristoylation in morphogenesis and infectivity of human immunodeficiency virus type 1. Proc. Natl. Acad. Sci. USA. 1989;86:5781–5785. doi: 10.1073/pnas.86.15.5781. [DOI] [PMC free article] [PubMed] [Google Scholar]
- 26.Lindwasser O.W., Resh M.D. Human immunodeficiency virus type 1 Gag contains a dileucine-like motif that regulates association with multivesicular bodies. J. Virol. 2004;78:6013–6023. doi: 10.1128/JVI.78.11.6013-6023.2004. [DOI] [PMC free article] [PubMed] [Google Scholar]
- 27.Briggs J.A.G., Riches J.D., Kräusslich H.G. Structure and assembly of immature HIV. Proc. Natl. Acad. Sci. USA. 2009;106:11090–11095. doi: 10.1073/pnas.0903535106. [DOI] [PMC free article] [PubMed] [Google Scholar]
- 28.Larson D.R., Ma Y.M., Webb W.W. Direct measurement of Gag-Gag interaction during retrovirus assembly with FRET and fluorescence correlation spectroscopy. J. Cell Biol. 2003;162:1233–1244. doi: 10.1083/jcb.200303200. [DOI] [PMC free article] [PubMed] [Google Scholar]
- 29.Derdowski A., Ding L.M., Spearman P. A novel fluorescence resonance energy transfer assay demonstrates that the human immunodeficiency virus type 1 Pr55Gag I domain mediates Gag-Gag interactions. J. Virol. 2004;78:1230–1242. doi: 10.1128/JVI.78.3.1230-1242.2004. [DOI] [PMC free article] [PubMed] [Google Scholar]
- 30.Skinner J.P., Chen Y., Müller J.D. Fluorescence fluctuation spectroscopy in the presence of immobile fluorophores. Biophys. J. 2008;94:2349–2360. doi: 10.1529/biophysj.107.115642. [DOI] [PMC free article] [PubMed] [Google Scholar]
- 31.Rayne F., Kajava A.V., Mamoun R.Z. In vivo homodimerization of HTLV-1 Gag and MA gives clues to the retroviral capsid and TM envelope protein arrangement. J. Mol. Biol. 2004;343:903–916. doi: 10.1016/j.jmb.2004.09.013. [DOI] [PubMed] [Google Scholar]
- 32.Rayne F., Bouamr F., Mamoun R.Z. The NH2-terminal domain of the human T-cell leukemia virus type 1 capsid protein is involved in particle formation. J. Virol. 2001;75:5277–5287. doi: 10.1128/JVI.75.11.5277-5287.2001. [DOI] [PMC free article] [PubMed] [Google Scholar]
Associated Data
This section collects any data citations, data availability statements, or supplementary materials included in this article.