

Abstract
We report on the formation of the secondary and tertiary structure of bacteriorhodopsin during its in vitro refolding from an SDS-denatured state. We used the mobility of single spin labels in seven samples, attached at various locations to six of the seven helical segments to engineered cysteine residues, to follow coil-to-helix formation. Distance measurements obtained by spin dipolar quenching in six samples labeled at either the cytoplasmic or extracellular ends of pairs of helices revealed the time dependence of the recovery of the transmembrane helical bundle. The secondary structure in the majority of the helical segments refolds with a time constant of <100–140 ms. Recovery of the tertiary structure is achieved by sequential association of the helices and occurs in at least three distinct steps with time constants of 1), well below 1 s; 2), 3–4 s; and 3), 60–130 s (the latter depending on the helical pair). The slowest of these processes occurs in concert with recovery of the retinal chromophore.
Abbreviations used: BR, bacteriorhodopsin; CHAPS, 3-[(3-Cholamidopropyl)dimethylammonio]-1-propanesulfonate; CD, circular dichroism; CW-ESR, continuous wave electron spin resonance; DMPC, 1,2-Dimyristoyl-sn-glycero-3-phosphocholine; DTT, dithiothreitol; MTSL or R1, (1-oxyl-2,2,5,5-tetramethylpyrolinyl-3-methyl)-methanethiosulfonate; SDS, sodium dodecyl sulfate; SDSL, site-directed spin labeling
Introduction
In this study we investigated the in vitro refolding of the α-helical bundle BR. This integral membrane protein is the simplest α-helical membrane protein and has been extensively studied. Khorana and co-workers (1–4) established a procedure for its in vitro partial unfolding and refolding Their observation that such refolding is spontaneous and independent of any helping machinery supports the idea of spontaneous helix formation in membranes (5,6). Booth and co-workers (7–14) used the SDS-denatured state of BR as a starting point for many detailed kinetic studies on the in vitro refolding of this protein. In a recent study using site-specific fluorescent labeling at several residue positions, Compton et al. (15) suggested positional differences in the kinetics of refolding in helix D, implying variable structural changes along the helix.
The diffraction structure of BR at 1.55 Å resolution revealed a trimer with each monomer consisting of a hepta-helical transmembrane bundle (16), and the structural basis of its function as a light-driven proton pump (17). The seven helices enclose a retinal whose photoisomerization from all-trans to 13-cis triggers the first step of the light-dependent proton transport (2). Here, we report on the kinetics of the refolding of the helices and the association of pairs of helices of BR, starting from the partially denatured state present in SDS micelles. We hypothesized that the kinetics of association of the individual pairs of helices would differ from the previously measured global kinetics (10,18,19), and that understanding of this kinetics would lead to a molecular-level refolding model for this transmembrane protein. Little is known about the unfolding of the protein in SDS. The only molecular-level data available for helix-helix interactions of BR in SDS micelles to date were obtained by Renthal and Alloor (20), who performed fluorescence quenching in retinal bleached BR and found that the distance between sites on helices B and F changed by only 2 Å when the protein was in SDS micelles.
The technique we used in this study, ESR spectroscopy, has been used extensively to study membrane proteins (21–27). The method is sensitive to local environmental changes of the spin label, which is covalently attached to specific locations of interest on the protein through site-directed cysteine mutations. A popular reagent used for such modifications is MTSL R1 label with a thiol-reactive end group. It has been shown that R1 substitutions cause minimal structural perturbations in T4 lysozyme (28). The use of ESR and SDSL in combination has been well established for studying membrane protein structure and dynamics (21,29). The data acquired from ESR experiments report on dynamic parameters such as the spin-label side-chain mobility, the solvent accessibility of the spin-label side chain, the distance of the side chain from a second nitroxide label, and the polarity of the environment exposed to the side chain. In this study, we primarily employed mobility changes and distance estimation.
Materials and Methods
Spin labeling
The labeling reaction was carried out in a purple membrane suspension. Before adding the R1 reagent to label the engineered cysteines, we reduced the cysteine residues by incubating the samples in excess DTT for 30 min. The reducing agent was then removed by four sequential 50× dilutions with 100 mM sodium phosphate buffer (pH 6.5) followed by centrifugation and resuspension of the membranes. After the washing procedure was completed, a 10× molar excess of the R1 label was added and incubated at room temperature for 24 h. Excess label was then removed by four centrifugation and 50× dilution steps with 100 mM sodium phosphate buffer (pH 6.5). All of the labeling sites were chosen to be at the ends of the helices, where the SH group of cysteines is accessible (Fig. 1). We found that labels at several otherwise desirable locations were not accessible to the label, even in the presence of dimethylsulfoxide, which was previously used to enhance permeation of solutes across the membranes (30,31).
Figure 1.
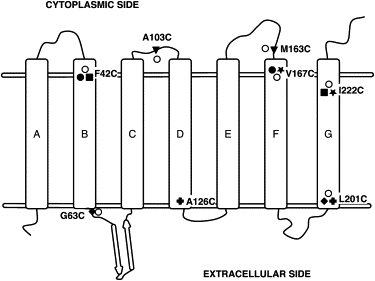
Topology diagram showing the locations of the designed cysteine mutations and labels in BR. The single mutants are shown as open circles and the double mutants are shown as shaded symbols. The residue locations for each pair of double mutants is represented with the same shaded symbol. The horizontal double lines approximate the membrane surfaces.
In vitro refolding
To increase the signal/noise ratio of the ESR spectrum, we made the initial concentration of the denatured samples 10-fold greater (100 μM) than that used in previous refolding experiments (2,3,7,10,14,19). The purple membrane was solubilized by addition of SDS in pH 6.5 phosphate buffer to maintain the 1:400 SDS/protein molar ratio of the previously established denaturing conditions (2,7). We regenerated the partially denatured BR in SDS micelles by adding an equal volume of DMPC/CHAPS micelle suspension (pH 6.5) as described elsewhere (7). The concentration of the latter was not scaled in our experiments, as we observed that the regeneration yield did not significantly change when we increased the DMPC/CHAPS micelle concentration from 2% to 5% (data not shown). This modified refolding procedure resulted in a 40–60% yield of the chromophore reconstitution, compared with a previously reported yield of 65–85% (7). It appears that a 10-fold higher SDS concentration combined with a lower DMPC+CHAPS micelle/protein ratio partially prevents chromophore regeneration and/or retinal binding. On the other hand, the rate constants for chromophore regeneration reported in previous studies (3,7,8) were reproduced in our experiments.
CW-ESR: equilibrium measurements
We obtained CW-ESR spectra of native, denatured, and regenerated equilibrium states of BR using a benchtop, high-sensitivity, X-band ESR spectrometer (Miniscope MS 300; Magnettech, Berlin, Germany) equipped with a rectangular resonator (TE102). The 12–20 μL spin-labeled samples (100 μM native BR, 90 μM denatured BR, and 45 μM regenerated BR) were placed in glass capillaries (outer diameter: ∼5 mm) and inserted into the resonator such that the sample occupied the entire cavity. The instrument settings were as follows: 25 mW microwave power, 1 G amplitude modulation, ∼3398–3341 G center field depending on the sample, 100 KHz modulation frequency, and 200 G sweep width at a rate of 1 G/s. A power saturation analysis verified that the 25 mW microwave power setting used is in the linear range (data not shown).
CW-ESR: kinetic measurements
A stopped-flow setup for the Miniscope MS300 instrument was custom-built to investigate the refolding kinetics. An ESR-signal-neutral, high-pressure-rated Teflon tube directed the sample flow from the stopped-flow mixing chamber to the resonator. The capillary cell was modified to accommodate the Teflon tube (outer diameter: ∼5–6 mm), which was placed inside the stock rectangular resonator (TE102). The dead volume of this setup from mixing chamber to the ESR resonance cavity was ∼0.40 mL. The sample (0.5 mL) was injected after rapid mixing into the ESR cavity for each actuation of the stopped-flow pump. The resulting dead time was 100–140 ms.
We designed single-labeled BR mutants to follow the changes in mobility of the R1 spin label during the refolding process. We used double-labeled BR mutants on the ends of the pair helices to follow the approach of the helices and the corresponding decrease in the distance between the pair of spin labels during helix bundle formation. A decrease in distance between the ends of the helices as they approach one another decreases the intensity of the central absorption peak of the R1 spin label and broadens the ESR spectrum (32). CW-ESR is sensitive to dipolar interactions between spins in a distance range of 5–20 Å. Both the single- and double-labeled samples were monitored for intensity changes at the central peak (∼3347 G) during refolding.
The ESR instrument settings for the kinetic experiments were as follows: 25 mW microwave power, 1 G amplitude modulation, ∼3398–3341 G center field depending on the sample, and 100 KHz modulation frequency. The time constant varied from 0.02 ms to 97 ms depending on the length of the measurement. We collected several repeated data sets for each sample for averaging and to improve the signal/noise ratio.
Light scattering
We measured the particle sizes for BR in SDS micelles and DMPC/CHAPS micelles using dynamic light scattering with a Zetasizer nano series instrument (Malvern Instruments, Worcestershire, UK). We then analyzed the time-dependent correlation of the scattering intensity obtained from the photon correlator using a built-in algorithm in the Zetasizer software to calculate the volume and number distributions.
Results
Earlier kinetic studies on refolding of BR revealed mainly global structural changes during its refolding from a partially denatured state in SDS micelles to a functionally regenerated state in DMPC/CHAPS micelles (7–10,14,15,33). In this work, we explored local structural changes and how they lead to regeneration of the fully folded state. We assumed that the mutations and the attachment of R1 spin label do not affect the folding kinetics and the final folded state of the protein. Previous investigations of other proteins suggested that perturbations of the backbone fold, thermal stability, and function resulting from introduction of the spin label do not pose a serious problem (28,29).
Changes in micelle size upon refolding
To interpret the contribution of rotational motion of the protein embedded in micelles to EPR mobility, we obtained volume distributions for BR in SDS micelles and DMPC/CHAPS micelles using dynamic light scattering (see Fig. S1 in the Supporting Material). The calculated average hydrodynamic radii of SDS micelles with denatured BR and DMPC/CHAPS micelles with regenerated BR were 31.6 Å and 29.8 Å, respectively, with a distribution full width at half-maximum of ∼10 Å for both samples. The intensity distributions had additional intensity peaks above 100 nm, mostly due to scattering from dust particles. The decrease in the average radius of the micellar structure in the regenerated state, as compared with the denatured state, may be due to an altered arrangement of the lipids and detergent molecules around the protein, and the tighter packing of the protein backbone expected in the refolded state.
Helix formation during refolding
Mobility changes during BR refolding were monitored at ∼3341 G at the positive peak of the central resonance line of the ESR derivative spectrum. Broadening of the central resonance peak and its corresponding decrease in intensity indicate a slower rotational mobility at the location of the spin label. This mobility decrease can be visualized as the result of an increased rigidity of backbone, reduced rotational isomerization about the bonds linking nitroxide to the backbone due to interactions with the neighboring residues, restriction of the contributions from the rotational diffusion of the protein, or some combination thereof.
A previous systematic spin-labeling study of numerous sites on T4 lysozyme provided comprehensive information on mobility values that correspond to the structural rigidity of the protein backbone (28). According to the scale proposed by Mchaourab et al. (28), spin-label mobilities with ΔH0−1 values > 0.4 originate from a structural rigidity comparable to the backbone of a loop structure, ΔH0−1 values between 0.2 and 0.3 correspond to tertiary interactions with surrounding atoms, and values < 0.2 are highly immobilized and similar to buried sites in a protein. Since these mobility values were obtained with a soluble protein, the corresponding structural states may not be directly comparable to BR embedded in a bilayer or a micelle. However, it seems reasonable to consider ΔH0−1 values ≤ 0.2 as corresponding to helical structure.
Regardless of the location of the spin label, the mobility trends observed in the native, membrane-embedded structure of BR (N-state), BR in SDS micelle (D-state), and BR in DMPC/CHAPS micelles (R-state) are consistent with the idea of partial unfolding in the D-state (2) with a consequently reduced structural rigidity, and increased structural rigidity after the restoration of native-like structure in the R-state (Table 1). Although detailed structural insights from such an observation are limited, we did observe some local variations in the unfolding and refolding states. The differences in the mobilities of the labeled locations in the N- and R-states are very likely a result of the absence of crystal-like lattice packing and/or lack of recovery of some of the native folding in the R-state.
Table 1.
Mobility of spin-labeled locations
| Mutant | ΔH0-1 (G-1) |
||
|---|---|---|---|
| Native | Denatured | Regenerated | |
| F42CR1 | 0.110 | 0.421 | 0.175 |
| G63CR1 | 0.226 | 0.417 | 0.408 |
| A103CR1 | 0.188 | 0.470 | 0.249 |
| M163CR1 | 0.232 | 0.442 | 0.391 |
| V167CR1 | 0.164 | 0.472 | 0.401 |
| L201CR1 | 0.168 | 0.494 | 0.180 |
| I222CR1 | 0.190 | 0.428 | 0.288 |
Line-widths correspond to relative mobilities of the spin label in single-labeled BR samples in the native, denatured, and regenerated states. Data shown in bold refer to labels that detect a virtual absence of secondary structure.
A comparison of the D- and R-states reveals a smaller ΔH0−1 change in the V167CR1 and M163CR1 samples (Table 1 and Fig. 1), where the label is located near the highly unstructured EF loop of BR (PDB: 1C3W). A partial establishment of native contacts of this apparently unstructured EF-loop in R-state can explain the smaller change in the ΔH0−1 values observed in the above locations. G63CR1 is located near the β-turn that connects helices B and C (Fig. 1). The lack of significant change in mobility between the D-state and R-state at this location suggests a lack of refolding in the R-state in this region.
The location of the single labels in BR was chosen so that the spin labels would have the least number of intermolecular contacts in the native membrane-embedded state (except for G63CR1). Fig. 2 shows ESR spectra for the single-labeled samples. The R1 spin label attached to l-cysteine in SDS micelles and DMPC/CHAPS micelles (Fig. 2 H) was used to demonstrate that local viscosity changes do not affect the EPR mobility. For these samples, the nitrogen hyperfine tensor parameter Azz, which was measured at −40°C as an indication of the polarity of the microenvironment (34), illustrates that the label resides within the SDS and DMPC/CHAPS micelles (Azz = 3.53 and 3.62, respectively), as opposed to water (spectra not shown), because the Azz values in acetone and water are 3.55 and 3.66, respectively.
Figure 2.
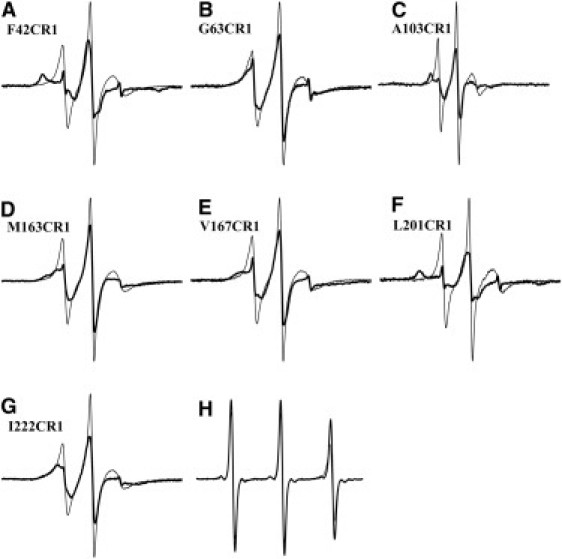
ESR spectrum of single-labeled denatured (thin lines) and regenerated (bold lines) states of F42CR1 (A), G63CR1 (B), A103CR1 (C), M163CR1 (D), V167CR1 (E), L201CR1 (F), and I222CR1 (G) BR samples, showing the difference in mobility of the spin label between the states. The spectra are normalized for equal numbers of spins in the D- and R-states. (H) Spectra of Cys+R1 in SDS micelles (thin line) and DMPC/CHAPS micelles (bold line).
The time course of change in central resonance peak intensity was monitored as a measure of the structural changes during the refolding of BR. The refolding procedure of the stopped-flow setup combined with CW-ESR dilutes the spin-labeled denatured sample by twofold when mixed with the regenerating buffer. This in turn causes a twofold reduction in the ESR signal at the central resonance peak (H0) that obscures an intensity change for the central resonance peak. To circumvent this problem, we followed the mobility changes starting with the refolded BR sample in the ESR cavity, and then by pushing in the denatured BR/regenerating buffer mixture through actuation of the stopped-flow pump. This strategy ensured that only the intensity changes at the central resonance peak (H0) of the ESR spectrum due to mobility changes during the refolding were observed. If the mobility changes associated with refolding from the D-state to the R-state are slow enough to be detectable by the stopped-flow setup, there should be an increase of the ESR signal at H0 from the insertion of a more mobile denatured sample into the ESR cavity with the mixing time constant, followed by an exponential decay that corresponds to recovery of the lesser mobility of the label upon refolding of the helices.
As expected, the label F42CR1 on the cytoplasmic end of helix B (Fig. 3 A) exhibits such a rise, followed by a double exponential decay with time constants of 8.4 s and 73 s at the central resonance peak. The two time constants were obtained from measurements on different timescales (0–12 s for the first time constant (Fig. 3 A, inset) and 0–200 s for the second (Fig. 3 A), each performed as three replicates). The rise kinetics is not explicitly shown in the figures, because there were too few data points from the rapid rise. Nevertheless, the rise is implicit with respect to the zero line (dotted line in Fig. 3). The kinetics of label A103CR1 (Fig. 3 C) also contains a rise, but it also exhibits a single exponential decay with a time constant of 25 s. However, the intensity changes observed for F42CR1 and A103CR1 account for only 5–10% of the expected total intensity change calculated from the corresponding static spectra of the end states, i.e., the denatured and regenerated states. Thus, the bulk of the helical segments B and D, on which these two spin labels report, refold more rapidly than the 100–140 ms mixing time.
Figure 3.
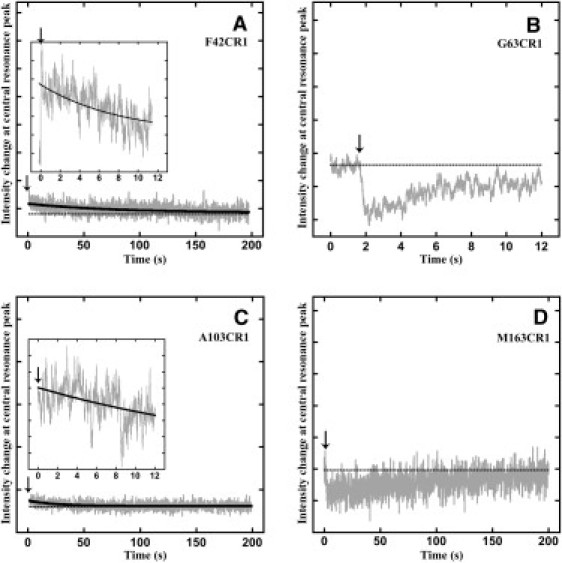
ESR mobility change kinetics measured at 3341 G for F42CR1 (A), G63CR1 (B), A103CR1 (C), and M163CR1 (D). The intensity change observed for F42CR1 and A103CR1 is ∼5% of the expected change (magnitudes shown in the insets). The dotted horizontal line in black represents the signal intensity at time zero of the measurement. The arrows point to the time of actuation of the stop-flow pump, which initiates mixing and thus refolding.
In contrast, the kinetics of changes in local mobility for the other single labels (A103CR1, M163CR1, V167CR1, and L201CR1) on helices D–G, respectively, showed little or no such change of the Ho intensity peak during the refolding from the D-state to the R-state (Figs. 3, C and D, and 4, A and B). Since before and after regeneration there is an observable mobility change of the spin label between the D- and R-states of each sample (Fig. 2), the complete lack of an observed ESR signal intensity change indicates that all of the mobility change associated with refolding must be much more rapid than the detectable limit (100–140 ms) of the stopped-flow setup. The absence of detectable signal for recovery of the secondary structure of at least four of the seven helices (with no data for helix C) indicates that the large majority of helices refold well within 1 s.
Figure 4.
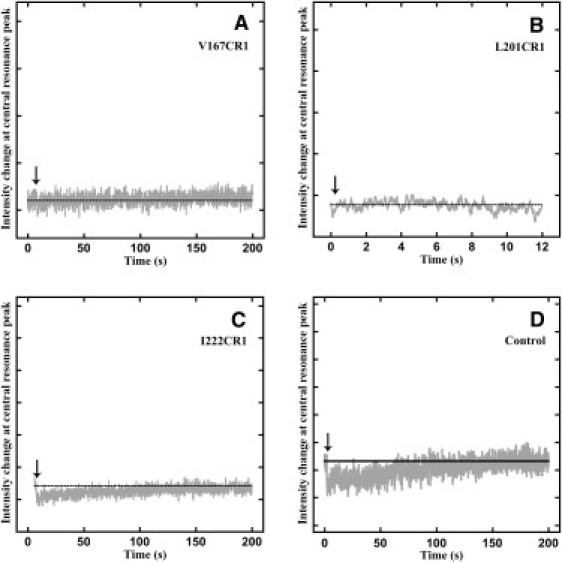
ESR mobility change kinetics measured at 3341 G for V167CR1 (A), L201CR1 (B), I222CR1 (C), and control with l-cysteine attached to MTSL spin label in regenerating buffer mixed with SDS micelles (D). The dotted horizontal line in black represents the signal intensity at time zero of the measurement. The arrows point to the time of actuation of the stop-flow pump, which initiates mixing and thus refolding.
The mobility change for G63CR1 and I222CR1 (Figs. 3 B and 4 C) showed a rapid decrease instead of the expected increase, and the central resonance peak H0 intensity slowly recovered to the initial intensity. This appears to be an artifact. A similar change was observed when the R1 spin label that was attached to l-cysteine in the DMPC/CHAPS micelles was mixed with SDS micelles (Fig. 4 D). This mobility change probably corresponds to micelle mixing, detected only at two of the studied locations in the protein, possibly because of the variable local environment of the spin label in the micelle. Any small signal from refolding would have been obscured by the artifact in these samples.
Interhelical distance changes during refolding
To measure the helix-helix interaction kinetics, we constructed double-labeled BR with spin-labeling sites located on the ends of various helices (Fig. 1). We chose the sites so that the distance between the spin labels would be ≤16 Å, to ensure a CW-EPR-detectable interaction between the spins. At room temperature, the broadening of the central resonance peak in double-labeled samples is a complex result of spin-spin interactions and motional line-broadening. Thus, the line shape of ESR spectrum of double-labeled pair of helices in the R-state, in comparison with the same sample in the D-state, will be attributable to combined changes in mobility of the two spin labels and the distance-dependent dipolar quenching of the interacting spins.
To verify the existence of a dipolar interaction between the two spin labels in the D- or R-state, we normalized the integrals of the spectra, for equal spins, in the spectra of potentially interacting spins (measured spectra) and in the spectra of noninteracting spins (sum of spectra for single labels) for both states (Fig. S2). Because the A126C mutant could not be successfully expressed, we were unable to estimate the presence of a dipolar interaction for the A126CR1/L201CR1 sample in the D- and R-states. In the D-state, there are only minor differences between the measured spectra and the spectra calculated for no interaction of the spins, suggesting that the distance of the spin labels is greater than the detectable 20 Å range for CW-ESR measurement. In the R-states (except for F42CR1/V167CR1; see Fig. S2 A′), however, the interacting spins have a considerably smaller intensity than the noninteracting spins, suggesting that the corresponding pairs of helical ends close in to within 20 Å. In the latter sample, the spin labels seem to be noninteracting for the measurable range allowed by the CW-ESR method. The measured decreases in intensity in the double-labeled samples before and after refolding (i.e., between the equilibrated D-state) are shown in Fig. S3.
The intensity change that is observed upon refolding is a combination of the changed mobility of the spin labels and the changed distance-dependent dipolar interaction between the spins. However, in measurements of the refolding kinetics, the mobility component in these samples (with the exception of F42CR1 and A103CR1) is too rapid to contribute to the observed signal (Figs. 3 and 4). Thus, the kinetics of the double-labeled experiment will reflect only the distance changes. In the case of F42CR1/V167CR1, since there is no detectable spin-spin interaction (Fig. S2 A′), the observed kinetics for this pair arises purely from mobility changes in the single labels. Fig. 5 shows the time-course of the dipolar interaction of labeled helix pairs during refolding. Table 2 summarizes the time constants for six double-labeled helix pairs on both the cytoplasmic and extracellular sides.
Figure 5.
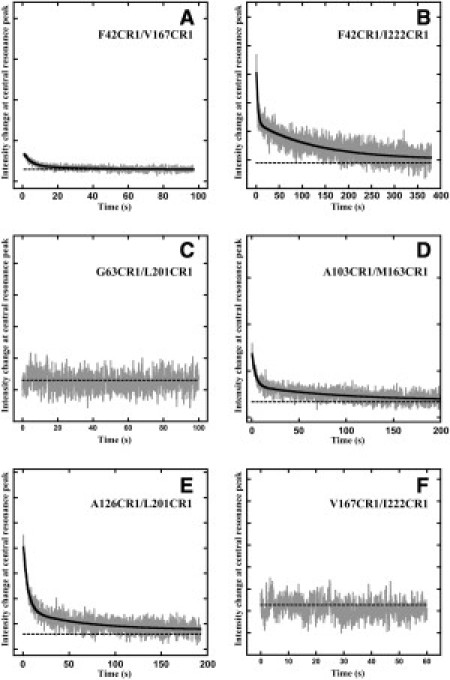
ESR dipolar interaction change kinetics measured at 3341 G for F42CR1/V167CR1 (A), F42CR1/I222CR1 (B), A103CR1/M163CR1 (C), V167CR1/I222CR1 (D), G63CR1/L201CR1 (E), and A126CR1/L201CR1 (F). The dotted horizontal line in black represents the signal intensity at time zero of the measurement.
Table 2.
Time constants for dipolar interaction kinetics
| Helices | Mutant | Cβ-Cβ distance (Å) | Time constants (s) and fractional amplitudes |
||
|---|---|---|---|---|---|
| τ1 | τ2 | τ3 | |||
| B–F (c) | F42CR1/V167CR1 | 11.3 | <0.1 (0.89) | 3.5 ± 0.5 (0.09) | 27.2 ± 10.2 (0.02) |
| B–G (c) | F42CR1/I222CR1 | 11.5 | <0.1 (0.39) | 2.9 ± 0.6 (0.38) | 123 ± 23.7 (0.23) |
| B–G (e) | G63CR1/L201CR1 | 13.1 | <0.1 | Not resolved | Not resolved |
| C–F (c) | A103CR1/M163CR1 | 10.8 | <0.1 (0.70) | 3.3 ± 0.3 (0.21) | 84.3 ± 15.6 (0.09) |
| D–G (e) | A126CR1/L201CR1 | 15.9 | <0.1 (0.46) | 5 ± 0.4 (0.42) | 69 ± 14.8 (0.12) |
| F–G (c) | V167CR1/I222CR1 | 13.2 | <0.1 | Not resolved | Not resolved |
Summary of time constants obtained from least-square fitting of the kinetics of dipolar interactions between spin labels on various helix pairs in BR. Cytoplasmic and extracellular label pairs are indicated by c and e, respectively. The Cβ-Cβ distances were obtained from the crystallographic structure, PDB code 1c3w (16). The fractional amplitudes with the time constant are shown in parentheses. The time constants and their standard errors are from three to five replicate experiments. Kinetics and fits are shown in Fig. 5.
The label pairs F42CR1/I222CR1, A103CR1/M163CR1, and A126CR1/L201CR1, on helices B/G, CD/F, and D/G, respectively, exhibit three time constants. The expected amplitude change for dipolar interaction (estimated by examining the denatured and regenerated equilibrium state spectra for each sample and appropriately subtracting the amplitude contribution from mobility changes) was greater than the observed amplitude changes, suggesting a rapid component (τ1) within the mixing dead time of the stopped-flow setup. The rest of the observable biexponential kinetics included a second time constant (τ2) of 3–5 s and a third time constant (τ3) of 60–130 s (Table 2 and Fig. 5, B, C, and F). The amplitude change associated with τ2 contributes 10–40% of the amplitude of the expected signal, and the second and third components comprise a much smaller fraction.
The labels V167CR1/I222CR1 on the cytoplasmic side and G63CR1/L201CR1 on the extracellular side exhibit no detectable change in the ESR signal, and thus are limited entirely by the 100–140 ms dead time of the instrumentation. The V167CR1 and I222CR1 labels are on the cytoplasmic ends of helices G and F, respectively, with the F-G loop connecting the two helices on the extracellular side. Given that there is no dipolar interaction between the spins in the D-state, and that the significant reduction in the signal intensity between these two states indicates a recovery of interaction (Fig. S3), the absence of a change in the kinetic trace (Fig. 5 D) suggests that the association of helices F and G, resulting in the formation of a helix hairpin, is more rapid than 100–140 ms. Similarly, the absence of an observed change for the label pair G63CR1/L201CR1 (Fig. S2 C, Fig. S3 C, and Fig. 5 C) indicates that the association of the extracellular ends of helices B and G is also very rapid.
The label pair F42CR1/V167CR1, located on the cytoplasmic ends of helices B and F, displays no dipolar quenching in the R-state (Fig. S2). The observed dipolar interaction kinetics arises entirely from mobility changes of each label, and, as in the case of the F42CR1 label, a large part of its amplitude was too rapid to be measured. The rest of the change was observed with τ2 = 4 s and τ3 = 31 s. The amplitude change associated with τ3 is much less than that associated with τ2 (Fig. 5 and Table 2), as observed at other residue positions.
The mobility change of F42R1 as a single label followed kinetics with τ2 = 8.4 s and τ3 = 73 s (Fig. 3 A), but none of the double-labeled samples that included F42CR1 exhibited this component. Similarly, A103CR1 revealed a τ = 25 s, but this component was unresolved in the A103CR1/M163CR1 sample. A possible explanation for this is that the observed intensity change associated with the mobility change has a smaller amplitude and may be lost in the noise of the dipolar signal of the double-labeled samples.
Discussion
The mobility changes observed between the D- and R-states of single-labeled BR samples arise from a combination of physical factors, namely, the flexibility of the protein backbone, rotational diffusion of the protein micelle ensemble, and rotational isomerization around the bonds linking the nitroxide of the spin label to the protein backbone.
When Fleissner et al. (34) analyzed the origin of spin-label mobility in crystal structures of several spin-labeled T4 lysozyme residues, they observed that the Cα—H…Sδ intraresidue interaction of the R1 spin label effectively immobilized the entire Cβ—Sγ—Sδ group. Of interest, the rotamers [X1, X2] were the same regardless of whether the side chain was engaged in inter- or intramolecular interactions (34). The dihedral angle X3 of the disulfide bond of the R1 side chain interconverts between two conformations (−90° or +90°) with an energy barrier of 10–20 kcal, which corresponds to rates on a timescale of microseconds or greater (35). Spin-label crystal structure studies (36) and modified spin-label studies (37) have shown that the dynamics of bonds X1, X2, and X3 are highly restricted in the standard X-band ESR-detectable time range (1 ns < τ < 50 ns) (38,39). Thus, the observed anisotropy of the nitroxide spin label R1 on the nanosecond timescale of the ESR measurements is the result of internal torsions of X4 and X5, which are observed as a broadening of the ESR line shape with increasingly restricted motion of the label (40). The labeling sites were chosen at helical ends where they are unlikely to make side-chain interactions with other parts of the protein. Indeed, it was previously observed by Mchaourab et al. (41) that steric interaction with nearest neighbors does not deter the internal motions of the nitroxide side chain. Therefore, it is reasonable to assume that the internal motion contributions from X4 and X5 are the same in the denatured D-state and the regenerated R-state.
From the light-scattering results, we estimate the average hydrodynamic radii of an equivalent sphere of BR in SDS micelles and regenerated BR in DMPC/CHAPS micelles to be 31.6 Å and 29.8 Å, respectively (Fig. S1). Considering that the instrumental error of the measurement is ∼0.3 Å, the difference between the samples is significant. The rotational correlation times estimated for these ensembles calculated using the Stokes-Einstein-Debye relation (42) for mean hydrodynamic radius, assuming l = 0 for spherical harmonics order, translates to 190 ns for BR in SDS micelles and 161 ns for BR in DMPC/CHAPS micelles. The viscosity of the solution was assumed to be that of pure water at 298 K. Because the SDS and DMPC/CHAPS micelles have a higher viscosity than water, the actual rotational correlation time will be higher than the calculated value. The relatively slow rotational motion excludes any contribution from rotational diffusion mobility of the BR micelle ensemble in both the D- and R-states to the measured ESR spectrum, as the CW-ESR-sensitive time range for detecting mobility is 1–50 ns.
Columbus and Hubbell (43) observed a striking positive correlation between the NMR order parameter of the N-H bond in the peptide backbone and the scaled mobility parameter from ESR spectra for residues in a helix. Mchaourab et al. (28) observed that the ESR spectra of R1 label are clearly modulated by fluctuations of the backbone in T4 lysozyme. Assuming that the contributions from the internal motions of the label in BR are comparable between the D-state and R-state, the significant variation in motion of the nitroxide side chain observed between these states can be directly attributed to a contribution from local backbone dynamics on the nanosecond timescale. We found no detectable kinetics of this backbone mobility change for the single-labeled helical ends, except for labels F42CR1 on helix B and A103CR1 on helix D, suggesting that the structural changes associated with this mobility change occur within the instrumental limit of 100–140 ms. The intensity changes observed for F42CR1 (Fig. 3 A) and A103CR1 (Fig. 3 C) amounted to only ∼5–10% of the expected change, suggesting a large, unresolved, fast component. Thus, recovery of the secondary structure of the helices has a very rapid phase associated with the majority of the structural change.
In an previous time-resolved CD study of the renaturation process, Tombolato et al. (39) reported that a smaller fraction (60%) of the expected signal arose too rapidly to be accounted for (i.e., in <20 s), and the rest recovered with a 90 s time constant. For helix B, we observed a comparable time constant of 73 s for decreased backbone mobility (Fig. 3 A), and helix D (Fig. 3 C) showed a similar slow component with a time constant of 25 s. It is important to note, however, that CD reports on the overall helical content change that occurs during the refolding process, whereas the intensity change measured with the spin-label method reports on local changes.
Because the regenerated sample for F42CR1/V167CR1 (Fig. S2 A′) shows no spin-spin interaction, we conclude that the observed kinetics (Fig. 5 B) originates entirely from mobility changes of the contributing spin labels. Fig. 5 B is appropriately rescaled for the expected single intensity change. Of the two labels, only F42CR1 (Fig. 3 A) shows any detectable mobility change. The noise level in the single-labeled measurements complicates the resolution of the individual components. The double-labeled samples have improved signal/noise levels because they have twice the spin-label content for the given concentration of the sample, and thus the components are better resolved.
The A103CR1 single label showed a detectable exponential decay of the signal (Fig. 3 C) with a time constant of 25 s, but this phase was unresolved in the double-labeled sample A103CR1/M163CR1 (Fig. 5 D).
CD spectra indicate that in the D-state, BR retains ∼50% of the initial helicity (2). In a separate study, we concluded from DEER distance measurements of labels at the ends of each helix that in the D-state most helices retain some of their N-state secondary structure despite disruption of the helices (V. Krishnamani and J. K. Lanyi, unpublished). Moreover, molecular-dynamics simulations of unfolding of individual helices showed that, in general, the C-terminal helices (F and G) are more unstable than the N-terminal helices (A and B) in the SDS micelles (V. Krishnamani and J. K. Lanyi, unpublished). The presence of charged residues in the transmembrane segment promotes the partitioning of the helix to the micellar surface. Local unfolding of the helical structure was concentrated near the charged residues.
The dipolar interaction between two spins is proportional to the inverse cube of the distance between the spin labels. Because the dipolar interaction is nearly a step function of distance, the measured kinetics should reflect a shift of the population among distinct states, i.e., from the unfolded to any distinct folding intermediate, and then to the refolded state, rather than the time-course of the approach of the helical ends to one another.
We considered two possible models for the observed kinetics. In the first model, the multiexponential helix association kinetics originates from refolding of several distinct starting state ensembles. Although this cannot be entirely ruled out, there is no direct evidence for the presence of distinct subensembles in the partially denatured state in the SDS micelles. The simplest alternative (the second model for the observed multiexponential kinetics of helix association) is that refolding produces distinct intermediate states for each measured helix pair. All helix pairs begin to associate in a rapid process (<100–140 ms), but with different amplitudes. In two helix pairs (G63CR1/L201CR1 and V167CR1/I222CR1), the entire association occurs too rapidly to be measured. It should be noted that one of these pairs, V167CR1/I222CR1, forms the ends of a hairpin of helices F and G. Two slower refolding time constants are observed for distance changes in three of the six helix pairs, and in this model they originate from further steps in the approach of the helices to one another. The three helical pairs (F42CR1/I222CR1, A103CR1/M163CR1, and A126CR1/L201CR1) thus contribute to a loosely associated bundle with a time constant of 3–5 s, followed by final recovery of the original structure with additional time constants of tens of seconds. It is interesting to note that the helical pairs that exhibit a faster than measurable kinetics are adjacent to one another in the native membrane-embedded form. Since we did not observe a dipolar interaction for F42CR1/V167CR1 (Fig. S2 A′), we will consider this double-labeled pair in terms of mobility changes alone.
Thus, in this model the results suggest that the helices begin to associate on a timescale well within 1 s. For several of these helices this association is incomplete, in which case renaturation proceeds through two additional association steps in a sequential fashion. After their initial association is completed, the helices continue to move to their final locations with slower second and third time constants. The values of these time constants depend on the helical pair, with the corresponding structural change being a minor fraction of the total. The kinetics of chromophore regeneration of BR has a time constant of 70–140 s (data not shown), which is comparable to the slowest component observed in the helical association kinetics.
On the whole, the time constants we measured correspond well to those reported previously for the global refolding process. Kinetics measurements obtained by fluorescence quenching, CD, and visible spectroscopy (for the retinal chromophore) indicated that the apoprotein folds through two consecutive intermediates, I1 and I2, to form IO with approximate time constants of 0.1 s and 23 s, respectively (7,8,10,12). The majority of the helical structure is established in <20 s, and the rest is established more slowly but together with the formation of I2 (33). Retinal binding to the IO intermediate recovers the chromophore in two steps (44), with noncovalent binding of retinal to the IO intermediate with a time constant of 2 s followed by Schiff's base formation with a time constant of 140 s (8).
Conclusions
The secondary structure of all locations examined, except for labels A103CR1 and F42CR1, forms within 100–140 ms. Slower components are also observed in A103CR1 and F42CR1, but they account for only 5–10% of the expected intensity change. The smaller-magnitude change may reflect decreased mobility associated with tertiary structure formation. Association of the helices also occurs rapidly, but in three of the six helix pairs measured (F42CR1/I222CR1, A103CR1/M163CR1, and A126CR1/L201CR1) it is incomplete and they continue to associate with time constants of 3–4 s and then 30–130 s depending on the helical pair. Thus, there are intermediate events after which the helices further approach each other, with the final time constant being comparable to the time constant of the recovery of the chromophore (70–140 s). This supports the existence of intermediate states with loosely bound helices to which retinal binds and recovers the chromophore (7). We conclude, however, that refolding proceeds with different rates in different parts of the protein, and a global analysis does not fully describe it.
The structural changes associated with BR refolding from a partially denatured state in SDS micelles to the regenerated state in DMPC/CHAPS micelles are complex and consist of the following steps: 1), rapid recovery (<0.1 s) of the secondary structure of the helices; 2), rapid association of the helices to yield partially assembled states (with the exception of two helical pairs, one of which (helices F and G) forms a hairpin where all of the change is rapid); and 3), further helix association-related, structural changes that occur with time constants of 3–4 s and then 60–130 s depending on the helical pair. The slowest time constant is comparable to the time constant of the retinal chromophore and hence the functional protein.
Acknowledgments
V.K. was supported by grants to J.K.L. from the National Institutes of Health (5R37GM029498) and the Department of Energy (DEFG03-86ER13525).
Supporting Material
References
- 1.Huang K.S., Bayley H., Khorana H.G. Delipidation of bacteriorhodopsin and reconstitution with exogenous phospholipid. Proc. Natl. Acad. Sci. USA. 1980;77:323–327. doi: 10.1073/pnas.77.1.323. [DOI] [PMC free article] [PubMed] [Google Scholar]
- 2.Huang K.S., Bayley H., Khorana H.G. Refolding of an integral membrane protein. Denaturation, renaturation, and reconstitution of intact bacteriorhodopsin and two proteolytic fragments. J. Biol. Chem. 1981;256:3802–3809. [PubMed] [Google Scholar]
- 3.London E., Khorana H.G. Denaturation and renaturation of bacteriorhodopsin in detergents and lipid-detergent mixtures. J. Biol. Chem. 1982;257:7003–7011. [PubMed] [Google Scholar]
- 4.Liao M.J., London E., Khorana H.G. Regeneration of the native bacteriorhodopsin structure from two chymotryptic fragments. J. Biol. Chem. 1983;258:9949–9955. [PubMed] [Google Scholar]
- 5.Popot J.L., Trewhella J., Engelman D.M. Reformation of crystalline purple membrane from purified bacteriorhodopsin fragments. EMBO J. 1986;5:3039–3044. doi: 10.1002/j.1460-2075.1986.tb04603.x. [DOI] [PMC free article] [PubMed] [Google Scholar]
- 6.Popot J.L., Gerchman S.E., Engelman D.M. Refolding of bacteriorhodopsin in lipid bilayers. A thermodynamically controlled two-stage process. J. Mol. Biol. 1987;198:655–676. doi: 10.1016/0022-2836(87)90208-7. [DOI] [PubMed] [Google Scholar]
- 7.Booth P.J., Flitsch S.L., Khorana H.G. Intermediates in the folding of the membrane protein bacteriorhodopsin. Nat. Struct. Biol. 1995;2:139–143. doi: 10.1038/nsb0295-139. [DOI] [PubMed] [Google Scholar]
- 8.Booth P.J., Farooq A., Flitsch S.L. Retinal binding during folding and assembly of the membrane protein bacteriorhodopsin. Biochemistry. 1996;35:5902–5909. doi: 10.1021/bi960129e. [DOI] [PubMed] [Google Scholar]
- 9.Booth P.J., Riley M.L., Wright P. Evidence that bilayer bending rigidity affects membrane protein folding. Biochemistry. 1997;36:197–203. doi: 10.1021/bi962200m. [DOI] [PubMed] [Google Scholar]
- 10.Booth P.J. Folding α-helical membrane proteins: kinetic studies on bacteriorhodopsin. Fold. Des. 1997;2:R85–R92. doi: 10.1016/s1359-0278(97)00045-x. [DOI] [PubMed] [Google Scholar]
- 11.Curran A.R., Templer R.H., Booth P.J. Modulation of folding and assembly of the membrane protein bacteriorhodopsin by intermolecular forces within the lipid bilayer. Biochemistry. 1999;38:9328–9336. doi: 10.1021/bi982322+. [DOI] [PubMed] [Google Scholar]
- 12.Lu H., Booth P.J. The final stages of folding of the membrane protein bacteriorhodopsin occur by kinetically indistinguishable parallel folding paths that are mediated by pH. J. Mol. Biol. 2000;299:233–243. doi: 10.1006/jmbi.2000.3735. [DOI] [PubMed] [Google Scholar]
- 13.Allen S.J., Kim J.M., Booth P.J. Structure and function in bacteriorhodopsin: the effect of the interhelical loops on the protein folding kinetics. J. Mol. Biol. 2001;308:423–435. doi: 10.1006/jmbi.2001.4604. [DOI] [PubMed] [Google Scholar]
- 14.Allen S.J., Curran A.R., Booth P.J. Folding kinetics of an α helical membrane protein in phospholipid bilayer vesicles. J. Mol. Biol. 2004;342:1279–1291. doi: 10.1016/j.jmb.2004.07.040. [DOI] [PubMed] [Google Scholar]
- 15.Compton E.L., Farmer N.A., Booth P.J. Kinetics of an individual transmembrane helix during bacteriorhodopsin folding. J. Mol. Biol. 2006;357:325–338. doi: 10.1016/j.jmb.2005.12.042. [DOI] [PubMed] [Google Scholar]
- 16.Luecke H., Schobert B., Lanyi J.K. Structure of bacteriorhodopsin at 1.55 A resolution. J. Mol. Biol. 1999;291:899–911. doi: 10.1006/jmbi.1999.3027. [DOI] [PubMed] [Google Scholar]
- 17.Lanyi J.K., Schobert B. Mechanism of proton transport in bacteriorhodopsin from crystallographic structures of the K, L, M1, M2, and M2′ intermediates of the photocycle. J. Mol. Biol. 2003;328:439–450. doi: 10.1016/s0022-2836(03)00263-8. [DOI] [PubMed] [Google Scholar]
- 18.Booth P.J., Curnow P. Membrane proteins shape up: understanding in vitro folding. Curr. Opin. Struct. Biol. 2006;16:480–488. doi: 10.1016/j.sbi.2006.06.004. [DOI] [PubMed] [Google Scholar]
- 19.Curnow P., Booth P.J. Combined kinetic and thermodynamic analysis of α-helical membrane protein unfolding. Proc. Natl. Acad. Sci. USA. 2007;104:18970–18975. doi: 10.1073/pnas.0705067104. [DOI] [PMC free article] [PubMed] [Google Scholar]
- 20.Renthal R., Alloor S.R. Partially unfolded membrane protein has a compact conformation. FASEB J. 2006;20:A519. [Google Scholar]
- 21.Altenbach C., Marti T., Hubbell W.L. Transmembrane protein structure: spin labeling of bacteriorhodopsin mutants. Science. 1990;248:1088–1092. doi: 10.1126/science.2160734. [DOI] [PubMed] [Google Scholar]
- 22.Thorgeirsson T.E., Xiao W., Shin Y.K. Transient channel-opening in bacteriorhodopsin: an EPR study. J. Mol. Biol. 1997;273:951–957. doi: 10.1006/jmbi.1997.1362. [DOI] [PubMed] [Google Scholar]
- 23.Pfeiffer M., Rink T., Steinhoff H.J. Site-directed spin-labeling reveals the orientation of the amino acid side-chains in the E-F loop of bacteriorhodopsin. J. Mol. Biol. 1999;287:163–171. doi: 10.1006/jmbi.1998.2593. [DOI] [PubMed] [Google Scholar]
- 24.Mollaaghababa R., Steinhoff H.J., Khorana H.G. Time-resolved site-directed spin-labeling studies of bacteriorhodopsin: loop-specific conformational changes in M. Biochemistry. 2000;39:1120–1127. doi: 10.1021/bi991963h. [DOI] [PubMed] [Google Scholar]
- 25.Rink T., Pfeiffer M., Steinhoff H.J. Unraveling photoexcited conformational changes of bacteriorhodopsin by time resolved electron paramagnetic resonance spectroscopy. Biophys. J. 2000;78:1519–1530. doi: 10.1016/S0006-3495(00)76704-X. [DOI] [PMC free article] [PubMed] [Google Scholar]
- 26.Wegener A.A., Chizhov I., Steinhoff H.J. Time-resolved detection of transient movement of helix F in spin-labelled pharaonis sensory rhodopsin II. J. Mol. Biol. 2000;301:881–891. doi: 10.1006/jmbi.2000.4008. [DOI] [PubMed] [Google Scholar]
- 27.Xiao W., Brown L.S., Shin Y.K. Light-induced rotation of a transmembrane α-helix in bacteriorhodopsin. J. Mol. Biol. 2000;304:715–721. doi: 10.1006/jmbi.2000.4255. [DOI] [PubMed] [Google Scholar]
- 28.Mchaourab H.S., Lietzow M.A., Hubbell W.L. Motion of spin-labeled side chains in T4 lysozyme. Correlation with protein structure and dynamics. Biochemistry. 1996;35:7692–7704. doi: 10.1021/bi960482k. [DOI] [PubMed] [Google Scholar]
- 29.Hubbell W.L., Altenbach C. Investigation of structure and dynamics in membrane-proteins using site-directed spin-labeling. Curr. Opin. Struct. Biol. 1994;4:566–573. [Google Scholar]
- 30.Misch D.W., Misch M.S. The effect of dimethyl sulfoxide on a lysosomal membrane. Ann. N. Y. Acad. Sci. 1975;243:54–59. doi: 10.1111/j.1749-6632.1975.tb25343.x. [DOI] [PubMed] [Google Scholar]
- 31.Aracava Y., Schreier S., Smith I.C. Spin label reduction kinetics, a procedure to study the effect of drugs on membrane permeability: the effects of monosodium urate, dimethyl sulfoxide and amphotericin B. J. Biochem. Biophys. Methods. 1981;5:83–94. doi: 10.1016/0165-022x(81)90009-9. [DOI] [PubMed] [Google Scholar]
- 32.Rabenstein M.D., Shin Y.K. Determination of the distance between two spin labels attached to a macromolecule. Proc. Natl. Acad. Sci. USA. 1995;92:8239–8243. doi: 10.1073/pnas.92.18.8239. [DOI] [PMC free article] [PubMed] [Google Scholar]
- 33.Riley M.L., Wallace B.A., Booth P.J. Slow α helix formation during folding of a membrane protein. Biochemistry. 1997;36:192–196. doi: 10.1021/bi962199r. [DOI] [PubMed] [Google Scholar]
- 34.Fleissner M.R., Cascio D., Hubbell W.L. Structural origin of weakly ordered nitroxide motion in spin-labeled proteins. Protein Sci. 2009;18:893–908. doi: 10.1002/pro.96. [DOI] [PMC free article] [PubMed] [Google Scholar]
- 35.Jocelyn P.C. Academic Press; London/New York: 1972. Biochemistry of the SH Group: The Occurrence, Chemical Properties, Metabolism and Biological Function of Thiols and Disulphides. [Google Scholar]
- 36.Langen R., Oh K.J., Hubbell W.L. Crystal structures of spin labeled T4 lysozyme mutants: implications for the interpretation of EPR spectra in terms of structure. Biochemistry. 2000;39:8396–8405. doi: 10.1021/bi000604f. [DOI] [PubMed] [Google Scholar]
- 37.Columbus L., Kálai T., Hubbell W.L. Molecular motion of spin labeled side chains in α-helices: analysis by variation of side chain structure. Biochemistry. 2001;40:3828–3846. doi: 10.1021/bi002645h. [DOI] [PubMed] [Google Scholar]
- 38.Hubbell W.L., Cafiso D.S., Altenbach C. Identifying conformational changes with site-directed spin labeling. Nat. Struct. Biol. 2000;7:735–739. doi: 10.1038/78956. [DOI] [PubMed] [Google Scholar]
- 39.Tombolato F., Ferrarini A., Freed J.H. Dynamics of the nitroxide side chain in spin-labeled proteins. J. Phys. Chem. B. 2006;110:26248–26259. doi: 10.1021/jp0629487. [DOI] [PMC free article] [PubMed] [Google Scholar]
- 40.Tombolato F., Ferrarini A., Freed J.H. Modeling the effects of structure and dynamics of the nitroxide side chain on the ESR spectra of spin-labeled proteins. J. Phys. Chem. B. 2006;110:26260–26271. doi: 10.1021/jp062949z. [DOI] [PMC free article] [PubMed] [Google Scholar]
- 41.Mchaourab H.S., Kálai T., Hubbell W.L. Motion of spin-labeled side chains in T4 lysozyme: effect of side chain structure. Biochemistry. 1999;38:2947–2955. doi: 10.1021/bi9826310. [DOI] [PubMed] [Google Scholar]
- 42.Köddermann T., Ludwig R., Paschek D. On the validity of Stokes-Einstein and Stokes-Einstein-Debye relations in ionic liquids and ionic-liquid mixtures. ChemPhysChem. 2008;9:1851–1858. doi: 10.1002/cphc.200800102. [DOI] [PubMed] [Google Scholar]
- 43.Columbus L., Hubbell W.L. A new spin on protein dynamics. Trends Biochem. Sci. 2002;27:288–295. doi: 10.1016/s0968-0004(02)02095-9. [DOI] [PubMed] [Google Scholar]
- 44.Schreckenbach T., Walckhoff B., Oesterhelt D. Specificity of the retinal binding site of bacteriorhodopsin: chemical and stereochemical requirements for the binding of retinol and retinal. Biochemistry. 1978;17:5353–5359. doi: 10.1021/bi00618a005. [DOI] [PubMed] [Google Scholar]
Associated Data
This section collects any data citations, data availability statements, or supplementary materials included in this article.