

Abstract
Purpose
To test the hypothesis that narrowing of cranial blood vessels in cholesterol-fed rabbits is a function of the duration of the high cholesterol diet. Such neurovascular changes, caused by elevated serum cholesterol, are linked to stroke and Alzheimer's disease risk.
Materials and Methods
Four groups of New Zealand White rabbits were studied. Six were fed a normal diet, 19 were fed a 2% cholesterol diet with 0.12 ppm copper in the drinking water for 8 weeks, 10 weeks, or 12 weeks. Time-of-flight (TOF) MR angiography (MRA) at 3 Tesla was used to measure arterial diameters in 11 vessels. Previously published data for amyloid β-peptide (Aβ) accumulation in the brains measured postmortem were correlated to vessel diameters. Ventricular volumes of rabbits were measured on group-averaged data.
Results
Several vessel diameters decreased with cholesterol diet duration. The posterior communicating arteries showed the largest significant effect. Aβ accumulation was inversely correlated with arterial diameter. Ventricular volumes between the normal diet and 12 weeks cholesterol-fed groups were not significantly different.
Conclusion
Reduction in vessel diameter of mediumsized vessels but not large vessels was measured in these hypercholesterolemic rabbits. The vessel diameter narrowing and cortical Aβ deposition occurred before measurable ventricular enlargement.
Keywords: cerebrovascular, amyloid β-peptide, Aβ, TOF-MRA, MRI, angiography, cholesterol, rabbit, copper, Alzheimer's disease, stroke
ALZHEIMER's DISEASE (AD) IS a degenerative neurological disorder that affects more than 5 million Americans and their families. Epidemiological studies indicate a strong link between AD and cardiovascular risk factors such as high blood pressure, heart disease, stroke, diabetes, and high cholesterol (1–4). The cardiovascular factors suggest a possible neurovascular component to AD and evidence has been accumulating recently to support this idea (5–8). Since 1975 (9), amyloid β-peptide (Aβ) accumulation in cortical tissue and vessels has also been linked to cerebral amyloid angiopathy (CAA). A comprehensive review of studies of the neurovascular pathway in Alzheimer's Disease has recently been published (8).
A link has been established between Aβ and elevated cholesterol levels in the blood of AD patients (2,10–13) and clinical studies suggest a link between elevated cholesterol and increased risk of AD (10,14,15). Further evidence supports this idea. First, in the three-city study in France based on 9294 individuals, the authors identified a significant increase in the risk of dementia with hyperlipidemia (11). Second, the Nun study of 678 nuns (16) demonstrated a connection between cerebrovascular disease and AD. Participants with one or more lacunar infarcts had significantly more advanced disease than those without lacunae. This result was independent of the number of neurofibrillary tangles. Third, the Rotterdam study (14) of 1730 participants found that reduced cortical perfusion appeared before clinical dementia and reduced relative cerebral blood volume preceded brain atrophy seen on MRI. Thus, neurovascular dysfunction and neurodegenerative processes are both causal mechanisms in AD although neither has yet been established as the instigating insult (17–20). A dominant contributor to both processes is the deposition of neurotoxic Aβ in vessels and brain parenchyma.
The link between AD, arteriosclerosis, and hyper-cholesteremia is also being studied in an animal model of AD, the cholesterol-fed rabbit. The cholesterol-fed rabbit has a long history of being used as a model of atherosclerosis because a cholesterol diet can induce vascular lesions (21,22). The peripheral effects of feeding cholesterol to rabbits are atherosclerosis, inflammation, and liver pathology. As a result of elevated cholesterol, the liver produces increased lipo-proteins rich in cholesterol esters that stay in the bloodstream and lead to atherosclerotic lesions. High levels of low-density lipoprotein (LDL) trigger the endothelial cell expression of adherence molecules that mediate attachment of monocytes and lymphocytes to the rabbit artery wall that then migrate into the wall and result in fatty streaks (23). Oxidized LDL in the artery wall accumulates in macrophages that have differentiated from monocytes and develop into foam cells. Based on Sparks' observation that rabbits fed cholesterol also have Aβ staining in the brain (4,24), the cholesterol-fed rabbit has also been studied as an animal model of the cortical and vascular damage present in AD (13,24–26).
The Aβ accumulation seen in cholesterol-fed rabbits can include senile plaque-like structures in the hippo-campus and temporal lobe. Trace amounts of copper in drinking water may influence clearance of Aβ from the brain at the level of the interface between the blood and cerebrovasculature and combined with high cholesterol may be a key component to the accumulation of Aβ in the brain vessels and parenchyma, having a significant impact on learning and memory (26,27) The cholesterol-fed rabbit exhibits an AD-like decline of performance in classic conditioning of the nictating membrane when Aβ plaques form in the cortex (27).
The goal of this study was to find out if the cholesterol-fed rabbits exhibit changes in the cranial vessel diameters that are measurable by time-of-flight MR angiography (TOF-MRA). Also the data were tested to see if any observed vessel changes were correlated with differences in Aβ accumulation between the groups. The MRI images were also used to screen for hyperintensities on T2-weighted images indicative of stroke and hyperintensities on cerebrospinal fluid (CSF) -suppressed spoiled gradient-echo indicative of lacunae. To determine if neuronal loss was observable in these animals, ventricular volumes of the third and lateral ventricles were measured in two groups: the normal diet and 12-week cholesterol-fed rabbits as an index of cortical atrophy (28,29).
MATERIALS AND METHODS
Animals
A total of 25 male New Zealand White rabbits (Oryctolagus cuniculus) 3–4 months of age and weighing ~2 kg upon arrival were housed individually, with free access to Purina rabbit chow and water, maintained on a 12-h light/12-h dark cycle and treated following National Institutes of Health guidelines. Each of these rabbits received a combination of food and water, either normal Purina 5321 chow (0% cholesterol) (N) and distilled water (n = 6), or Purina 5321 chow plus 2% cholesterol and distilled water plus copper. The rabbits eating 2% cholesterol were kept on the diet for 8 weeks (8 weeks) n = 6, 10 weeks (10 weeks) n = 7, or 12 weeks (12 weeks) n 6. Cholesterol-fed rabbits given copper received copper sulfate in their distilled drinking water with a final copper concentration of 0.12 ppm (0.12 mg/L). MRI studies were performed immediately before euthanasia and subsequent histological analysis. Details of histological results including Aβ accumulations have been published previously (30). Another single rabbit on a normal diet was euthanized, and the brain was excised and then imaged for use as a template in the analysis.
MRI Methods
Animals were anesthetized using 27.7 mg/kg ketamine and 5.7 mg/kg of xylazine injected subcutaneously 15 min before imaging. A General Electric Medical Systems 3 Tesla (T) MRI long-bore Signa clinical scanner was used with a 12 cm quadrature transmit/receive radio-frequency (RF) coil from Nova Medical Systems. The rabbit's head was supported on a Plexiglas table to position each rabbit in a similar prone position. The rabbit's body was extended onto foam supports with a heated Delta Phase Thermal pad (Braintree Scientific) under the torso to maintain core temperature of 36–38°C. Each rabbit MRI image data set was collected in less than 30 min.
The rabbits underwent four MRI scans: (i) a three-plane localizer scan to check animal positioning and prescribe the axial slices, (ii) an axial T1-weighted three-dimensional inversion-recovery spoiled gradient echo sequence (3D SPGR) for anatomical scanning with good gray/white matter differentiation and dark CSF; (iii) an axial T2-weighted fast spin-echo sequence (FSE) for anatomical scanning with good gray/white matter differentiation and some sensitivity to stroke lesions and bright CSF; and (iv) the axial time-of-flight (TOF) MRA sequence to image vessels.
All axial image sets covered below the most caudal end of the cerebellum to a slice past the rostral end of the olfactory bulbs. TOF and 3D-SPGR images were 1.6-mm slice thickness interpolated in the slice direction and reconstructed every 0.8 mm. The FSE images were collected with a 3.2-mm slice thickness. The TOF images had an inplane resolution of 0.156 × 0.156 mm. The 3D SPGR and FSE images had aninplane resolution of 0.3 × 0.3 mm. The image acquisition parameters were as follows: field-of-view = 80 × 60 mm for all images; matrix = 256 × 192 for 3D SPGR and FSE; matrix = 512 × 384 for TOF-MRA; for 3D SPGR – repetition time/echo time/inversion time (TR/TE/TI) = 10.4 ms./2.3 ms/300 ms, flip angle = 15 degrees, bandwidth = 11.9 kHz, number of acquisitions = 4, FSE − TR/TE/ETL = 2600 ms/14.2 ms/8, bandwidth = 12.5 kHz, 4 acquisitions, flow compensation in the slice direction, 3D TOF − TR/TE = 40 ms/5.7 ms, flip angle = 25 degrees, bandwidth = 11.9 kHz, 1 acquisition. Maximum intensity projection (MIP) images were created from the axial TOF images. The 36 MIP views were calculated by rotating about the long axis of the animal in steps of 10 degrees.
An excised brain of a rabbit on a normal diet was scanned separately to produce an MRI mask for image analysis. Proton density weighted images of the excised brain were collected using the same setup as for the live animals. The brain was packed tightly in the coil with foam to fix the position. An axial 2D FSE scan was performed − TR/TE = 9150 ms / 13.3 ms, bandwidth = 15.6 kHz, 2 acquisitions, 1-mm slice thickness, inplane resolution 0.3 × 0.3 mm. This rabbit on a normal diet was not from any of the groups used in the study because the study animals all had their brains removed and prepared for Aβ accumulation measurement as previously described (30).
MR Imaging Analyses
Although the 3D-SPGR and FSE images were not acquired for neuroradiological diagnosis or screening, for completeness each set of 3D-SPGR and FSE images were checked for anatomical abnormalities or aberrations such as asymptomatic stroke or hemorrhage. Images were also examined for evidence of either large or small vessel neurovascular disease. The TOF MRA images were checked for normal rabbit vascular anatomy following published comparative anatomy references (31,32).
The vessel diameters were measured on the source images following the full-width half-maximum (FWHM) signal method described by Hoogeveen et al (33). The axial 512 × 512 TOF source images were loaded into the image processing software package MRVISION (MRVISION, Inc.). Inplane resolution was 0.16 mm; slice resolution was interpolated to 0.6 mm. The common carotids, external and internal carotids just above the bifurcation, mid-basilar, vertebral arteries at cervical vertebrae C1, intradural vertebral arteries, posterior cerebral communicating, cavernous internal carotid arteries, and ophthalmic arteries were identified as shown in Figure 1. Data from the images were extracted by using a line drawing tool to obtain a plot of the signal intensity values across each vessel. The vessel diameter was measured as the FWHM of the TOF-MRA signal intensity. These measures were obtained using graphing software (Kaleidagraph, Synergy Software). Care was taken to ensure that vessel diameter measurements were not affected by intensity variation in adjacent tissues. The parameter λ, the ratio of the vessel diameter to the voxel spatial resolution (34), was measured. Diameter measurements were repeated three times to determine the reproducibility of the measurements.
Figure 1.

Top left: Internal carotid arteries (arrows) well visualized on TOF-MIP images. Top right: Source TOF axial image used to measure common carotid (bottom arrows) and vertebral arterial (top arrows) diameters. Bottom left: Source TOF axial image used to measure basilar (bottom arrow) and posterior communicating arteries (top arrows). Bottom right: Source TOF axial image used to measure internal carotid arteries (arrows).
The histological procedures and equipment for measurement of accumulation of Aβ peptide have been described (27). Briefly, rabbits were anesthetized deeply with a mixture of ketamine (500 mg/kg) and xylazine (100 mg/kg), blood was drawn from the heart, and the rabbits were perfused transcardially with 0.5% paraformaldehyde. Brains were extracted and postfixed for 14 days in 4% paraformaldehyde. Fifty-micrometer Vibratome sections of hippocampus and parahippocampal cortex of the brain were immunostained with an antibody to Aβ (10D5; provided by Dale Schenk of Elan Pharmaceuticals, San Diego) by using published peroxidase-antiperoxidase immunohistochemical methods (35). Immunoreactive neurons were counted as described (27).
To make ventricular volume measurements on the normal diet and 12-week cholesterol diet averaged rabbit brains, the following image processing steps were performed. With reference to the stereotaxic rabbit brain atlas by Urban and Richard (36) and the online rabbit brain atlas by Welker et al (37), manual brain/nonbrain segmentation was performed on the 3D SPGR images of the live rabbit brains for the two groups. Also, the single data set from the excised rabbit brain was converted to a set of binary images that were used as a mask for image registration. The FSL function FLIRT (38) (FMRIB's Linear Image Registration Tool) was used for image registration. To register the data sets before averaging, all in vivo data sets were aligned to the excised brain images. The affine 12 parameter (linear) registration model was used with search angles from −90° to 90° on each axis (indicating images are not aligned but in the same orientation), the correlation ratio cost function and the tri-linear final interpolation method. After registration to the mask images, the rabbit MRI group data sets were averaged. The two resulting MRI volumes are averaged images of six normal diet rabbit brains and six cholesterol-fed (12 weeks) rabbit brains.
The clearly defined third and lateral ventricles were chosen for volumetric analysis because the boundaries of the posterior lateral ventricles became difficult to define consistently near the cerebellum. To avoid complications in region of interest (ROI) selection due to boundary ambiguities, the lateral ventricles were measured from the superior edge of the cerebellum through the cerebral cortex. The ROI tracing tool in AFNI (39) was used to trace volumes. Tracing was repeated three times by two investigators (NE, SL) to calculate mean volumes and standard deviations of the measurement. MATLAB was used to overlay ROIs on the averaged brain data sets and calculate ROI volumes.
RESULTS
None of the animals exhibited any behavioral symptoms of neurological abnormality. As noted in the MRI Methods above, for completeness we examined the anatomical scans for abnormality. None of the scans, the three-plane gradient-echo localizer, the axial T1-weighted 3D IR-SPGR, or the axial T2-weighted FSE, indicated any lesions or abnormal anatomy in the brain parenchyma or the vasculature. No evidence of cerebrovascular disease was evident; either as T2-weighted hyperintensities typical of gross infarct or fluid-attenuated IR-SPGR hyperintensities typical of lacunae (40). All of the TOF MRA images showed normal vasculature with no notable variants (32,41). Measurements of 11 arteries, the common carotids, mid-basilar, vertebral arteries at cervical vertebrae C1, posterior cerebral communicating, cavernous internal carotid arteries, and ophthalmic arteries, were successful and are reported in Table 1 with the animal weights.
Table 1.
Means of Measurements of Weight and 11 Arterial Diameters (mm) in Four Rabbit Groups*
| Group | Wt (kg) | LCC | RCC | LV | RV | Bas. | LPCA | RPCA | LIC | RIC | LO | RO |
|---|---|---|---|---|---|---|---|---|---|---|---|---|
| μ (N) | 3.75 | 2.26 | 2.11 | 0.69 | 0.71 | 0.95 | 0.92 | 0.96 | 0.70 | 0.74 | 1.00 | 0.86 |
| STD | 0.28 | 0.23 | 0.25 | 0.12 | 0.14 | 0.49 | 0.28 | 0.16 | 0.18 | 0.22 | 0.31 | 0.32 |
| μ (8 wk) | 2.94 | 2.15 | 2.19 | 0.73 | 0.74 | 0.82 | 0.78 | 0.74 | 0.75 | 0.70 | 0.96 | 0.91 |
| STD | 0.41 | 0.30 | 0.28 | 0.33 | 0.33 | 0.18 | 0.31 | 0.21 | 0.25 | 0.22 | 0.13 | 0.15 |
| μ (10 wk) | 2.85 | 2.09 | 2.07 | 0.62 | 0.59 | 0.76 | 0.68 | 0.61 | 0.59 | 0.71 | 0.88 | 0.94 |
| STD | 0.21 | 0.25 | 0.20 | 0.09 | 0.06 | 0.18 | 0.15 | 0.21 | 0.05 | 0.22 | 0.20 | 0.18 |
| μ (12 wk) | 2.93 | 1.91 | 2.01 | 0.61 | 0.32 | 0.70 | 0.64 | 0.52 | 0.64 | 0.65 | 0.90 | 0.79 |
| STD | 0.15 | 0.32 | 0.32 | 0.10 | 0.27 | 0.14 | 0.14 | 0.32 | 0.21 | 0.22 | 0.15 | 0.25 |
| P value | 0.004 | 0.067 | 0.63 | 0.14 | 0.056 | 0.37a | 0.100a | 0.030 a | 0.45 | 0.29 | 0.46 | 0.75 |
All vessel diameter means are given in millimeters.
Vessel diameter changes that correlate over time with Aβ accumulation.
μ = mean; N = normal diet, STD = standard deviation, LCC/RCC = left/right common carotid, LV/RV = left/right vertebral; Bas = basilar, LPCA/RPCA = left/right posterior communicating artery, LIC/RIC = left/right internal carotid, LO/RO = left/right ophthalmic.
The most significant findings were that the percentage of change between the rabbits on a normal diet and the rabbits fed a diet with 2% cholesterol for 12 weeks were that the weights decreased by 22%, and three of the mid-sized parahippocampal vessels, the basilar and left and right posterior communicating arteries (LPCA and RPCA), also decreased in diameter by 26%, 30%, and 46%, respectively. The difference between the means was statistically significant (Student's two-tailed t-test type 1 with P value less than 0.05) for the weights, the Aβ accumulations (as reported elsewhere (30), and the RPCA. As seen in Figure 1, the RPCA and LPCA branch from the basilar artery to supply the hippocampal and parahippocampal temporal cortex. The Aβ accumulation was increased in the cholesterol-fed group by 82% in the hippocampal and 140% in the temporal lobes. The mean values for the four groups (N, 8 weeks, 10 weeks, 12 weeks) of the rabbit weight, accumulation of Aβ, and vessel diameters are given in Table 2, including the associated P values from a Student's t-test, two-tailed, calculated between the normal diet and 12-week cholesterol-fed groups. In Figure 2, bar graphs showing all left vessels (left graph) and all right vessels (right graph) as a function of the number of weeks rabbits were fed chow with 2% cholesterol added. No overall asymmetry, significant difference overall in left versus right, was seen although the RPCA decreased in size much more than did the LPCA.
Table 2.
Mean Values of the Four Groups for Rabbit Weight, Aβ Accumulation, Vessel Diameter
| Time(wks) | Weight (kg) | Hippocampus β-amyloid | Temporal cortex β-amyloid | Basilar diameter (mm) | Left PCA diameter (mm) | Right PCA diameter (mm) |
|---|---|---|---|---|---|---|
| 0 | 3.75 | 8.13 | 25.1 | 0.95 | 0.92 | 0.96 |
| 8 | 2.91 | 12.24 | 49.02 | 0.85 | 0.81 | 0.75 |
| 10 | 2.85 | 14.16 | 63.21 | 0.76 | 0.68 | 0.61 |
| 12 | 2.93 | 14.79 | 60.17 | 0.70 | 0.64 | 0.52 |
| %change | +81.92 | +139.72 | −26.32 | −30.43 | −45.83 | |
| P value | < 0.001 | < 0.001 | < 0.001 | =0.37 | =0.10 | =0.03 |
Figure 2.

Bar graphs showing all left vessels (left graph) and all right vessels (right graph) as a function of time rabbits were fed 2% cholesterol in the diet. No significant difference overall in left versus right was seen.
To characterize the association between the measurements over time, Pearson correlation coefficients were calculated between vessel diameters and Aβ accumulation, Table 3. The P values are from the table of critical values for the Pearson product-moment correlation coefficient, two-tailed. Although the left PCA and basilar artery changes in the mean values did not reach statistical significance at the P = 0.05 level, the correlation coefficient for the mean values of the vessel diameters to the Aβ accumulations did reach statistical significance. In Figure 3, bar graphs demonstrating the increase over time in mean hippo-campal and temporal lobe Aβ accumulation and the decrease over time in mean vessel diameter of the basilar and posterior communicating arteries.
Table 3.
Correlation Coefficients for Aβ Accumulations to Vessel Diameters Across the Four Groups
| Temporal cortex β-amyloid | Basilar artery diameter (mm) | Left PCA diameter (mm) | Right PCA diameter (mm) | |
|---|---|---|---|---|
| Hippocampus β-amyloid correlation | 0.99 | −0.97 | −0.97 | −0.99 |
| P value | 0.01 | 0.05 | 0.05 | 0.01 |
| Temporal cortex correlation | NA | −0.93 | −0.95 | −0.96 |
| P value | 0.1 | 0.05 | 0.05 |
Figure 3.
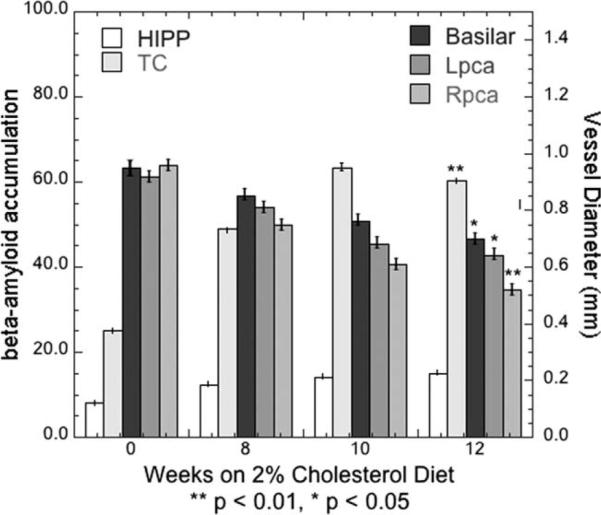
Bar graphs demonstrating the increase over time in mean hippocampal (HIPP) and temporal lobe (TC) Aβ accumulation and the decrease over time in mean vessel diameter of the basilar and posterior communicating arteries. The P values are for the Pearson product-moment correlation coefficients computed from the two-tailed t-test.
In the images used for measuring these vessels, the signal-to-noise ratio of the flow signal from vessels was always significantly higher (greater than 4:1) than in the surrounding static tissue as can be seen in the maximum intensity projections (MIPs) and source images in Figure 1. Repeated measurements of the vessel FWHM were always the same to less than 1 pixel (0.16 mm). The ratio of the vessel diameter to the image resolution (λ) (34) ranged from 3.3 to 6.1 for these measurements. Mean vessel diameters for each of the four groups are shown in Figure 3. The results are separated into left and right vessels with the basilar artery included on both graphs. The surrounding anatomy near the six other arteries, the external and internal carotids just above the bifurcation and the intradural vertebrals, obscured those vessels. The lower contrast-to-noise resulted in measurements that were not consistent or reproducible for those six vessels on all of the animals so those results are not presented.
The ventricular volumes measured on the averaged image data sets for the N and 12-week groups did not demonstrate a statistically significant increase in the cholesterol-fed animals. The ventricular volumes were measured for two of the four groups, rabbits fed normal chow, N, and the rabbits fed on the 2% cholesterol diet for 12 weeks. The averaged normal data set with the ventricle tracing overlaid in green is shown in Figure 4. All slices included in the measurement are shown in Figure 4. The three repeated tracing measurements by two investigators (N.E., S.L.) resulted in mean ventricular volumes of the averaged image data sets were N = 294 mm3 and 12 weeks = 306 mm3. Although these results tend to indicate a larger ventricular volume for the 12-week cholesterol fed animals, the standard deviation associated with these two means was 12 mm3 and so the difference was not statistically significant (P = 0.10).
Figure 4.

Ventricle tracing filled in and overlaid in green on an averaged normal data set. The slices that are shown start in cerebellum and move toward olfactory bulbs. Lateral ventricle tracing began after the cerebellum was no longer seen and continued through the lateral ventricles. The entire third ventricle was included in measurements.
DISCUSSION
To our knowledge, these are the first measurements of large and medium-sized cerebral artery narrowing in the cholesterol-fed rabbit model. These results are consistent with vascular inflammation (42), which could account for the observed vessel narrowing. The changes appear to have preceded any development of large or small vessel cerebrovascular disease observable in the MRI scans. The weight loss experienced by these rabbits was caused by liver damage from the cholesterol in their diet. These rabbits were young, at a prime growth age for the species, and should have gained as much weight as they lost. The vascular changes also appear to have preceded measurable cortical atrophy changes. The elevated cholesterol in their diet could also have caused cerebral amyloid angiopathy in these animals (43). In this study, we did not use gradient-echo (44) or susceptibility-weighted imaging (45) that might have detected evidence of hemorrhages that are characteristic of cerebral amyloid angiopathy (CAA).
Previous cerebral vessel measurements in cholesterol-fed rabbits are scarce in the literature but two previous studies are consistent with the results obtained here. Given that the vessels supplying the brain, while less sensitive than the cardiac vessels, are also sensitive to serum cholesterol levels (46), studies were conducted on New Zealand White rabbits fed a 1% cholesterol diet for a period of 6 months (47). After 3 months, there was no evidence of fatty streaks in the carotid or basilar arteries, although the aortas were already significantly streaked (2.2 on a scale of 0–5). By 6 months, the carotid artery was rated at 3.1 as compared to the aorta rated 4.8 while the basilar artery remained unstreaked (47). Also in this study, the investigators discovered a loss of endothelium-derived relaxation factor–mediated vasorelaxation in the excised carotid and basilar arteries (47). These rabbits appeared not to suffer from liver disease, as there was no significant weight difference between control and cholesterol-fed animals after 6 months. In angiographic images of heads of SPF Japanese white rabbits (48) on a 1% cholesterol diet for 2 months, there was a reduction in the diameters of the maxillary, lingual, and facial arteries, but the basilar arteries and the arterial circle were not visible in the angiograms. Contrast-enhanced magnetic resonance angiography (CE-MRA) would have improved the signal-to-noise and contrast-to-noise ratios for vessel diameter measurements. However, in this study CE-MRA could not be performed as the contrast agent interaction with the blood and tissues could have affected the Aβ accumulation measurements that were a key focus of the work done on these animals.
Examination of cadaver cervical carotid arteries have demonstrated a tendency for arteriosclerotic plaques to accumulate in the common and internal carotid arteries just upstream of the bifurcation in the transitional zone between elastic and muscle artery (49). Two-thirds of the blood supply to the rabbit brain comes from the vertebral artery rather than the carotids (32) so a narrowing in the basilar artery that joins the two vertebral arteries could be considered consistent with the human data. Turbulent flow in the intradural vertebrals and the cavernous internal carotids might also cause accumulation in those vessels but no consistent decrease was measured in those arteries as lower flow SNR compromised those measurements. TOF-MRA, when carefully applied, has been demonstrated to provide data as accurate as that obtained from angiography (50). The data presented here met the criteria of more than three pixels for the vessel diameters (33,51) and sufficient signal-to-noise ratio of the flow signal except in the intradural vertebrals and cavernous internal carotid arteries.
Rather than narrowing caused by streaky fat accumulation in the rabbit arteries (50), the explanation for the arterial narrowing seen in this study is more likely that of vascular inflammation resulting in loss of vessel dilatory response and blood–brain barrier (BBB) breach caused by Aβ. This explanation is also consistent with the correlation over time between Aβ accumulation in the cholesterol-fed rabbits and the arterial narrowing in the parahippocampal arteries. Using an MRI iron-sensitive method for measuring Aβ in the cholesterol-fed rabbit (52), distinct signal voids occur throughout the brains of cholesterol-fed rabbits were found in far greater numbers than occur in control rabbit brains. These voids corresponded directly to histologically identified small extracellular clusters of Aβ-positive plaques that were iron-loaded.
Evidence for endothelial dysfunction has been reported as loss of vascular relaxation in hypercholesterolemic rabbits (53). An inflammatory response to Aβ has been seen in the cholesterol-fed rabbit model as demonstrated by immunohistochemical binding of MECA-32 indicative of vascular inflammation (42). Evans blue dye staining of the tissue from the hippo-campal cortex of cholesterol-fed rabbits in that study provides evidence for breach of the BBB associated with inflammation (42). As Aβ spreads throughout the brain, senile plaques and vascular Aβ deposits occur first in neocortical regions and expand into other brain regions. Vascular Aβ deposits may lead to capillary and vessel occlusion as observed in the mouse (54). Even brief periods of hypercholesterolemia can cause microvascular damage and inflammatory changes that occur as a result of intraluminal plaque accumulation (55).
The relevance of the animal Aβ data to human disease has been demonstrated. Intra-arterially infused solubilized rat and human Aβ (56) increased vascular resistance and reduced blow flow in rat cerebral cortex but not in rat heart or kidneys. More Aβ circulating in the blood causes loss of endothelium-dependent vasodilation (57). Exposure to Aβ of a transgenic mouse model of AD and isolated human cerebrovessels (58,59) resulted in endothelin-1 induced vasocon-striction. A possible model of the mechanism of this damage is the rabbit altered by cholinergic denervation of the nucleus basalis of Meynert (nbM) (60). The nbM controls cerebrovascular enervation. The nbM rabbit model incurs deposition of Aβ in cortex and cortical vessels similar to that seen in AD patients and hypercholesterolemic rabbits (60). Capillary and arteriole tree damage has been observed in human AD far beyond that of normal aging (61,62) causing vascular stenosis and local ischemia and hypoxia.
The rabbits studied here did not develop MRI-visible large or small vessel cerebrovascular disease although often these conditions are comorbid with AD in humans. Data from the Nun study suggest that there are clear associations between cognitive decline as measured by idea density in autobiographies and neurofillbrillary tangles. However, there were no consistent findings of any association between cognitive decline (measured by idea density) and moderate or severe large vessel arteriosclerosis at the base of the brain (63). In patients with AD only, without neurovascular disease, neurofibrillary tangles correlate with cognitive deficits while in patients with AD and vascular disease, the amount of Aβ plaques correlated with cognitive decline (6).
Neuronal atrophy of the hippocampal and medial temporal lobe seen on MRI scans is characteristic of Alzheimer's disease (28,29) but cholesterol-induced liver damage mortality prevents this animal from displaying later-stage AD-like pathological symptoms. In the cholesterol-fed rabbits used in this study, the vascular changes appear before any measurable changes in cortical atrophy. While the ventricular volume of the 12-week cholesterol-fed rabbits is slightly larger than the ventricular volume of the rabbits fed normal chow, the difference is not statistically significant. The ventricular volumes were measured as an index of global cortical atrophy because neural degeneration is detectable on MRI as global atrophy and atrophy of hippocampal and parahippocampal structures.
In conclusion, reduction in vessel diameters of medium-sized parahippocampal arteries, the posterior communicating arteries and the basilar artery, were correlated over time with hippocampal and temporal lobe accumulation of Aβ in these hypercholesterolemic NZW rabbits. No reduction in the feeding arteries, carotids or vertebrals, diameter size was observed. Solubilized Aβ may cause reduced vessel diameters from the increased cholesterol in the diet. Or it is possible (but no evidence from this study supports the idea) that Aβ may cause local leaks in the BBB. In the results from this study, arterial narrowing and cortical amyloid deposition occurred before MRI observable cortical atrophy.
ACKNOWLEDGMENT
This work was supported by the Center for Advanced Imaging in the Department of Radiology at West Virginia University. We thank L.B. Burhans, D.S. Darwish, and D. Wang for help with the rabbit scans. We also thank Mary Pettit for administrative and moral support.
Contract grant sponsor: NIH; Contract grant number: AG023211.
REFERENCES
- 1.Desmond DW, Tatemichi TK, Paik M, Stern Y. Risk factors for cerebrovascular disease as correlates of cognitive function in a stroke-free cohort. Arch Neurol. 1993;50:162–166. doi: 10.1001/archneur.1993.00540020040015. [DOI] [PubMed] [Google Scholar]
- 2.Jarvik GP, Wijsman EM, Kukull WA, Schellenberg GD, Yu C, Larson EB. Interactions of apolipoprotein E genotype, total cholesterol level, age, sex in prediction of Alzheimer's disease: A case-control study. Neurology. 1995;45:1092–1096. doi: 10.1212/wnl.45.6.1092. [DOI] [PubMed] [Google Scholar]
- 3.Mainous AG, III, Eschenbach SL, Wells BJ, Everett CJ, Gill JM. Cholesterol, transferrin saturation and the development of dementia and Azlheimer's disease: Results from an 18-year population-based cohort. Fam Med. 2005;37:36–42. [PubMed] [Google Scholar]
- 4.Sparks DL. Dietary cholesterol induces Alzheimer-like beta-amyloid immunoreactivity in rabbit brain. Nutr Metab Cardiovasc Dis. 1997;7:255–266. [Google Scholar]
- 5.Brenner SR. Neurovascular unit dysfunction: A vascular component of Alzheimer disease? Neurology. 2008;70:243–244. doi: 10.1212/01.wnl.0000299721.10189.fe. [DOI] [PubMed] [Google Scholar]
- 6.Esiri MM. Which vascular lesions are of importance in vascular dementia? Ann N Y Acad Sci. 2000;903:239–243. doi: 10.1111/j.1749-6632.2000.tb06373.x. [DOI] [PubMed] [Google Scholar]
- 7.Hooijmans CR, Rutters F, Dederen PJ, et al. Changes in cerebral blood volume and amyloid pathology in aged Alzheimer APP/PS1 mice on a docosahexaenoic acid (DHA) diet or cholesterol enriched Typical Western Diet (TWD) Neurobiol Dis. 2007;28:16–29. doi: 10.1016/j.nbd.2007.06.007. [DOI] [PubMed] [Google Scholar]
- 8.Zlokovic BV. New therapeutic targets in the neurovascular pathway in Alzheimer's disease. Neurotherapeutics. 2008;5:409–414. doi: 10.1016/j.nurt.2008.05.011. [DOI] [PMC free article] [PubMed] [Google Scholar]
- 9.Mandybur TI. The incidence of cerebral amyloid angiopathy in Alzheimer's disease. Neurology. 1975;25:120–126. doi: 10.1212/wnl.25.2.120. [DOI] [PubMed] [Google Scholar]
- 10.Chandra PR., V Gene-environment interaction in Alzheimer's disease: A potential role for cholesterol. Neuroepidemiology. 1998;17:225–232. doi: 10.1159/000026175. [DOI] [PubMed] [Google Scholar]
- 11.Dufouil C, Richard F, Fievet N, et al. ApoE genotype, cholesterol level, lipid-lowering treatment and dementia. The three-city study. Neurology. 2005;64:1531–1538. doi: 10.1212/01.WNL.0000160114.42643.31. [DOI] [PubMed] [Google Scholar]
- 12.Sparks D. Coronary artery disease, hypertension, ApoE, and cholesterol: A link to Alzheimer's disease? Ann N Y Acad Sci. 1997;826:128–146. doi: 10.1111/j.1749-6632.1997.tb48466.x. [DOI] [PubMed] [Google Scholar]
- 13.Sparks DL, Martin TA, Gross DR, Hunsaker JC., III Link between heart disease, cholesterol, and Alzheimer's disease: A review. Microsc Res Tech. 2000;50:287–290. doi: 10.1002/1097-0029(20000815)50:4<287::AID-JEMT7>3.0.CO;2-L. [DOI] [PubMed] [Google Scholar]
- 14.Kalmijn S, Launer LJ, Ott A, Witteman JC, Hofman A, Breteler MM. Dietary fat intake and the risk of incident dementia in the Rotterdam study. Ann Neurol. 1997;42:776–782. doi: 10.1002/ana.410420514. [DOI] [PubMed] [Google Scholar]
- 15.Kuo YM, Emmerling MR, Bisgaier CL, et al. Elevated low-density lipoprotein in Alzheimer's disease correlates with brain A-beta 1–42 levels. Biochem Biophys Res Communication. 1998;252:711–715. doi: 10.1006/bbrc.1998.9652. [DOI] [PubMed] [Google Scholar]
- 16.Weiner MF, Cullum CM, Rosenberg RN, Honig LS. Aging and Alzheimer's disease: Lessons from the Nun Study. Gerontologist. 1998;38:5–6. doi: 10.1093/geront/38.1.5. [DOI] [PubMed] [Google Scholar]
- 17.Popescu BO. Still debating a cause and diagnostic criteria for Alzheimer's disease. J Cell Mol Med. 2007;11:1225–1226. doi: 10.1111/j.1582-4934.2007.00149.x. [DOI] [PMC free article] [PubMed] [Google Scholar]
- 18.Purandare N, Burns A, Daly KJ, et al. Cerebral emboli as a potential cause of Alzheimer's disease and vascular dementia: Case-control study. BMJ. 2006;332:1119–1124. doi: 10.1136/bmj.38814.696493.AE. [DOI] [PMC free article] [PubMed] [Google Scholar]
- 19.Humpel C, Marksteiner J. Cerebrovascular damage as a cause for Alzheimer's disease. Curr Neurovasc Res. 2005;2:341–347. doi: 10.2174/156720205774322610. [DOI] [PubMed] [Google Scholar]
- 20.Verdile G, Fuller S, Atwood CS, Laws SM, Gandy SE, Martins RN. The role of beta amyloid in Alzheimer's disease: Still a cause of everything or the only one who got caught? Pharmacol Res. 2004;50:397–409. doi: 10.1016/j.phrs.2003.12.028. [DOI] [PubMed] [Google Scholar]
- 21.Anitschkow NN. Uber die veranderungen der kaninchenaorta bei experimenteller cholesterinsteatose. Beitr Pathol Anat. 1913;56:379–404. [Google Scholar]
- 22.Finking G, Hanke J. Nikolaj Nicolajewisch Anitschkow (1885–1964) established the cholesterol-fed rabbit as a model for atherosclerosis research. Atherosclerosis. 1997;135:1–7. doi: 10.1016/s0021-9150(97)00161-5. [DOI] [PubMed] [Google Scholar]
- 23.Jessup W, Kritharides L, Stocker R. Lipid peroxidation in athero-genesis: An overview. Biochem Soc Trans. 2004;32:134–138. doi: 10.1042/bst0320134. [DOI] [PubMed] [Google Scholar]
- 24.Sparks DL, Scheff SW, Hunsaker JC, III, Liu H, Landers T, Gross DR. Induction of Alzheimer-like beta-amyloid immunoreactivity in the brains of rabbits with dietary cholesterol. Exp Neurol. 1994;126:88–94. doi: 10.1006/exnr.1994.1044. [DOI] [PubMed] [Google Scholar]
- 25.Sjogren M, Mielke M, Gustafson D, Zandi P, Skoog I. Cholesterol and Alzheimer's disease - is there a relation? Mech Ageing Dev. 2006;127:138–147. doi: 10.1016/j.mad.2005.09.020. [DOI] [PubMed] [Google Scholar]
- 26.Woodruff-Pak DS, Agelan A, Del Valle L. A rabbit model of Alzheimer's disease: Valid at neuropathological, cognitive, and therapeutic levels. J Alzheimers Dis. 2007;11:371–383. doi: 10.3233/jad-2007-11313. [DOI] [PubMed] [Google Scholar]
- 27.Sparks DL, Schreurs BG. Trace amounts of copper in water induce beta-amyloid plaques and learning deficits in a rabbit model of Alzheimer's disease. Proc Natl Acad Sci U S A. 2003;100:11065–11069. doi: 10.1073/pnas.1832769100. [DOI] [PMC free article] [PubMed] [Google Scholar]
- 28.Jack CR, Jr, Shiung MM, Weigand SD, et al. Brain atrophy rates predict subsequent clinical conversion in normal elderly and amnestic MCI. Neurology. 2005;65:1227–1231. doi: 10.1212/01.wnl.0000180958.22678.91. [DOI] [PMC free article] [PubMed] [Google Scholar]
- 29.Jack CR, Jr, Petersen RC, O'Brien PC, Tangalos EG. MR-based hippocampal volumetry in the diagnosis of Alzheimer's disease. Neurology. 1992;42:183–188. doi: 10.1212/wnl.42.1.183. [DOI] [PubMed] [Google Scholar]
- 30.Schreurs BG, Smith-Bell CA, Darwish DS, Stankovic G, Sparks DL. Classical conditioning of the rabbit's nictitating membrane response is a function of the duration of dietary cholesterol. Nutr Neurosci. 2007;10:159–168. doi: 10.1080/10284150701565540. [DOI] [PMC free article] [PubMed] [Google Scholar]
- 31.Kapoor K, Kak VK, Singh B. Morphology and comparative anatomy of circulus arteriosus cerebri in mammals. Anat Histol Embryol. 2003;32:347–355. doi: 10.1111/j.1439-0264.2003.00492.x. [DOI] [PubMed] [Google Scholar]
- 32.Majewska-Michalska E. The vertebrobasilar arterial system in guinea pig as compared with dog and human. Folia Morphol (Warsz) 1998;57:121–131. [PubMed] [Google Scholar]
- 33.Hoogeveen RM, Bakker CJ, Viergever MA. Limits to the accuracy of vessel diameter measurement in MR angiography. J Magn Reson Imaging. 1998;8:1228–1235. doi: 10.1002/jmri.1880080608. [DOI] [PubMed] [Google Scholar]
- 34.Jiang ZJ, Richardson JS, Yu PH. The contribution of cerebral vascular semicarbazide-sensitive amine oxidase to cerebral amyloid angiopathy in Alzheimer's disease. Neuropathol Appl Neurobiol. 2008;34:194–204. doi: 10.1111/j.1365-2990.2007.00886.x. [DOI] [PubMed] [Google Scholar]
- 35.Vinters HV, Pardridge WM, Yang J. Immunohistochemical study of cerebral amyloid angiopathy: Use of an antiserum to a synthetic 28-amino-acid peptide fragment of the Alzheimer's disease amyloid precursor. Hum Pathol. 1988;19:214–222. doi: 10.1016/s0046-8177(88)80352-6. [DOI] [PubMed] [Google Scholar]
- 36.Urban I, Richard P. A stereotaxic atlas of the New Zealand rabbit's brain. Thomas; Springfield, IL: 1973. [Google Scholar]
- 37.Welker W, Johnson JI, Noe A. [Accessed 2007];Brain Atlas of the Domestic Rabbit. University of Wisconsin, Michigan State Comparative Mammalian Brain Collections, National Museum of Health and Medicine. Sponsored by National Science Foundation and National Institutes of Health. n.d. Available at: http://brainmuseum.org.
- 38.Jenkinson M, Bannister P, Brady M, Smith S. Improved optimisation for the robust and accurate linear registration and motion correction of brain images. Neuroimage. 2002;17:825–841. doi: 10.1016/s1053-8119(02)91132-8. [DOI] [PubMed] [Google Scholar]
- 39.Cox RW. AFNI: Software for analysis and visualization of functional magnetic resonance neuroimages. Comput Biomed Res. 1996;29:162–173. doi: 10.1006/cbmr.1996.0014. [DOI] [PubMed] [Google Scholar]
- 40.Staekenborg SS, van Straaten EC, van der Flier WM, Lane R, Barkhof F, Scheltens P. Small vessel versus large vessel vascular dementia: Risk factors and MRI findings. J Neurol. 2008;255:1644–1651. doi: 10.1007/s00415-008-0944-1. [DOI] [PubMed] [Google Scholar]
- 41.Majewska-Michalska E. Vascularization of the brain in guinea pig. I. Gross anatomy of the arteries and veins. Folia Morphol (Warsz) 1994;53:249–268. [PubMed] [Google Scholar]
- 42.Sparks DL, Kuo YM, Roher A, Martin T, Lukas RJ. Alterations of Alzheimer's disease in the cholesterol-fed rabbit, including vascular inflammation. Preliminary observations. Ann N Y Acad Sci. 2000;903:335–344. doi: 10.1111/j.1749-6632.2000.tb06384.x. [DOI] [PubMed] [Google Scholar]
- 43.Preston SD, Steart PV, Wilkinson A, Nicoll JA, Weller RO. Capillary and arterial cerebral amyloid angiopathy in Alzheimer's disease: Defining the perivascular route for the elimination of amyloid beta from the human brain. Neuropathol Appl Neurobiol. 2003;29:106–117. doi: 10.1046/j.1365-2990.2003.00424.x. [DOI] [PubMed] [Google Scholar]
- 44.Walker DA, Broderick DF, Kotsenas AL, Rubino FA. Routine use of gradient-echo MRI to screen for cerebral amyloid angiopathy in elderly patients. AJR Am J Roentgenol. 2004;182:1547–1550. doi: 10.2214/ajr.182.6.1821547. [DOI] [PubMed] [Google Scholar]
- 45.Haacke EM, DelProposto ZS, Chaturvedi S, et al. Imaging cerebral amyloid angiopathy with susceptibility-weighted imaging. AJNR Am J Neuroradiol. 2007;28:316–317. [PMC free article] [PubMed] [Google Scholar]
- 46.Kurozumi T, Tanaka K, Yae Y. Hypertension-induced cerebral atherosclerosis in the cholesterol-fed rabbit. Atherosclerosis. 1978;30:137–145. doi: 10.1016/0021-9150(78)90056-4. [DOI] [PubMed] [Google Scholar]
- 47.Kanamaru K, Waga S, Tochio H, Nagatani K. The effect of atherosclerosis on endothelium-dependent relaxation in the aorta and intracranial arteries of rabbits. J Neurosurg. 1989;70:793–798. doi: 10.3171/jns.1989.70.5.0793. [DOI] [PubMed] [Google Scholar]
- 48.Nakayama S, Sakashita M, Tonooka M, Gotoh H, Yasuhara H, Sakamoto K. Experimental hyperlipidemia and atherosclerosis induced by cholesterol diet in SPF Japanese white rabbits. Jpn J Pharmacol. 1983;33:279–289. doi: 10.1254/jjp.33.279. [DOI] [PubMed] [Google Scholar]
- 49.Hori E, Hayashi N, Hamada H, et al. A development of atheromatous plaque is restricted by characteristic arterial wall structure at the carotid bifurcation. Surg Neurol. 2008;69:586–590. doi: 10.1016/j.surneu.2007.05.033. discussion 590–581. [DOI] [PubMed] [Google Scholar]
- 50.Ford JC, Shlansky-Goldberg RD, Golden M. MR microscopy of the arterial wall in an experimental model of atherosclerosis: Preliminary results. J Vasc Interv Radiol. 1997;8(Pt 1):93–99. doi: 10.1016/s1051-0443(97)70522-0. [DOI] [PubMed] [Google Scholar]
- 51.Jiang J, Haacke EM, Dong M. Dependence of vessel area accuracy and precision as a function of MR imaging parameters and boundary detection algorithm. J Magn Reson Imaging. 2007;25:1226–1234. doi: 10.1002/jmri.20918. [DOI] [PubMed] [Google Scholar]
- 52.Ronald JA, Chen Y, Bernas L, et al. Clinical field-strength MRI of amyloid plaques induced by low-level cholesterol feeding in rabbits. Brain. 2009;132(Pt 5):1346–1354. doi: 10.1093/brain/awp031. [DOI] [PMC free article] [PubMed] [Google Scholar]
- 53.Moroe H, Honda H. Comparison of endothelial function in the carotid artery between normal and short-term hypercholesterolemic rabbits. Comp Biochem Physiol C Toxicol Pharmacol. 2006;144:197–203. doi: 10.1016/j.cbpc.2006.08.011. [DOI] [PubMed] [Google Scholar]
- 54.Thal DR, Griffin WS, de Vos RA, Ghebremedhin E. Cerebral amyloid angiopathy and its relationship to Alzheimer's disease. Acta Neuropathol. 2008;115:599–609. doi: 10.1007/s00401-008-0366-2. [DOI] [PubMed] [Google Scholar]
- 55.Stokes KY, Cooper D, Tailor A, Granger DN. Hypercholesterolemia promotes inflammation and microvascular dysfunction: Role of nitric oxide and superoxide. Free Radic Biol Med. 2002;33:1026–1036. doi: 10.1016/s0891-5849(02)01015-8. [DOI] [PubMed] [Google Scholar]
- 56.Suo Z, Su G, Placzek A, et al. A beta vasoactivity in vivo. Ann N Y Acad Sci. 2000;903:156–163. doi: 10.1111/j.1749-6632.2000.tb06363.x. [DOI] [PubMed] [Google Scholar]
- 57.Price JM, Chi X, Hellermann G, Sutton ET. Physiological levels of beta-amyloid induce cerebral vessel dysfunction and reduce endothelial nitric oxide production. Neurol Res. 2001;23:506–512. doi: 10.1179/016164101101198758. [DOI] [PubMed] [Google Scholar]
- 58.Paris D, Humphrey J, Quadros A, et al. Vasoactive effects of A beta in isolated human cerebrovessels and in a transgenic mouse model of Alzheimer's disease: Role of inflammation. Neurol Res. 2003;25:642–651. doi: 10.1179/016164103101201940. [DOI] [PubMed] [Google Scholar]
- 59.Townsend KP, Obregon D, Quadros A, et al. Proinflammatory and vasoactive effects of Abeta in the cerebrovasculature. Ann N Y Acad Sci. 2002;977:65–76. doi: 10.1111/j.1749-6632.2002.tb04799.x. [DOI] [PubMed] [Google Scholar]
- 60.Roher AE, Kuo YM, Potter PE, et al. Cortical cholinergic denervation elicits vascular A beta deposition. Ann N Y Acad Sci. 2000;903:366–373. doi: 10.1111/j.1749-6632.2000.tb06388.x. [DOI] [PubMed] [Google Scholar]
- 61.Vinters HV, Secor DL, Read SL, et al. Microvasculature in brain biopsy specimens from patients with Alzheimer's disease: An immunohistochemical and ultrastructural study. Ultrastruct Pathol. 1994;18:333–348. doi: 10.3109/01913129409023202. [DOI] [PubMed] [Google Scholar]
- 62.Miyakawa T, Kuramoto R. Ultrastructural study of senile plaques and microvessels in the brain with Alzheimer's disease and Down's syndrome. Ann Med. 1989;21:99–102. doi: 10.3109/07853898909149193. [DOI] [PubMed] [Google Scholar]
- 63.Snowdon DA, Greiner LH, Markesbery WR. Linguistic ability in early life and the neuropathology of Alzheimer's disease and cerebrovascular disease. Findings from the Nun Study. Ann N Y Acad Sci. 2000;903:34–38. doi: 10.1111/j.1749-6632.2000.tb06347.x. [DOI] [PubMed] [Google Scholar]