Abstract
Preparation of heme model complexes is a challenging subject of long-standing interest for inorganic chemists. His93Gly sperm whale myoglobin (H93G Mb) has the proximal His replaced with the much smaller non-coordinating Gly. This leaves a cavity on the proximal side of the heme into which a wide variety of exogenous ligands can be delivered. The end result is a remarkably versatile scaffold for the preparation of model heme adducts to mimic the heme iron coordination structure of native heme proteins. In this review, we first summarize the quantitative evidence for differential ligand binding affinities of the proximal and distal pockets of the H93G Mb cavity mutant that facilitates the preparation of mixed-ligand derivatives. Then we review our use of magnetic circular dichroism and electronic absorption spectroscopy to characterize nitrogen-, oxygen-, and sulfur-donor-ligated H93G Mb adducts with an emphasis on species not easily prepared by other heme model system approaches and those that serve as spectroscopic models for native heme proteins.
Keywords: H93G Mb, cavity mutant, MCD spectroscopy, heme protein active site models
1. Introduction
Investigations of the coordination structures of heme protein active sites provide key information that contributes to our understanding of the mechanism of action of native heme-containing enzymes. In particular, the iron oxidation and spin state, the amino acids coordinated to the heme iron and the nature of the surrounding protein environment have long been recognized to play essential roles in both the structure and biological function of heme-containing proteins [1-5].
To mimic the structural properties of heme proteins, numerous synthetic heme iron model complexes have been prepared in organic solvents and investigated over the past four decades. Although this approach has achieved considerable success, there are still limitations in scope particularly in generating complexes coordinated by only a single exogenous ligand as well as in preparing stable six-coordinate model heme iron mixed-ligand adducts (i.e. with two different axial ligands). To address these problems, organic chemists have prepared even more sophisticated synthetic porphyrins including ones with tethered ligands [6-9]. These approaches have required considerably elaborate efforts to synthesize each specific model heme complex.
Another approach to the preparation of heme iron model complexes for their structural and functional studies has been through the use of cytochrome c derivatives known as microperoxidases (MPs) that have been derived by proteolytic digestion of native cytochrome c. Owing to the covalent linkage that connects the c heme to the peptide backbone, these monomeric water-soluble heme-bound peptides have also been successfully used for the purpose of generating heme derivatives as models for His-ligated heme protein active sites [10]. MPs have a His proximal axial ligand with a distal site occupied by water and therefore available for binding of exogenous ligands [10]. Only at very low pH (pH ≤ 3) does first carboxylate (Glu) (apparent pKa = ∼ 3) and then water (apparent pKa = ∼ 2) replace the His in MPs so that the heme iron is carboxylate/water or bis-water ligated, respectively, as the pH is lowered [10, 11]. In addition to the limited exchangeability of the proximal His ligand, Mps are not totally free from aggregation problems in water and no crystal structures of free microperoxidase have yet been reported [10].
A third way to model specific heme active site has been to replace the native axial ligand coordinated to the heme iron by another amino acid using site-directed mutagenesis. By doing so, quite a number of mutants have been successfully generated, i.e. His93Cys (H93C) myoglobin as a model for cytochrome P450 [12] and His93Tyr (H93Y) myoglobin to mimic the properties of heme containing catalases [12, 13]. However, this method is subject to the restricted number of natural ligands available within the genetic code as well as the steric constraints that preclude proper folding of some mutants. Methodology has recently been developed to incorporate unnatural amino acids into proteins and provides new opportunities for chemoselective modification of proteins [14-18]. Nevertheless, the scope of such manipulations is restricted due to the limited size of peptides and/or the types of amino acids to be modified, the low protein expression yield, and the high cost [18].
The sperm whale myoglobin proximal ligand cavity mutant, His93Gly (H93G) Mb, pioneered by Barrick [19], provides a novel scaffold that has proven highly useful for the preparation of heme model complexes [19-30]. His93, the natural heme iron proximal axial ligand, has been replaced by site-directed mutagenesis technique with a smaller non-coordinating amino acid, glycine (Gly). This mutation creates a cavity that can be filled with various ligands to generate heme iron species that mimic the active site coordination structure of native heme proteins. The exogenously added ligands bind to the central heme iron to form adducts that are well behaved and can be characterized in favorable cases by x-ray crystallography [19, 24]. The result is a versatile and flexible system that can be employed to prepare an extremely wide variety of heme iron derivatives.
Our laboratory has extensively studied the use of H93G Mb for the preparation of model heme complexes of defined structure [20-29], such as H93G Mb imidazole, alkylthiolate and carboxylate adducts as mimics of native myoglobin [21], cytochrome P450 [20] and oxyanion-bound heme proteins [24], respectively. Moreover, we have shown that it is possible to prepare stable mixed-ligand ferric as well as ferrous complexes with H93G Mb cavity mutant due to the difference in ligand accessibility of the proximal and distal sides of the heme [20, 21, 25, 28]. Relatively stable oxyferrous and ferryl [Fe(IV)=O] H93G Mb adducts have also been generated since the heme center is well protected by the surrounding protein environment [21, 26, 28].
Here we summarize the research progress for the properties of the H93G cavity mutant Mb as a versatile scaffold for preparing heme iron model complexes. Adducts of the H93G Mb cavity mutant ligated with numerous nitrogen-, oxygen- and/or sulfur-donor ligands in ferrous, ferric and ferryl heme iron states have been prepared and characterized with UV-visible (UV-Vis) absorption and magnetic circular dichroism (MCD) spectroscopy. MCD spectroscopy has proven to be invaluable for elucidating the coordination modes of iron-binding centers of heme-containing proteins, that is, to identify the ligand (number and type), to investigate the spin state, and to determine the oxidation state (ferrous, ferric and ferryl) of the heme center [31, 32].
MCD and natural circular dichroism (CD) spectroscopy both measure the differential absorption of left and right circularly polarized (l.c.p. and r.c.p.) light by chromophores [31-36]. However, CD spectra are only observed in optically active species, which are light-absorbing molecules (chromophores) that are either structurally dissymmetric or in an asymmetric environment. When a magnetic field is applied parallel to the direction of the light beam, optical rotation is induced (the Faraday effect) [32, 33]. All chromophores exhibit magnetic optical activity. There are three types of bands resulting from different electronic transitions associated with the MCD spectrum. These separate components are called “A”, “B” and “C” terms. “A” terms, which are temperature-independent and have a derivative shape of an ordinary absorption band, arise from the lifting of excited state degeneracies induced by the magnetic field (Zeeman splitting). The Gaussian-shaped “B” terms result from magnetic-field induced nondegenerate ground- and excited-state mixing and like “A” terms they are temperature independent. The Gaussian-shaped, temperature-dependent “C” terms appear when the ground state is degenerate and undergoes Zeeman splitting [37, 38]. Because MCD spectra can be either positive or negative, the spectra provide greater fingerprinting capacity in comparison to traditional UV-Vis spectra which only have positive sign features. Furthermore, MCD is highly sensitive to the heme coordination structure and relatively insensitive to environmental factors beyond the coordinating ligands. Spectroscopic measurements can be carried out with dilute samples (in micromolar to millimolar concentrations) in a wide range of temperatures. Even the active site of diamagnetic and paramagnetic species can be analyzed by MCD spectroscopy [39, 40].
2. Ferric exogenous ligand-free H93G myoglobin as a function of pH
The H93G cavity mutant Mb without any exogenous ligand is relatively unstable. However, in the presence of imidazole (Im), the H93G(Im) Mb complex is as stable as wild-type (WT) Mb [19]. Both its expression in E. coli and the following purification procedures are conducted in buffer containing 10 mM Im [19]. Essentially homogenous ferric exogenous ligand-free H93G Mb can be obtained by first extracting the heme and then carrying out the standard heme reconstitution procedure [21, 23]. Since exogenous ligand-free H93G Mb is the starting point for all subsequent studies, its heme axial coordination structure was an early object of investigation. It was observed that at low pH (pH = 5), the MCD spectrum of ferric exogenous ligand-free H93G Mb is very similar to that of the acidic (pH 3.1) ferric horseradish peroxidase, leading to assignment as a high-spin five-coordinate structure with a single water ligand [23]. Reconstituted exogenous ligand-free H93G Mb is not very stable at pH < 5.0 and the intensity of the Soret absorption peak gradually decreases at low pH.
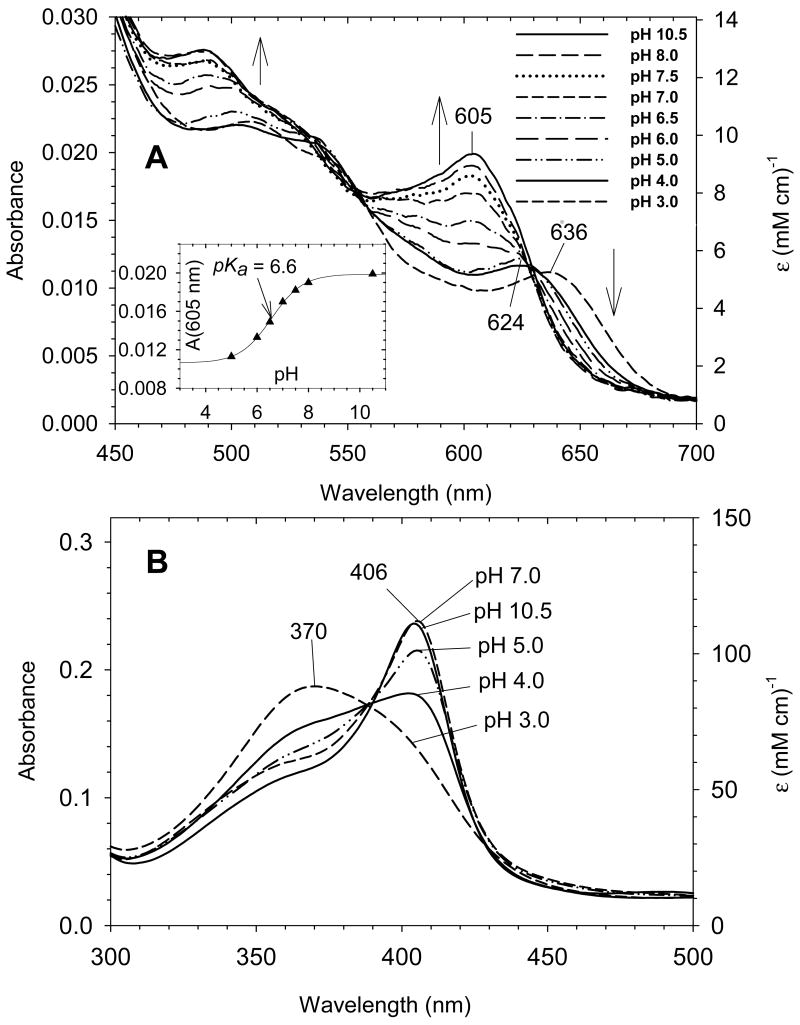
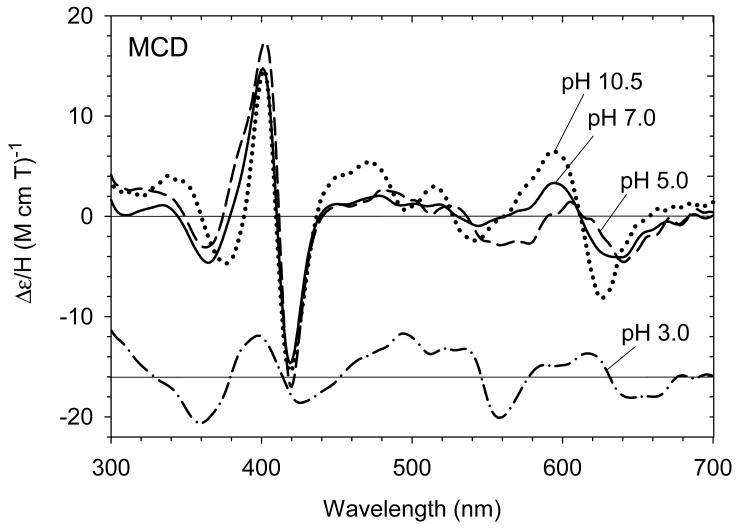
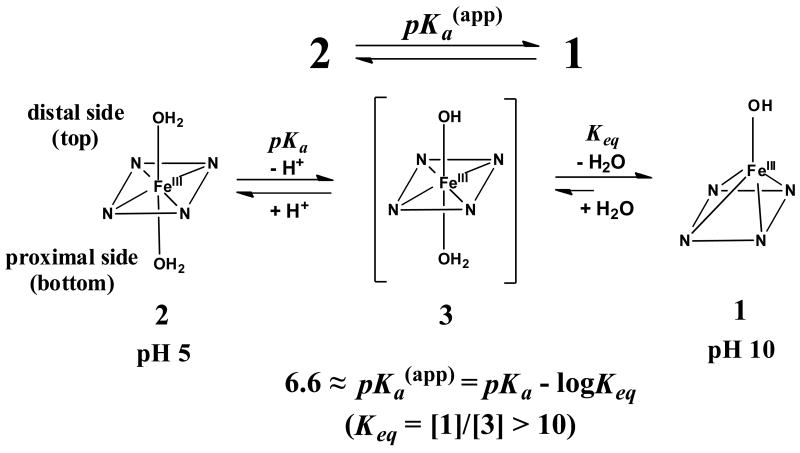
A more detailed set of experiments has recently been conducted to more carefully examine the coordination structure for ferric exogenous ligand-free H93G Mb over the pH range between 3.0 and 10.5. Using freshly prepared reconstituted exogenous ligand-free ferric H93G Mb samples that had never been frozen and thawed, we have shown that single water-ligated (five-coordinate) ferric H93G Mb was not fully formed at pH 5 at 4 °C and the species started to appear only below pH 5 [29]. The UV-Vis absorption spectra over the pH range between 5.0 and 10.5 featured isosbestic points (Fig. 1A); another species that has a spectrum that is characteristic of mono-water-ligated ferric heme completely formed at pH 3.0 (Fig. 1, A and B). However, a significant protein conformational change at the heme-binding site may have occurred at pH < 5 [24]. The MCD spectra of exogenous ligand-free H93G Mb at pH 3.0, 5.0, 7.0 and 10.5 for freshly prepared and never frozen protein samples are displayed in Fig. 2. The MCD spectrum of alkaline ferric H93G Mb has the most intense derivative-shaped band in the visible region centered at 605 nm, a feature that is typical for five-coordinate anionic oxygen donor (RO-)-ligated high-spin ferric heme centers [23]. Thus, at pH 10.5, the ferric exogenous ligand-free MCD spectrum closely mimics those of ferric H93Y Mb, which is a five-coordinate high-spin heme iron ligated by a tyrosinate anion [41, 42], as well as a five-coordinate methoxide-bound complex [23]. We concluded that at pH 10.5, ferric exogenous ligand-free H93G Mb has a single hydroxide ligand (1). This structure was confirmed by resonance Raman spectroscopy as well [43].
Fig. 1.
Visible (A) and Soret (B) region electronic absorption spectra of exogenous ligand-free ferric H93G Mb in 0.1 M potassium phosphate buffer at different pH values from 3.0 to 10.5 at 4 °C. Vertical arrows indicate the directions of absorbance change with increasing pH. Only selected spectra are shown in the Soret region above pH 5.0. Inset in A: Absorbance at 605 nm (charge transfer band) as a function of pH from 5.0 to10.5. Sigmoid plot fit yields pKa = 6.6. Reproduced from reference [29] with permission of the copyright holders.
Fig. 2.
MCD spectra of exogenous ligand-free ferric H93G Mb at pH 3.0 (dot-dashed line), pH 5.0 (dashed line), pH 7.0 (solid line) and pH 10.5 (dotted line) recorded using freshly prepared and never frozen protein samples. The spectrum at pH 3.0, which is plotted with the same scale as the others, is offset downward for clarity. All spectra were measured in 0.1 M potassium phosphate buffer at 4 °C. The spectra are very similar to those reported in [23] at pH values 5.0, 7.0 and 10.5, respectively. Reproduced from reference [29] with permission of the copyright holders.
Although we previously speculated that the proximal pocket was the likely binding site for hydroxide anion [43], we now consider the more polar distal site to be the reasonable site based on the following reasons. The distal His in ferric H93G Mb might stabilize the heme iron-ligated hydroxide via hydrogen bonding as known for wild-type ferric Mb (Chapter 4 (p. 78) in [44]). Furthermore, binding of relatively large size ligands (such as imidazole [19], acetate [24] and beta-mercaptoethanol [24]) to the proximal site of the heme would be more easily facilitated when the proximal site is vacant (1 in Scheme 1) as their crystal structures support.
Scheme 1.
The UV-Vis absorption and MCD spectra of ferric exogenous ligand-free H93G Mb at pH 5.0 differs from that of a five-coordinate water-ligated ferric center seen at pH 3.0 (Fig. 1, A and B and Fig. 2). It therefore appears that the pH-dependent coordination structural change of ferric H93G Mb differs from that of water-soluble free heme systems, for which direct inter-conversion between the mono-hydroxide and mono-water-ligated five-coordinate high-spin species was shown to occurs with pKa values ranging from 4.8 - 6.4 [45]. Thus, it is reasonable to consider that ferric H93G Mb at pH 5.0 contains a six-coordinate heme either with bis-water or water/hydroxide as axial ligands (vide infra) [29]. To distinguish between these two coordination structures, the following studies have been carried out.
The UV-Vis spectral change over the pH range between 5.0 and 10.5 with isosbestic points at ∼628 nm and ∼555 nm (Fig. 1A) is consistent with inter-conversion of two discrete species, the alkaline and acid forms of which are the five-coordinate hydroxide-bound derivative (pH 10.5) (1) and a six-coordinate heme complex (pH 5.0). The visible region spectral characteristic of the latter species observed at pH 5 (dot-dot-dash line in Fig. 1A) is clearly high-spin judging from the presence of charge-transfer bands at ∼500 and 624 nm and the absence of dominant peaks between these two bands. Even though this does not distinguish between bis-water- (H2O-Fe(III)-OH2) (2) or water/hydroxide-bound (H2O-Fe(III)-OH) six-coordinate complexes (3), the apparent pKa value (6.6) for deprotonation of the species at pH 5.0 is relatively low and is more consistent with direct deprotonation of a heme iron-ligated water with a trans neutral ligand (water) than with a trans anionic ligand (hydroxide) [29]. The presence of a six-coordinate bis-water-ligated heme structure was found in ferric His175Gly CCP cavity mutant in its crystalline state [46, 47]. Furthermore, it has been observed that ferric H93G Mb will not simultaneously bind two anionic ligands [20]. Based on these results and interpretations, we have proposed the equilibria between these three exogenous ligand-free ferric H93G Mb species as shown in Scheme 1 [29]. Complex 2 will not convert to 1 in one step, thus we propose another species, a six-coordinate water/hydroxide-ligated complex (3) formed upon deprotonation of 2, as an intermediate. Apparently species 3 is in a pH-independent equilibrium with 1 that must be considerably shifted towards 1 (with a constant, Keq = [1]/[3] > 10). Based on the apparent pKa value of ∼6.6, it is concluded that the spectra of ferric H93G Mb at pH 7.0 (Figs. 1 and 2) is a mixture of the alkaline five-coordinate hydroxide (∼71%) and six-coordinate bis-aqua (∼29%) adducts.
3. Nitrogen-donor-ligated H93G myoglobin adducts
3.1. Imidazole adducts of H93G myoglobin: models for His-ligated heme protein
The crystal structure of Im-bound ferric H93G Mb, with Im in the proximal cavity has been reported by Barrick and co-workers and mimics that of the ferric WT Mb (Fig. 3) [19, 48, 49]. Both of their protein folds (Fig. 3A) and active site structures are essentially identical (Fig. 3B). We have published a thorough spectroscopic study of H93G(Im) Mb complexes in the ferrous, ferric and ferryl states [21, 22, 25, 27]. Of particular note, mixed-ligand ferric adducts with Im and thiolate (ethanethiolate) [20] and with Im and either cyanide or azide [21] as axial ligands were reported. In addition, deoxyferrous H93G Mb with CO, NO or O2 trans to Im ligation have been investigated [21]. The UV-Vis and MCD spectra of the resulting H93G(Im) Mb complexes closely match those of the parallel WT Mb in every case [44, 50, 51]. The overall MCD spectral intensity in the cavity mutant system is somewhat weaker than that of the WT Mb probably due to the subtle differences in imidazole ring orientations. Clearly, as we have previously reviewed [22, 27], the H93G Mb cavity mutant is an excellent template for modeling native Mb in its various coordination states.
Fig. 3.
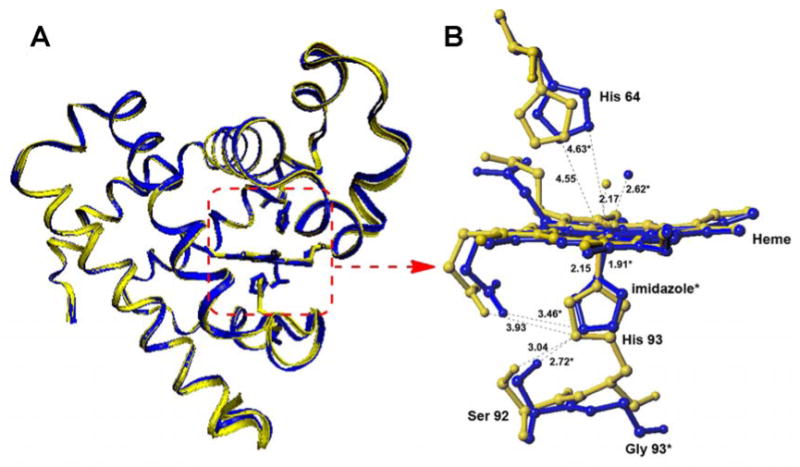
(A) Superposition of the structures of WT Mb (yellow) and imidazole (Im)-ligated H93G Mb (blue) and (B) a schematic representation of the enlarged active site of WT Mb (yellow) and that of the H93G(Im) Mb (*blue) as determined from X-ray crystallography. Note that the enlatrged active sites in B are viewed from a different perspective from those in the proteins in A. The structures are drawn using PDB files 1VXH for WT Mb and 1IRC for H93G Mb [19, 49]. Dashed lines indicate the hydrogen bonding interactions.
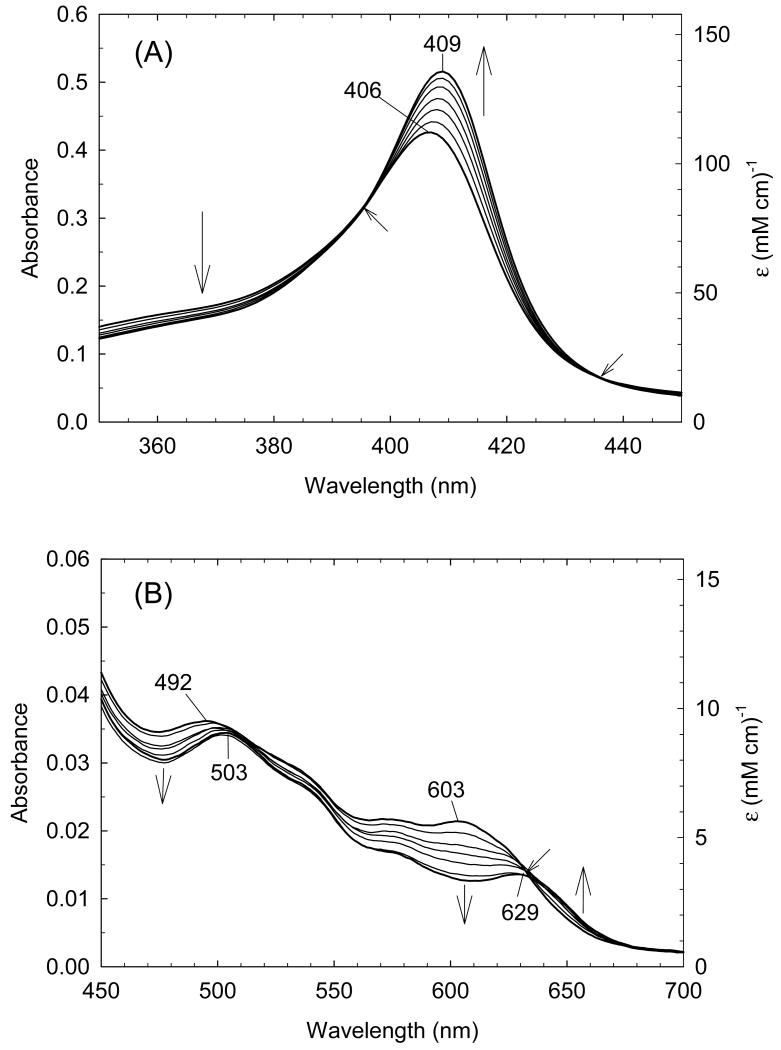
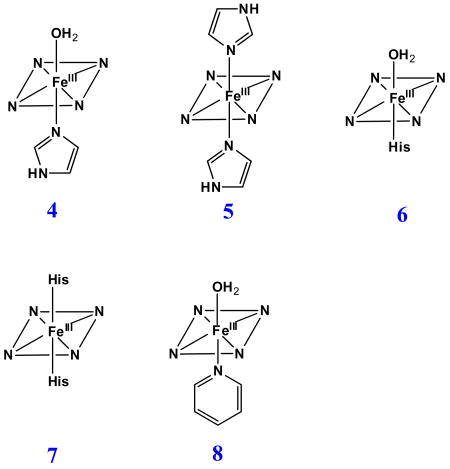
In order to quantify the differential binding affinities of the proximal and distal cavities of ferric H93G Mb, a more detailed Im binding study has recently been conducted [25]. Addition of Im to reconstituted exogenous ligand-free ferric H93G Mb leads significant spectral changes in both Soret and visible regions with two clear sets of multiple isosbestic points depending on the different range of Im concentration (Figs. 4 and 5). Three optically distinct heme ligation states are present in sequence throughout the Im binding reaction: exogenous ligand-free, mono-Im (4) and bis-Im (5) ferric H93G Mb. The UV-Vis spectrum at the end of the first ligand binding phase (mono-Im formation) resembles that of the ferric WT Mb (6) [21]. This is a six-coordinate high-spin H93G Mb derivative with Im as a proximal ligand and water as a distal site ligand at neutral pH, a heme iron coordination model (6) that cannot be easily prepared with simple synthetic heme iron model systems in organic solvents. The crystal structure of Im-bound ferric H93G Mb, with Im in the proximal pocket, has confirmed the structural similarity of this derivative to that of the ferric WT Mb (Fig. 3). The second phase reaction starts with millimolar addition of Im to ferric H93G(Im) (Fig. 5), leading to the formation of a six-coordinate low-spin complex (5) with UV-Vis and MCD spectral characteristics that resemble those of cytochrome b5, a bis-His coordinated structure (7) [25]. Addition of pyridine (Py) in the exogenous ligand-free ferric H93G also causes similar spectral changes, indicative of the formation of a six-coordinate pyridine/water complex (8). However, in trying to generate a bis-pyridine protein-bound adduct using higher concentrations of pyridine, the heme is released from the protein fold to generate a protein-free ferric bis-pyridine complex [25].
Fig. 4.
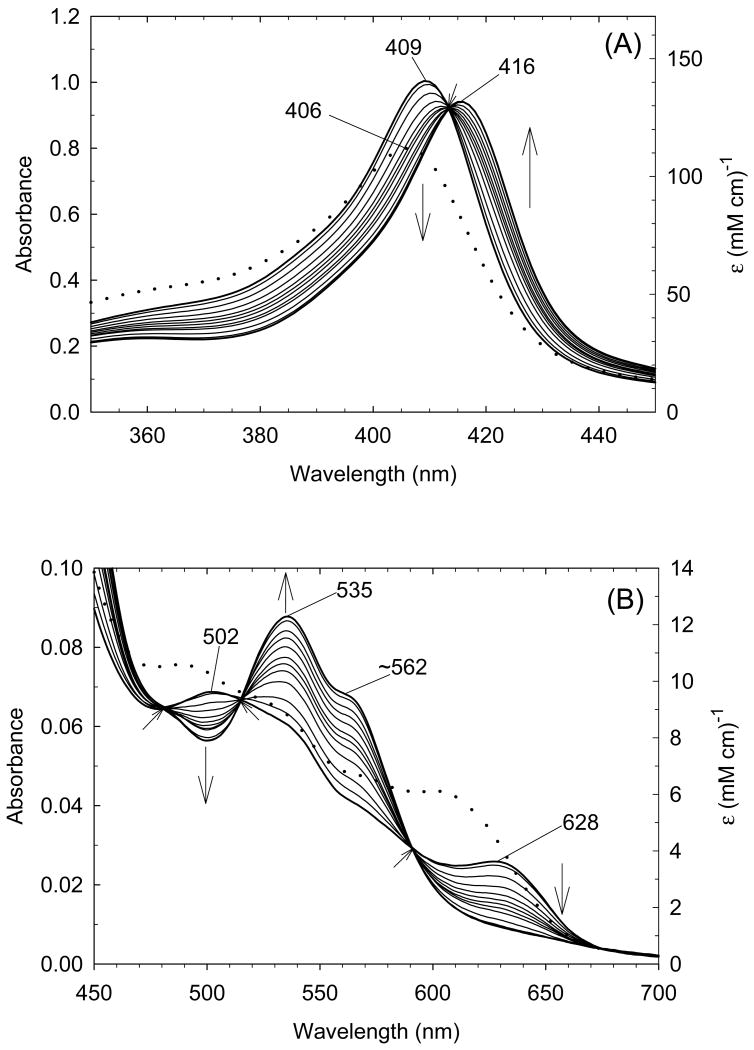
(A) Soret region and (B) visible region absorption spectral changes upon titration of exogenous ligand-free ferric H93G Mb with low concentration (<100 μM) of imidazole (Im) in 0.1 M potassium phosphate buffer, pH 7.0, at 4 °C. Vertical arrows indicate the direction of absorbance change; diagonal arrows indicate isosbestic points. Reproduced from reference [25] with permission of the copyright holders.
Fig. 5.
(A) Soret region and (B) visible region absorption spectral changes upon titration of exogenous ligand-free ferric H93G Mb (dotted line) with high concentration (>0.5 mM) of imidazole (Im) in 0.1 M potassium phosphate buffer, pH 7.0, at 4 °C. Vertical arrows indicate the direction of absorbance change; diagonal arrows indicate isosbestic points. The dotted lines are the spectrum of exogenous ligand-free ferric H93G Mb. Reproduced from reference [25] with permission of the copyright holders.
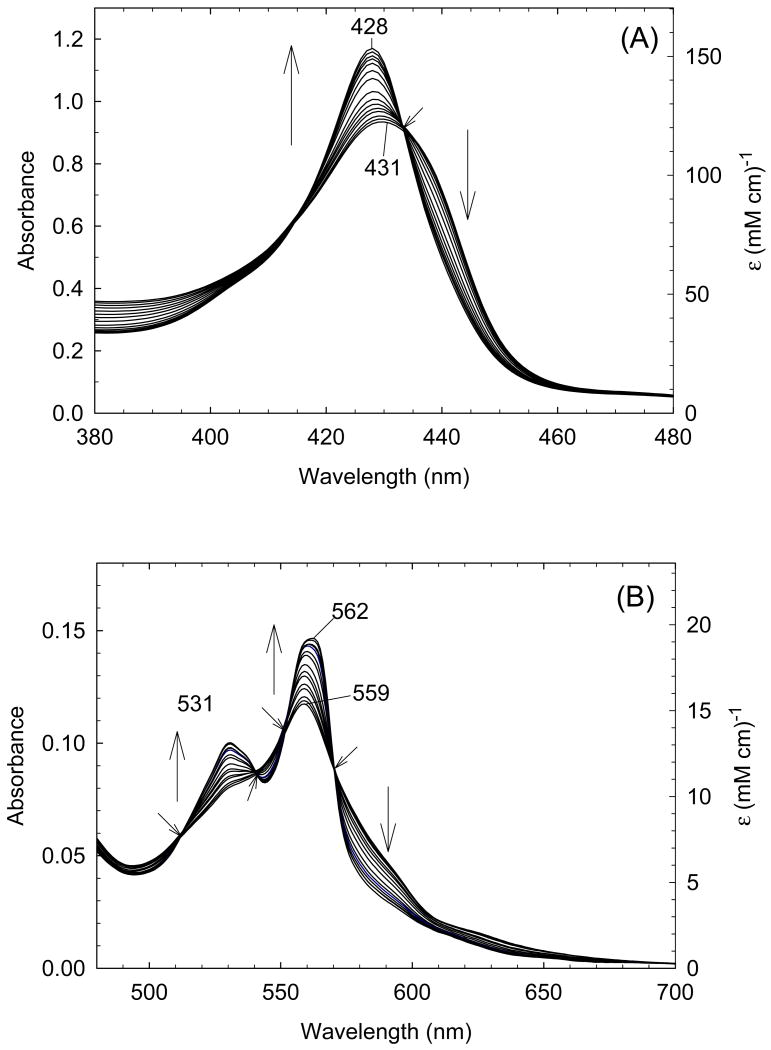
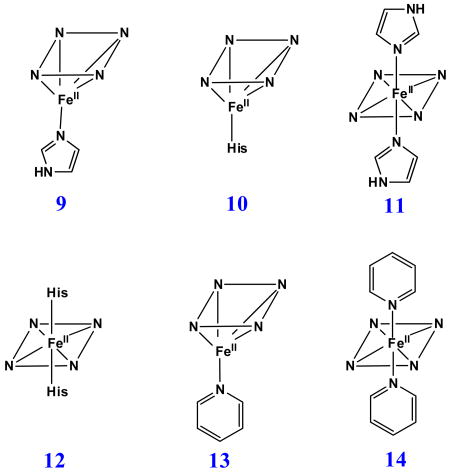
Like the case of ferric H93G Mb, the titration data for Im binding to dithionite-reduced deoxyferrous H93G Mb also produces changes in the UV-Vis spectrum with two sets of multiple isosbestic points (Figs. 6 and 7), suggesting that Im binding is also a two-phase process. At low Im concentrations, a mono-Im adduct (9) is formed that spectrally resembles deoxyferrous Mb (10) (Fig. 6). As the Im concentration is raised further, a bis-Im derivative (11) is formed that spectroscopically resembles ferrous cytochrome b5 (12) (Fig. 7). The data indicate that throughout the titration process, three different heme coordination structures are present sequentially: exogenous ligand-free, mono-Im (9) and bis-Im (11) deoxyferrous H93G Mb. Similar results were obtained by titrating ferrous H93G Mb with pyridine (Py) to prepare mono-Py (13) and bis-Py (14) complexes [25].
Fig. 6.
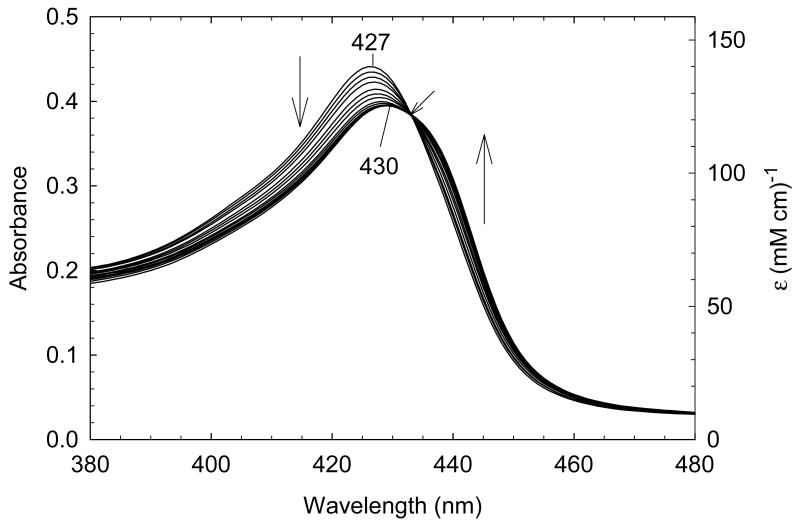
Soret region absorption spectral changes upon titration of exogenous ligand-free ferrous H93G Mb with low concentration (<150 μM) of imidazole (Im) in 0.1 M potassium phosphate buffer, pH 7.0, at 4 °C. Vertical arrows indicate the direction of absorbance change; the diagonal arrow indicates the isosbestic point. Reproduced from reference [25] with permission of the copyright holders.
Fig. 7.
(A) Soret region and (B) visible region absorption spectral changes upon titration of exogenous ligand-free ferrous H93G Mb with high concentration (>30 mM) of imidazole (Im) in 0.1 M potassium phosphate buffer, pH 7.0, at 4 °C. Vertical arrows indicate the direction of absorbance change; diagonal arrows indicate isosbestic points. Reproduced from reference [25] with permission of the copyright holders.
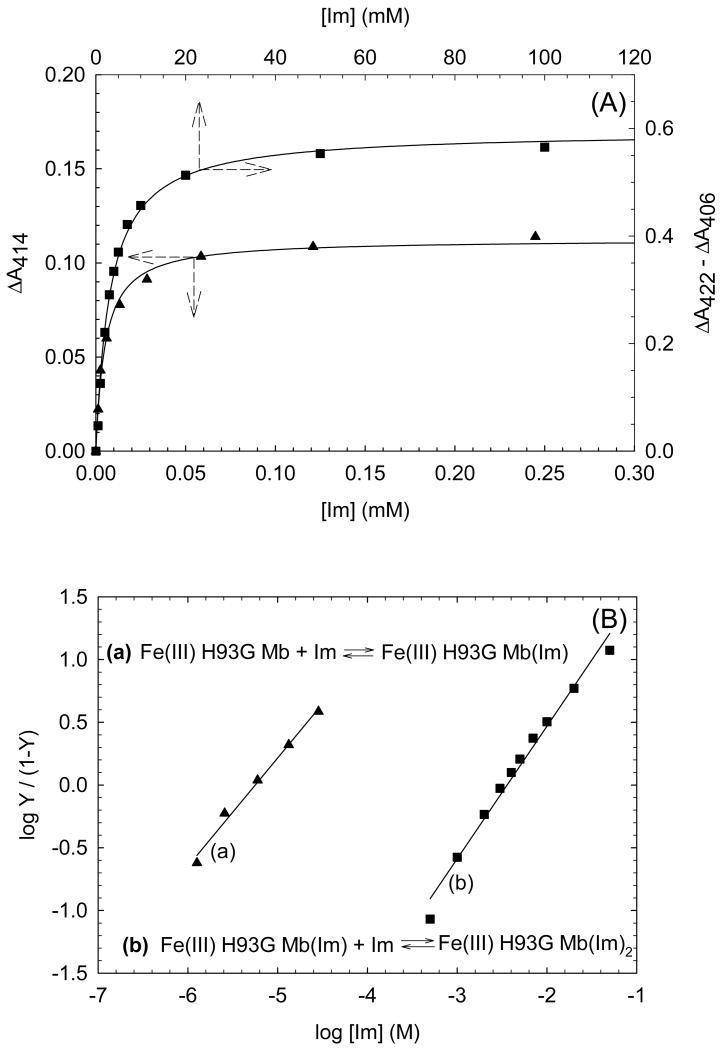
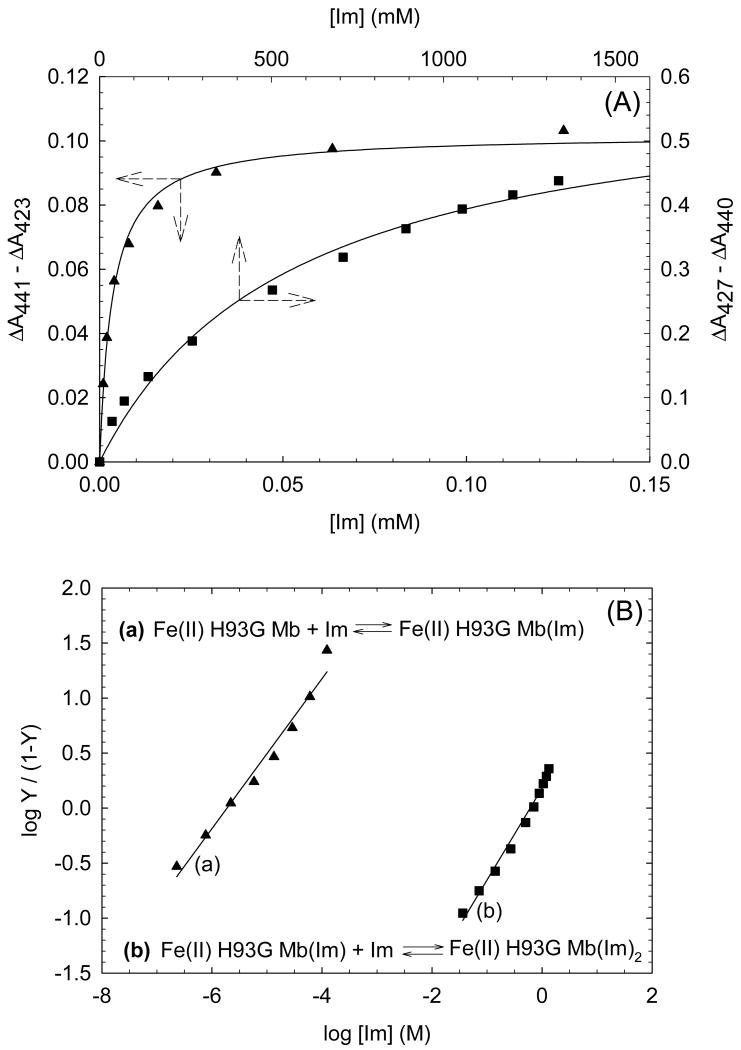
Based on the isosbestic points observed in the Im titration data in both the ferric or deoxyferrous states, simple bimolecular association schemes (equations in Fig. 8 and Fig. 9) are used to describe the binding reaction of Im to exogenous ligand-free H93G Mb and to H93G(Im) Mb. The dissociation constants (Kd) were determined by hyperbolic saturation plots as well as Hill plots (Fig. 8, 9). In the ferric case, there is 600-fold difference between the dissociation constants (Kd) for the two phases (Kd1 = 6 μM, Kd2 = 3.6 mM); while for the deoxyferrous state, the Im binding affinity of the proximal pocket is 3 × 10⁵ times higher than that of the distal site (Kd1 = 2 μM, Kd2 = 610 mM) (Table 1). These results clearly demonstrate that the two sides of the heme in both ferric and ferrous H93G Mb behave differently when incorporating exogenous ligands, i.e. the proximal pocket has a much stronger binding affinity than the distal side. In contrast, Roach et al. prepared the H64D/H93G Mb double mutant in which the distal His is replaced with aspartate and found that only a bis-Im complex formed; no mono-Im intermediate was detected [52]. Clearly, the steric hindrance caused by the distal histidine was reduced in the double mutant so that the binding affinities to the proximal and distal pockets was comparable, leading to only the bis-Im adduct. The crystal structure of ferric WT sperm whale Mb(Im) complex reported previously confirmed that there is a repulsive steric interaction between the heme-coordinated Im and the distal His [53].
Fig. 8.
(A) Hyperbolic saturation plots of the imidazole (Im) titration results shown in Fig. 4(A) (ligand-free) and Fig. 5(A) (mono-Im-bound) for Im binding to exogenous ligand-free (closed triangle) and mono-Im-bound (closed square) ferric H93G Mb. Maximum absorbance changes in difference spectra in the Soret region (not shown) are plotted as a function of total ligand concentration. Lines drawn are non-linear fits for a bimolecular association model to the data. (B) Hill plot of the titration data shown in (A). In the Y -axis label, Y is fractional saturation of H93G Mb with Im. The Hill plots yield Kd1 = 6.0 μM (closed triangles) and Kd2 = 3.6 mM (closed squares) with slopes of 0.86 and 1.06, respectively. For additional information, see reference [25]. Reproduced from reference [25] with permission of the copyright holders.
Fig. 9.
(A) Hyperbolic saturation plots of the imidazole (Im) titration results shown in Fig. 5(A) (ligand-free) and Fig. 6(A) (mono-Im-bound) for Im binding to exogenous ligand-free (closed triangle) and mono-Im-bound (closed square) ferrous H93G Mb. Maximum absorbance changes in difference spectra in the Soret region (not shown) are plotted as a function of total ligand concentration. Lines drawn are non-linear fits for a bimolecular association model to the data. (B) Hill plot of the titration data shown in (A). In the Y -axis label, Y is fractional saturation of H93G Mb with Im. The Hill plots yield Kd1 = 2 μM (closed triangles) and Kd2 = 0.61 M (closed squares) with slopes of 0.68 and 0.83, respectively. For additional information, see reference [25]. Reproduced from reference [25] with permission of the copyright holders.
Table 1. Dissociation Constants (Kd) of H93G Mb–Ligand Complexesa.
| Mono(L) complex | Bis(L2) complex | |||
|---|---|---|---|---|
| Ligand (L) | pKa | Oxidation state | Kd1 | Kd2 |
| Imidazole | 7.0 | Fe(III) | 6 μM | 3.6 mM |
| Fe(II) | 2 μM | 610 mM | ||
| Histidine (WT Mb) | 7.0 | Fe(III) | —b | 22 mM |
| Fe(II) | —b | ∼ 12 Md | ||
| Pyridine | 5.3 | Fe(III) | 0.23 mM | —c |
| Fe(II) | 10 μM | 2.4 mM |
In 0.1 M potassium phosphate, pH 7.0, at 4 °C.
Not applicable.
Protein complex not formed.
Estimated based on ∼25% saturation with 4 M imidazole.
Reproduced from reference [20] with permission of the copyright holders.
This detailed study [25] provides quantitative evidence that the ligand binding affinities for the proximal and distal pockets of the H93G Mb are substantially different in both ferric and ferrous oxidation states (Table 1). This unique property of the Mb cavity mutant system facilitates the generation of mixed-ligand H93G Mb heme iron derivatives that are not easily prepared with other heme model systems, particularly in the ferric oxidation state. As a consequence, we have successfully generated and spectroscopically characterized mixed-ligand adducts of ferric H93G(Im) Mb with azide, cyanide or ethanethiolate in the distal pocket [20, 21].
3.2. Alkylamine adducts of H93G myoglobin: models for Lys- or terminal amine-ligated heme proteins
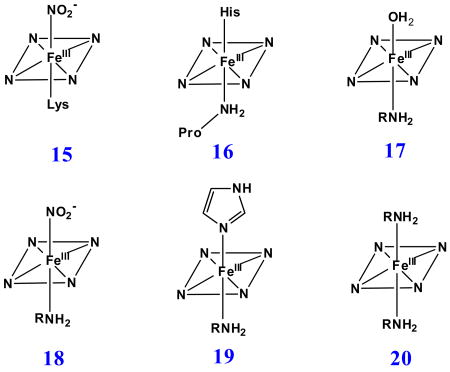
His is the most common axial ligand coordinated to heme iron centers in proteins. Fe(II/III) heme complexes with the nitrogen donors imidazole as well as with related nitrogenous ligands such as pyridine have been successfully prepared and extensively characterized as synthetic heme iron active site models. However, over the past two decades, a number of heme proteins possessing important functional activities that have Lys or the amine group of N-terminal amino acids coordinated to the active site heme iron center have been discovered, i.e. cytochrome c nitrite reductase (ccNiR) (15) [54, 55], CO oxidation activator (CooA) [56, 57] and cytochrome f subunit of the membrane-bound cytochrome b6f complex (16). [58, 59]
Unfortunately only a limited amount of data have been reported for alkylamine-ligated heme iron porphyrins as models for Lys- and terminal amine-ligated heme proteins, especially in the Fe(III) state. In general, treatment of ferric porphyrins with excess amine leads to bis(amine)iron(II) adducts with the amine serving as a one-electron reductant [60-64]. However, Marques et al. have reported successful preparation in methanol of an iron(III) amine-ligated hematohemin derivative with either hydroxide or methoxide as the sixth ligand [65]. Microperoxidase-8 (MP-8), a heme-containing octapeptide derived from proteolytic digestion of cytochrome c and containing His as the proximal heme iron ligand, can form a low-spin Fe(III) alkylamine/His heme adduct [66].
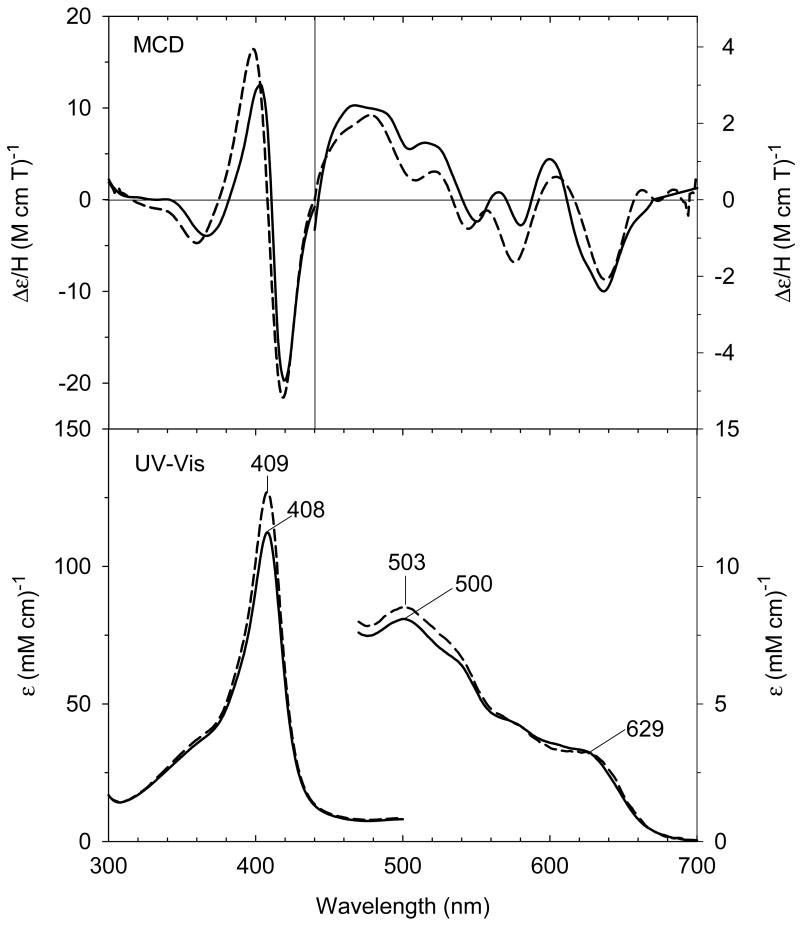
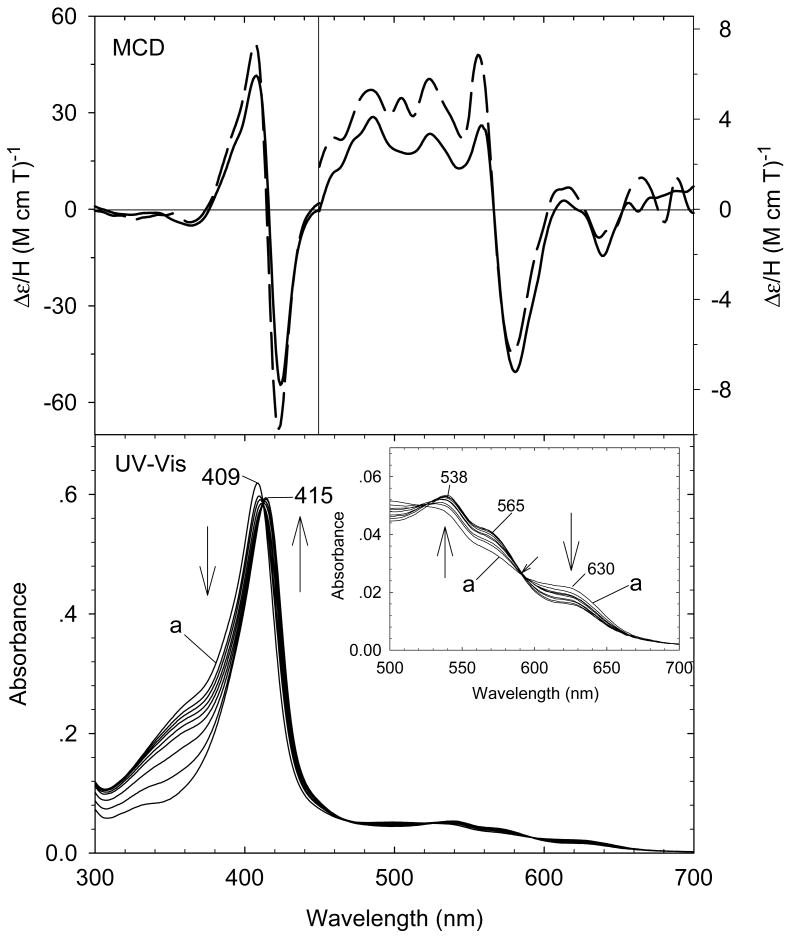
Our laboratory has successfully generated and spectroscopically characterized the H93G Mb cavity mutant-ligated with less common nitrogenous alkylamine ligands in a variety of heme iron states [28]. Ferric H93G Mb with one (17 - 19) and two alkylamines (20), specifically cyclohexylamine (CHA), coordinated to the heme iron have been successfully prepared and characterized by UV-Vis and MCD spectroscopy (Figs. 10-12). The CHA/water and CHA/nitrite adducts are high-spin and mixed-spin, respectively, while the CHA/Im and bis-CHA complexes are low-spin. Because alkylamines and Im are both nitrogenous ligand types that coordinate to the heme iron center primarily as sigma donors, it is not surprising that the UV-Vis and MCD spectra of parallel alkylamine- and Im-ligated complexes are spectroscopically similar in general. Ferric H93G(CHA/water) Mb (17) at neutral pH (Fig. 10), a heme derivative that cannot be simply prepared with synthetic heme iron model systems in organic solvents, is a heme iron coordination model for the ferric resting state of ccNiR. Ferric H93G(bis-CHA) (20) (Fig. 11) is a model for the proposed intermediate Fe(III)-NH3 product state in the nitrite reduction reaction cycle of ccNiR.
Fig. 10.
(Top) MCD and (bottom) UV-Vis spectra of ferric H93G(CHA) Mb (0.3 M CHA) (solid line) compared to previously reported ferric H93G(Im) Mb (1 mM Im) (dashed line) [20]. The spectra were recorded in 0.1 M potassium phosphate buffer at pH 7.0 at 4 °C. Reproduced from reference [28] with permission of the copyright holders.
Fig. 12.
(Top) MCD spectra of cyclohexylamine (CHA) and nitrite (NO2-)-bound mixed-ligand complex of ferric H93GMb (0.5 M CHA, 0.1 M NaNO2) (solid line) compared to [4-methylimidazole (4Me-Im) / nitrite (NO2-)-bound ferric H93G Mb] (0.1 mM 4Me-Im, 0.1 M NaNO2) (dashed line). (Bottom) UV-Vis spectral change of ferric H93G(CHA) Mb (spectrum a) titration with sodium nitrite (0 - 0.1 M) with the enlarged visible region shown in the inset. The spectra were recorded in 0.1 M potassium phosphate buffer at pH 7.0 at 4 °C. The figure was adapted from reference [28] with modification.
Fig. 11.
(Top) MCD and (bottom) UV-Vis spectra of ferric H93G(bis-CHA) Mb (2 M CHA) (solid line) compared to previously reported ferric H93G(bis-Im) Mb (2 M Im) (dashed line) [20]. The spectra were recorded in 0.1 M potassium phosphate buffer at pH 7.0 at 4 °C. Reproduced from reference [28] with permission of the copyright holders.
Furthermore mixed-ligand ferric alkylamine heme complexes have successfully been prepared. The ferric CHA/nitrite H93G Mb (18) species is the first heme iron model for ferric ccNiR with substrate nitrite coordinated in the distal site trans to Lys (15) (Fig. 12) [55]. However, the nitrite in ferric CHA/nitrite H93G Mb is likely O-bound, based on the crystal structure of the ferric Mb nitrite complex [67], whereas the nitrite in ferric ccNiR is bound via its nitrogen atom [55]. Addition of alkylamine to H93G(Im) Mb leads to formation of a six-coordinate mixed-ligand adduct (19) [25] that is a heme model for cytochrome f (16) [58], which has His and the terminal amine of Pro as its axial ligand (data not shown). Both mixed-ligand complexes are prepared from well characterized starting materials (CHA/water-ligated ferric H93G for the CHA/nitrite adduct and Im/water-ligated ferric H93G for the CHA/Im complex) by titration of the second ligand; the conversion shows clean sets of isosbestic points consistent with conversion of the initial complex to the final mixed-ligand derivative [28].
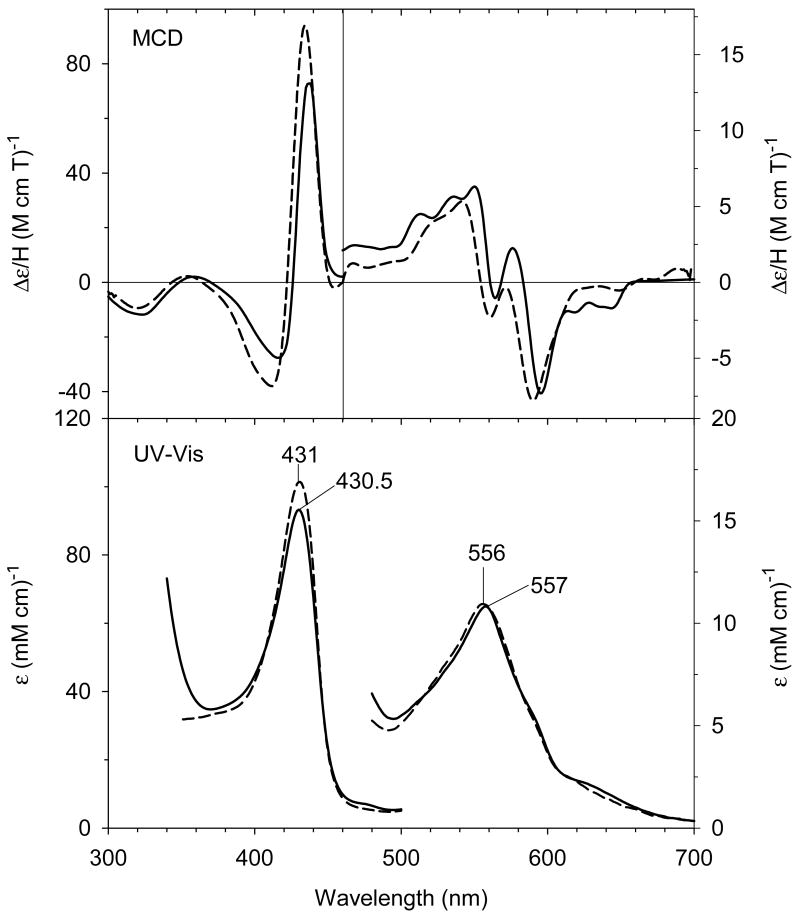
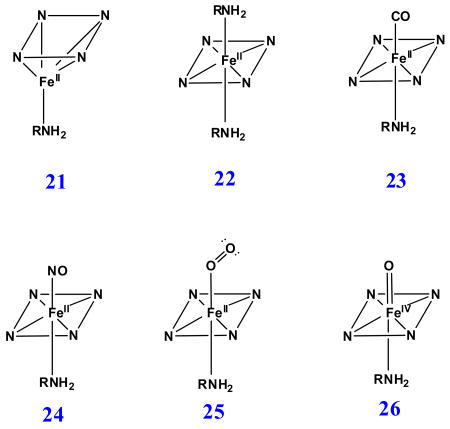
Proximal ligation by alkylamine is preserved following anaerobic reduction of ferric H93G(CHA) Mb with dithionite. The resulting UV-Vis and MCD spectra of ferrous H93G(CHA) Mb (21) (absorption peaks at 430.5 nm 557 nm) resemble those of deoxyferrous H93G(imidazole) Mb adducts (absorption peaks at 431 nm 556 nm), indicating the formation of the five-coordinate high-spin deoxyferrous species (Fig. 13). Small size alkylamines, such as methylamine, prefer to form six-coordinate bis-ligated low-spin ferrous complexes (22) with similar MCD band patterns to those of the ferrous cytochrome b5, a bis-His-ligated heme protein (Fig. 14) [68]. However, the derivative-shaped MCD Soret band of ferrous H93G(bis-methylamine) Mb is 7 nm red-shifted compared to the corresponding ferrous cytochrome b5. Considering the similar spectral distinctions between bis-thiol and -thioether adducts of ferrous H93G Mb [26], we concluded that a comparable sensitivity to the nature of the axial ligand donor causes the spectral difference in the MCD Soret region.
Fig. 13.
(Top) MCD and (bottom) UV-Vis spectra of the deoxyferrous H93G(CHA) Mb (0.3 M CHA) (solid line) compared to previously reported deoxyferrous H93G(Im) Mb (1 mM Im) (dashed line) [20]. The spectra were recorded in 0.1 M potassium phosphate at buffer pH 7.0 at 4 °C. Reproduced from reference [28] with permission of the copyright holders.
Fig. 14.
(Top) MCD and (bottom) UV-Vis spectra of the deoxyferrous H93G(bis-methylamine) Mb (144 mM methylamine) (solid line) compared to previously reported deoxyferrous cytochrome b5 (dashed line) [65]. The spectra were recorded in 0.1 M potassium phosphate buffer at pH 7.0 at 4 °C. Reproduced from reference [28] with permission of the copyright holders.
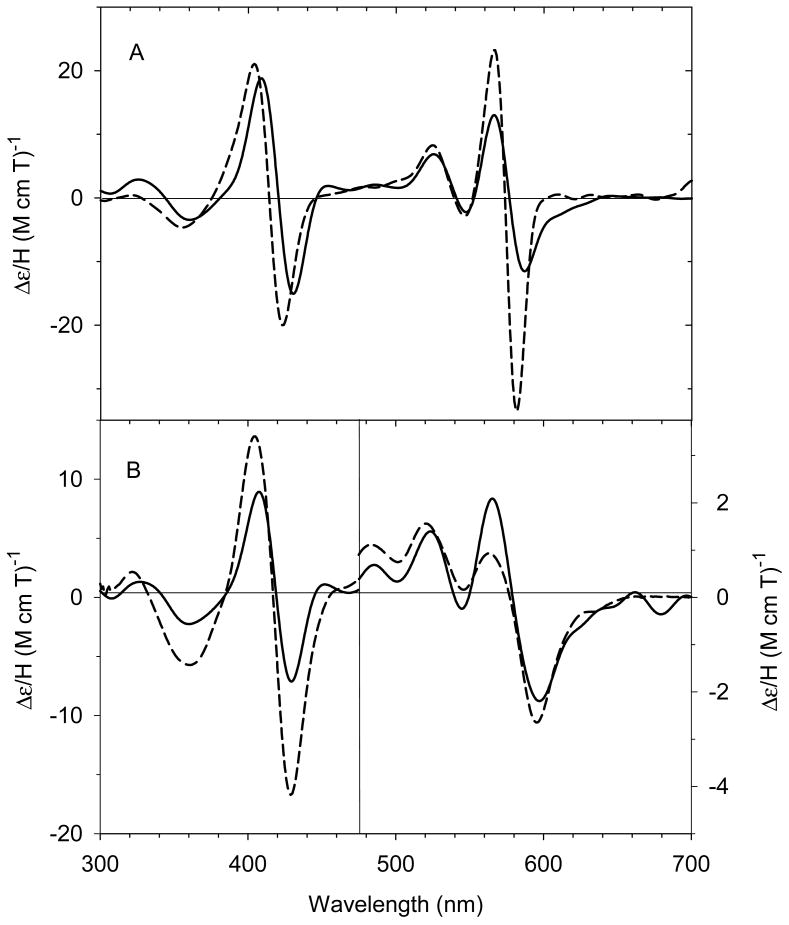
Treatment of deoxyferrous H93G(CHA) Mb (21) with CO, NO or O2 yields stable ferrous-CO (23), -NO (24) and -O2 (25) adducts [28]. The UV-Vis and MCD spectra of the ferrous-CO and –NO adducts were spectrally similar to parallel ferrous H93G(Im) derivatives. A ferrous-NO adduct has been reported to form during reduction of nitrite to ammonia catalyzed by ccNiR; ferrous-NO H93G(CHA) Mb is the first model for this intermediate [69] Fig. 15A shows the MCD spectra comparison between the CHA and Im complexes of oxyferrous H93G Mb. The overall band patterns are quite similar to each other, except for the less intense derivative-shaped feature in the visible region. Of particular note, oxyferrous H93G(CHA) Mb is stable at 4 °C, indicating that the proximal amine ligand does not interfere with the stabilizing interaction between the distal His64 and bound oxygen (Fig. 15A) [28].
Fig. 15.
MCD spectra of (A) ferryl complexes of ethylamine-bound H93G Mb (solid line) and (B) oxyferrous complexes of CHA-bound H93G Mb (solid line) compared to previously reported corresponding complexes of H93G(Im) Mb (dashed line) [15]. The spectra were recorded in 0.1 M potassium phosphate buffer at pH 7.0 at 4 °C. The figure was adapted from reference [28] with modification.
The addition of hydrogen peroxide to ferric H93G Mb(ethylamine) leads to formation of a new species that spectroscopically resembles the ferryl H93G(Im) Mb adduct (Fig. 15B). This indicates that the new moiety is a novel high-valent alkylamine-ligated ferryl adduct (26). The major dissimilarities between the MCD spectra of the two ferryl complexes are the differences in relative intensities of the derivative-shaped MCD features in the Soret region to those in the visible regions that are likely the result of subtle distinctions in the donor properties of the proximal axial ligands, amine and imidazole, in the two ferryl complexes [28]. An alkylamine-ligated ferryl heme complex has not been previously described.
This is the first systematic spectral study of models for alkylamine- or terminal amine-ligated heme centers in proteins. The generation and characterization of a large set of heme iron ligand adducts with alkylamine ligation substantially expands the spectral database for use in establishing the coordination structure of heme centers in newly discovered heme proteins of unknown structure at the metal unit.
4. Oxygen-donor-ligated H93G myoglobin adducts
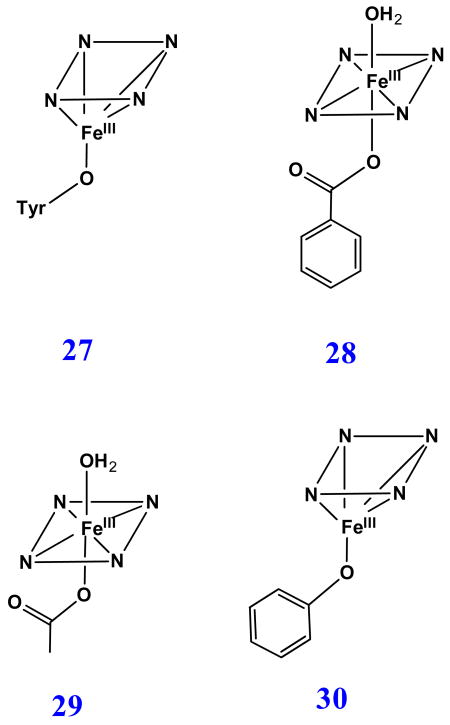
Other than the common nitrogenous ligand, Tyr (27) serves as an anionic proximal O-donor atom ligand in quite a few heme proteins participating in the dismutation of hydrogen peroxide, i.e. tyrosinate-ligated heme-containing catalases [70], and coral allene oxide synthase [71], and in tyrosinate- (or the related glutamate-) ligated hemoglobin Milwaukee (Hb-M) mutants [72-76]. The proximal anionic O-donor-ligated proteins generally have a lower redox potential of the heme iron compared to neutral His ligated proteins [70]. The heme protein mutants (i.e. His93Tyr Mb), having His replaced by Tyr using site-directed mutagenesis, have been shown from spectroscopic examination to exist mostly as five-coordinate high-spin heme derivatives without a distal water ligand [41, 42, 77]. The Cys436Ser CYP2B4 mutant was reported to exist as a mixture of five- and six-coordinate structures [78]. In addition, the His25Ala heme oxygenase mutant has been found to be a five-coordinate carboxylate-ligated adduct [23, 79].
H93G Mb has been used to prepare protein models with phenolate or carboxylate as the proximal ligand to mimic ligation by tyrosinate or either glutamate or aspartate, respectively [24, 30]. Fig. 16 exhibits the UV-Vis and MCD spectra of benzoate and phenolate adducts of ferric H93G Mb overlaid with the spectra of WT Mb. Ferric H93G(benzoate) Mb spectroscopically mimics the ferric WT Mb which is a six-coordinate His/water high-spin structure. Consequently, Roach et al. concluded that the H93G Mb benzoate complex had water trans to the coordinated benzoate ligand [30]. In contrast, the spectra of ferric H93G Mb phenolate adducts (Fig. 16, gray short dashed line) are quite similar (especially in the near symmetric derivative-shaped MCD feature around 615 nm) to those of the alkaline (pH 10.5) exogenous ligand-free H93G Mb (Fig. 1, dotted line), which has been shown to only be coordinated by hydroxide [23]. This led to the conclusion that H93G(phenolate) Mb is five-coordinate high-spin structure with an anionic O-donor proximal ligand [30]. The spectra of acetate-bound ferric H93G Mb derivative have a visible absorption peak at 614 nm and a relative weak MCD trough at ∼635 nm, which are similar to those of the ferric H93G(benzoate) Mb complex (Fig. 17). Thus, ferric H93G Mb with a weak basic oxyanionic proximal ligand such as benzoate (pKa = 4.2) (28) or acetate (pKa = 4.7) (29) forms hexa-coordination adducts with oxyanion and water axial ligands [24, 30]. However, the ferric H93G Mb phenolate (pKa = 9.9) (30) complex is a penta-coordinate high-spin heme iron status [30]. Presumably, weak basic proximal oxyanion ligands to ferric H93G Mb are weaker donors and need an additional water ligand on the distal side to stabilize the heme iron coordination structure. On the contrary, the anionic oxygen atom of phenolate is a stronger donor, producing a five-coordinate ferric H93G Mb adduct.
Fig. 16.
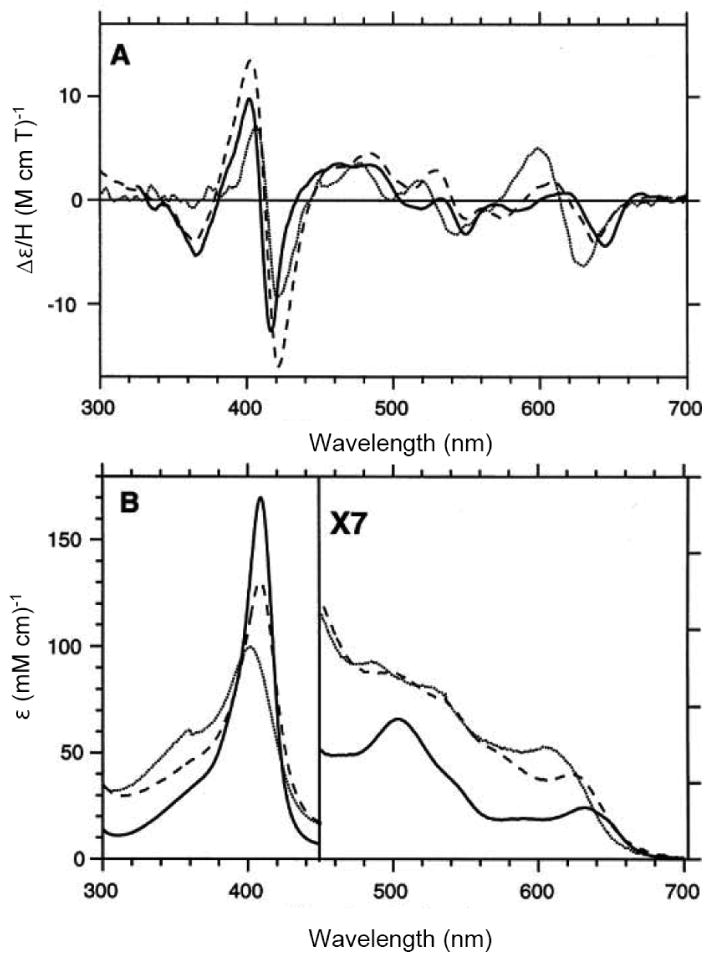
(A) MCD and (B) UV-Vis spectra of ferric H93G(PhCOO-) Mb with 24 mM benzoate (PhCOO-) (long dashed line), ferric H93G(PhO-) Mb with 36 mM phenolate (PhO-) (short dashed line) and ferric wild-type sperm whale Mb (solid line). The spectra were recorded recorded in 0.1 M sodium phosphate buffer at pH 7.0 at room temperature. Reproduced from reference [30] with permission of the copyright holders.
Fig. 17.

(A) MCD and (B) UV-Vis absorption spectra of six coordinate, high-spin ferric H93G Mb in the presence of benzoate (PhCOO-) (16 mM) (dashed line) and acetate (CH3COO-) (200 mM) (solid line) recorded in 0.1 M potassium phosphate buffer at pH 7.0 at 4 °C. Reproduced with author's permission from R. Perera, Ph.D. Dissertation (Part I, Chapter 3), 2005, University of South Carolina.
Lebioda, Dawson and co-workers have reported the crystallographic characterization of the H93G Mb acetate complex (29) at 1.4 Å resolution (Fig. 18) [24]. The adduct is a six-coordinate, high-spin complex with proximal acetate and distal water as the axial ligands. It is notable that the Fe-O-C angle is 152° and the angle between the acetate plane and the tetrapyrrole plane is 69°, which are consistent with primarily ionic bonding between the heme iron and the acetate ion. In the distal site, there is a hydrogen bond formed between the bound water and N-atom of His64 with a distance of 2.6 Å. Furthermore, the outer oxygen atom of the acetate forms a hydrogen bond with the hydroxyl group of Ser89. This is the first crystal structure of an oxyanion-bound ferric H93G Mb complex [24].
Fig. 18.
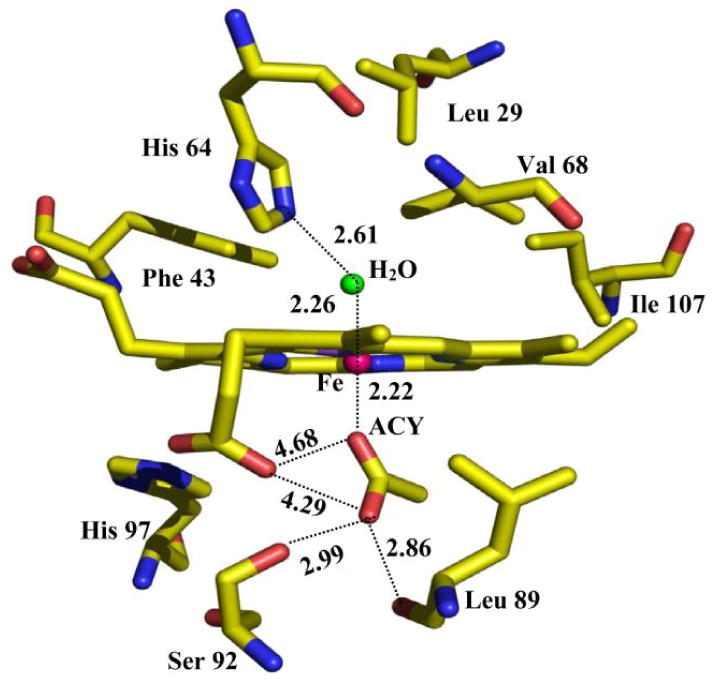
The active site structure of the six-coordinate ferric H93G Mb in complex with acetate (ACY) bound in the proximal cavity and a water molecule coordinated in the trans-axial position in the distal pocket, which were determined from X-ray coordinates. Reproduced from reference [24] with permission of the copyright holders.
5. Sulfur-donor-ligated H93G myoglobin adducts
5.1. Thiolate adducts of H93G myoglobin: models for Cys-ligated heme proteins
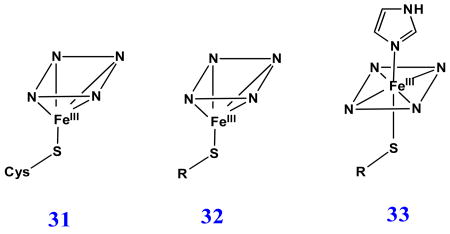
Cysteinate proximal axial ligand plays an essential role in a wide variety of heme containing enzymes (31), most notably cytochromes P450, C. fumago chloroperoxidase (CPO) and nitric oxide synthase [5, 80, 81]. It has been proposed that the deprotonated Cys exerts the “push” effect to the heme iron and is very important to maintain the monooxygenase activity in cytochrome P450 [1, 5, 81, 82]. To investigate the various structural factors contributing to stabilization of thiolate ligation, several myoglobin mutants such as human myoglobins His93Cys, His64Val/His93Cys [83-85] and His64Gly/His93Cys [85] and horse heart myoglobin H93C/H64V [86] have been prepared and characterized.
Upon addition of aliphatic or aromatic thiols to the ferric exogenous ligand-free H93G Mb (32), the Soret peak in the UV-Vis spectrum blue shifts to ∼ 390 nm to yield an ambient temperature-stable complex having similar spectral features to high-spin ferric cytochrome P450 with the substrate camphor (CAM) in the distal site [20, 24]. Ferric cytochrome P450-CAM has a five-coordinate high-spin thiolate-ligated structure (31). A series of aromatic thiolate-coordinated H93G Mbs have been generated and characterized, revealing that the energy of the Soret absorption peak in the UV-Vis spectra is closely correlated with the electron donor property of the thiolate ligand as seen by analysis using Hammett parameters [20]. Fig. 19 shows the UV-Vis and MCD absorption spectra of ferric H93G Mb complex with β-mercaptoethanol (BME) as the proximal ligand. The well resolved Soret peak at 391 nm in the UV-Vis spectrum, corresponding to the trough in the MCD Soret band, and the visible absorption peak at 618 nm and parallel derivative-shaped MCD feature are essentially identical to those seen for high-spin ferric P450-CAM in the same figure [24].
Fig. 19.
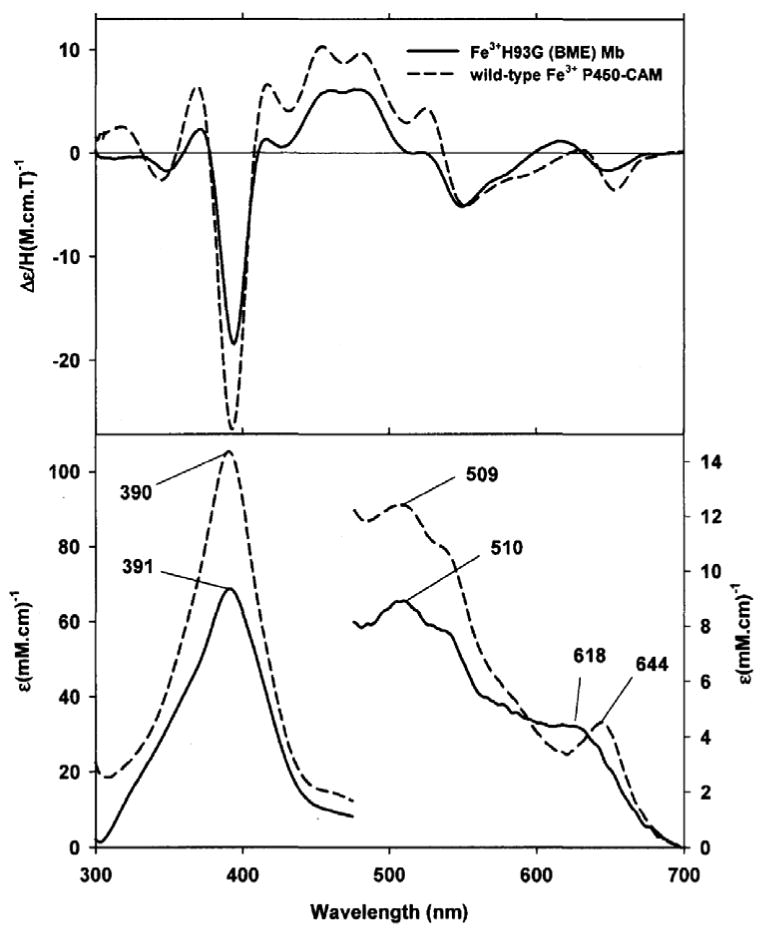
(Top) MCD and (bottom) UV-Vis absorption spectra of five-coordinate, high-spin ferric β-mercaptoethanol (BME) bound H93G Mb (1.14 mM) (solid line) and wild type P450-CAM in the presence of camphor (1 mM) (dashed line). The spectra were recorded in 0.1 M potassium phosphate buffer at pH 7.0 at 4 °C. Reproduced from reference [24] with permission of the copyright holders.
Fig. 20 is the schematic representation of the X-ray crystallographic structure of ferric H93G Mb with BME bound in the proximal cavity. The distance between heme iron and the water molecule in the distal site is 4.22 Ǻ, which is too far away to form a covalent bond [24]. The H93G(BME) Mb complex provides an excellent protein-based structural model for high-spin ferric P450 except for lacking the covalent linkage of the thiolate to the protein frame. The distal protein environments of cytochrome P450 and Mb are quite different, which may help explain why ferric H93G(thiolate) Mb adducts do not bind water as a sixth-ligand to the heme iron [20, 24]. However, it is possible to form a mixed-ligand low-spin ferric complex with thiolate (ethanethiolate) and Im as the two axial ligands (33). A limitation to the use of thiolate-ligated ferric H93G Mb as a model for P450 is that the thiolate ligand is not retained upon either heme reduction or following addition of a second anionic ligand (vide infra) [20, 26].
Fig. 20.
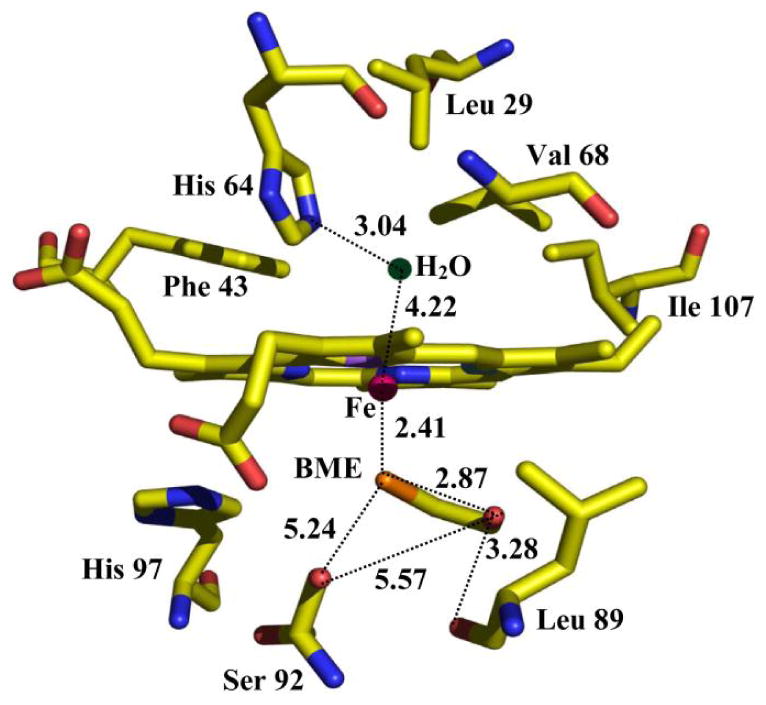
The active site structure of the ferric H93G Mb with BME in the proximal cavity as determined by X-ray crystallography. Reproduced from reference [24] with permission of the copyright holders.
5.2. Thiol and thioether H93G myoglobin: models for neutral Cys and Met-ligated heme proteins
The neutral sulfur-donor ligation in heme enzymes is relatively rare in the nature. It has been found out that methionine is the axial ligand of electron transport enzyme cytochrome c [87]. Other than that, the heme storage protein, bacterioferritin [88], and the cell surface heme transporting protein known as streptococcal heme-associated protein (Shp) [89, 90], are reported to have bis-Met ligation (34). A number of studies have been published on generation of low-spin ferric bis-Met or Met/His-ligated heme iron complexes [91-93]. Barker et al. reported a high-spin Met-ligated ferric cytochrome b562 His102Met mutant at neutral pH. However, they were not able to identify the sixth ligand coordinated to the heme iron [94]. Using H93G cavity mutant Mb, we have been able to generate both ferric high-spin mono- (35) and low-spin bis-thioether (37)-ligated heme coordination complexes [29].
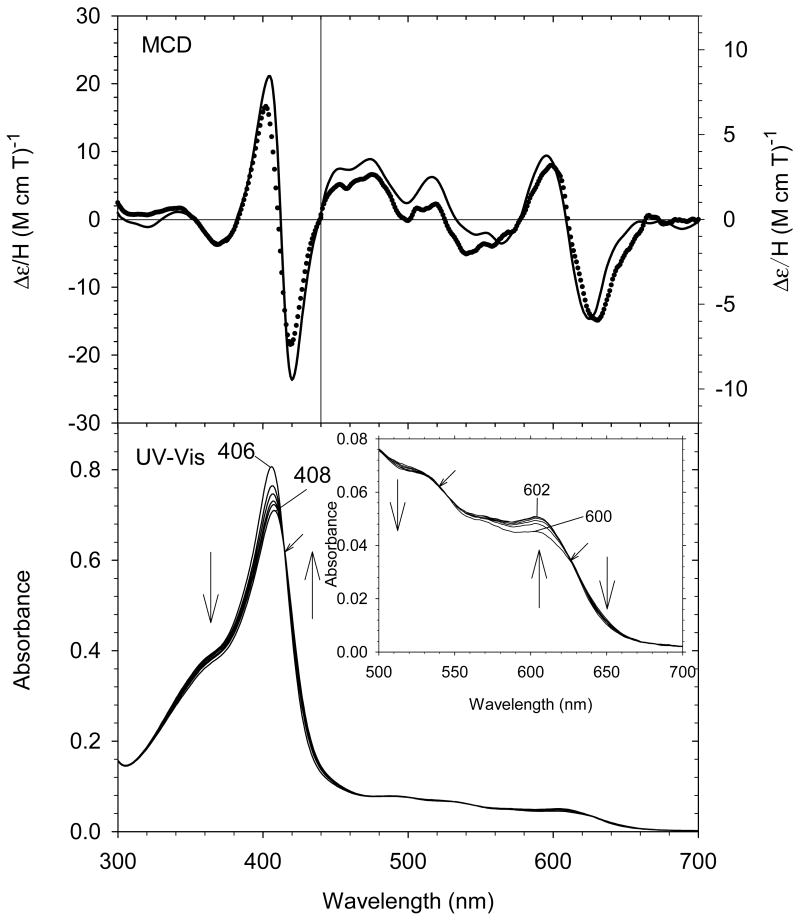
The UV-Vis spectral changes of ferric exogenous ligand-free H93G Mb titration with low concentration of tetrahydrothiophene (THT) are shown in Fig. 21. The overall changes are relatively small. However, there is one set of clear isosbestic points which indicated the binding of THT to the proximal site (Kd = 2.1 mM). In the visible region, there is no peak around 620-640 nm, which is typical feature for water coordinated high-spin structure. The MCD spectra of ferric H93G(THT) Mb (35) and that of the ferric H93G Mb at pH 10.5 are quite similar (Fig. 21). Consequently, we concluded that ferric H93G(THT) has thioether and hydroxide as axial ligands (35) [29]. The UV-Vis and MCD spectra of ferric H93G(THT) Mb (Fig. 21) are also quite similar to those of the ferric high-spin H102M cytochrome b562 [94]; this led to the proposal that the heme iron ligands in that mutant are Met and hydroxide [29].
Fig. 21.
(Top) MCD spectra of ferric exogenous ligand-free H93G Mb (dotted line) and ferric H93G(THT) Mb (21 mM THT) (solid line). (Bottom) UV-Vis spectral change of exogenous ligand-free ferric H93G Mb upon titration with THT (< 21 mM) with the enlarged visible region shown in the inset. The experiments were conducted in 0.1 M potassium phosphate buffer, pH 7.0, at 4 °C. The figure was adapted from reference [29] with modification.
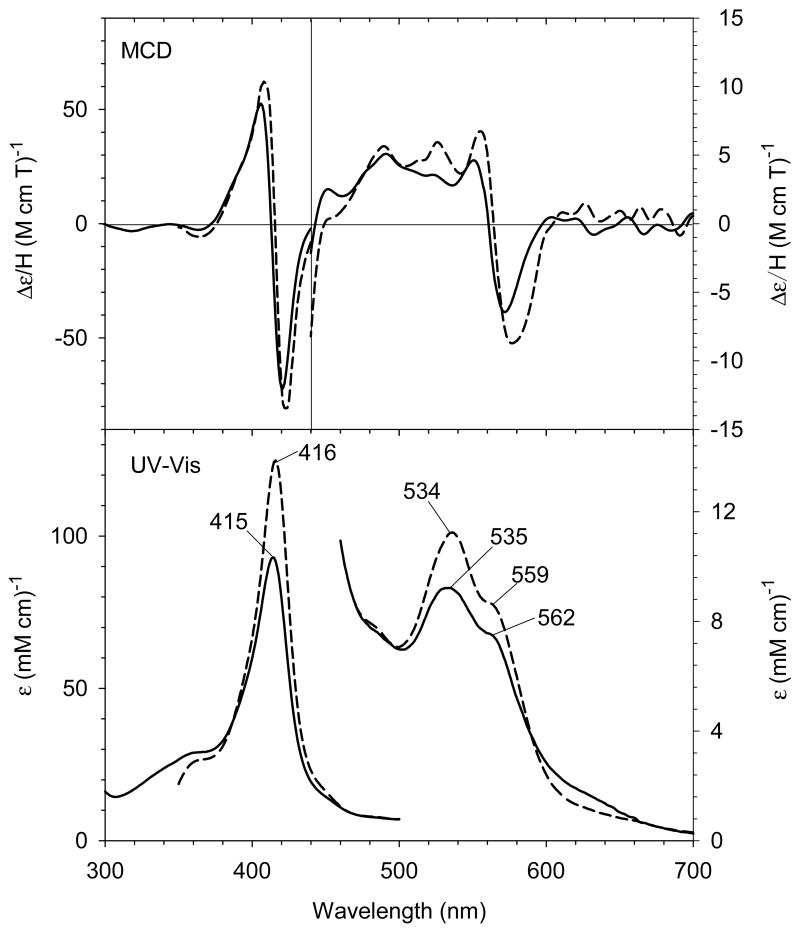
Only partial bis-THT adducts of ferric H93G Mb (36) were formed with the highest concentration of THT (∼160 mM) in buffer at neutral pH. However, a nearly homogenous six-coordinate bis-THT complex (36) could be prepared at pH 5.0. Ferric H102M cytochrome b562 also forms a low-spin bis-Met complex at acidic pH [94]. The resulting UV-Vis and MCD spectra of ferric H93G(bis-THT) Mb complex resemble those of the six-coordinate low-spin ferric H93G(bis-Im) Mb at pH 7.0, except for the slightly weaker intensity over the entire spectral range examined (Fig. 22). The bis-THT-ligated ferric H93G Mb (36) is a heme coordination model for the corresponding bis-Met-ligated native heme containing protein, e.g. bacterioferritin [88] and Shp [89, 90], and the ferric H102M mutant [94].
Fig. 22.
(Top) MCD and (bottom) UV-Vis spectra of ferric H93G(bis-THT) Mb (90 mM THT) (solid line) in 0.1 M potassium phosphate, pH 5.0, at 4 °C and ferric H93G (bis-Im) Mb (4 M Im) (dashed line) in 0.1 M potassium phosphate buffer, pH 7.0, at 4 °C. Reproduced from reference [29] with permission of the copyright holders.

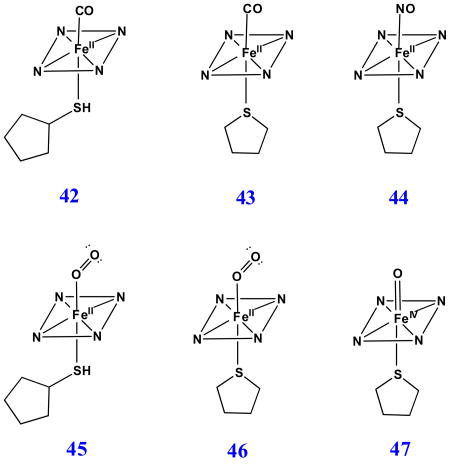
It is well-known that cytochrome P450, C. fumago chloroperoxidase and nitric oxide synthase always have the deprotonated Cys (cysteinate) as the sulfur-donor ligand to the heme iron in all oxidation states throughout their catalytic cycles [80-82]. However, the inactive forms of cytochrome P450 (P420) and chloroperoxidase (C420) do not retain their thiolate ligation in the ferrous state [95, 96]. H175C/D235L cytochrome c peroxidase (CCP), a His to Cys mutant, has the thiolate ligand in the ferric state, but also fails to keep the deprotonated Cys upon heme reduction [26]. It has been proposed that the protonated neutral Cys thiol could be a possible ligand coordinated the the heme iron in the ferrous state (37) [96-98]. Moreover, our previous investigations showed that the ferric H93G Mb thiolate complexes do not retain thiolate ligation when the heme iron is reduced to the ferrous state or a second anionic axial ligand is added (vide supra) [20].
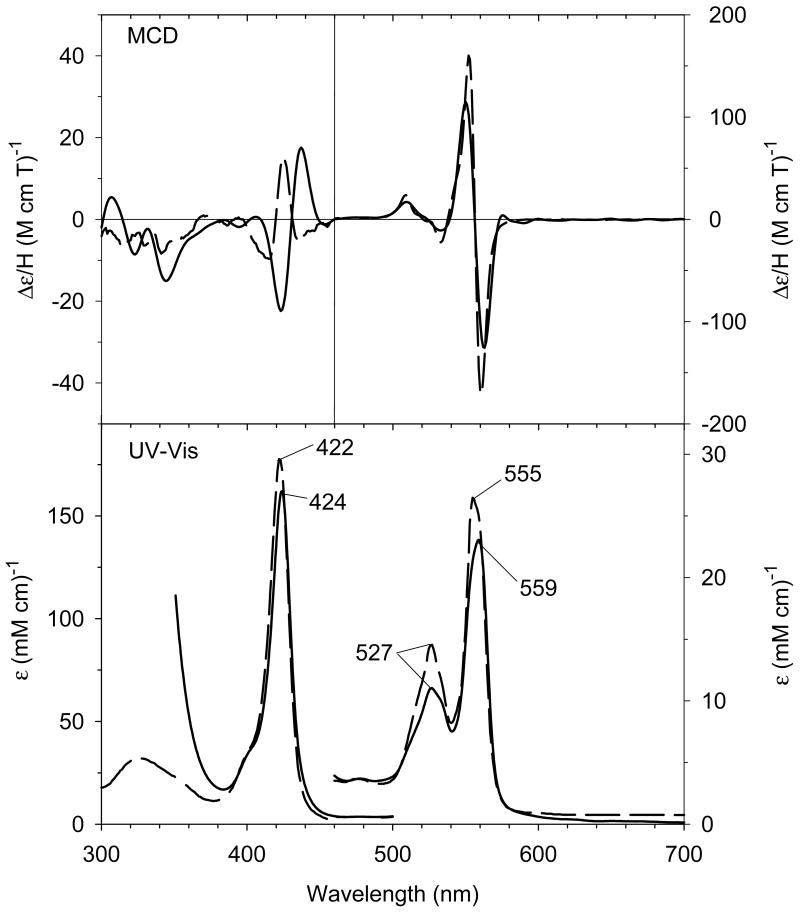
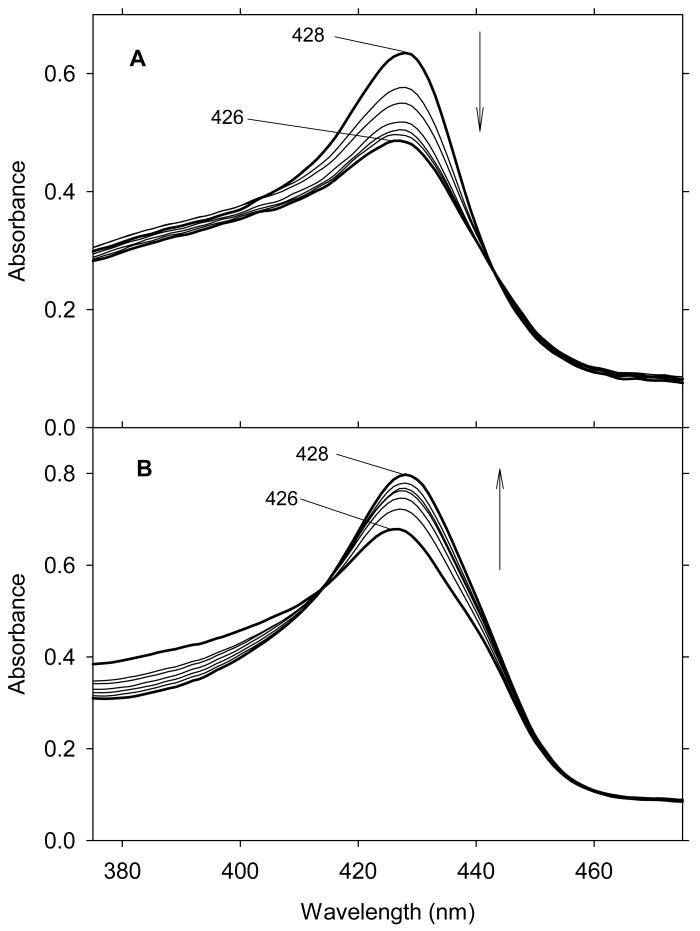
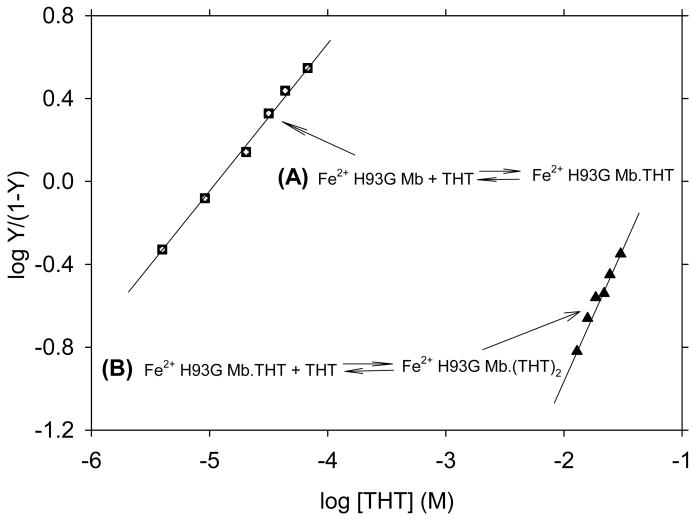
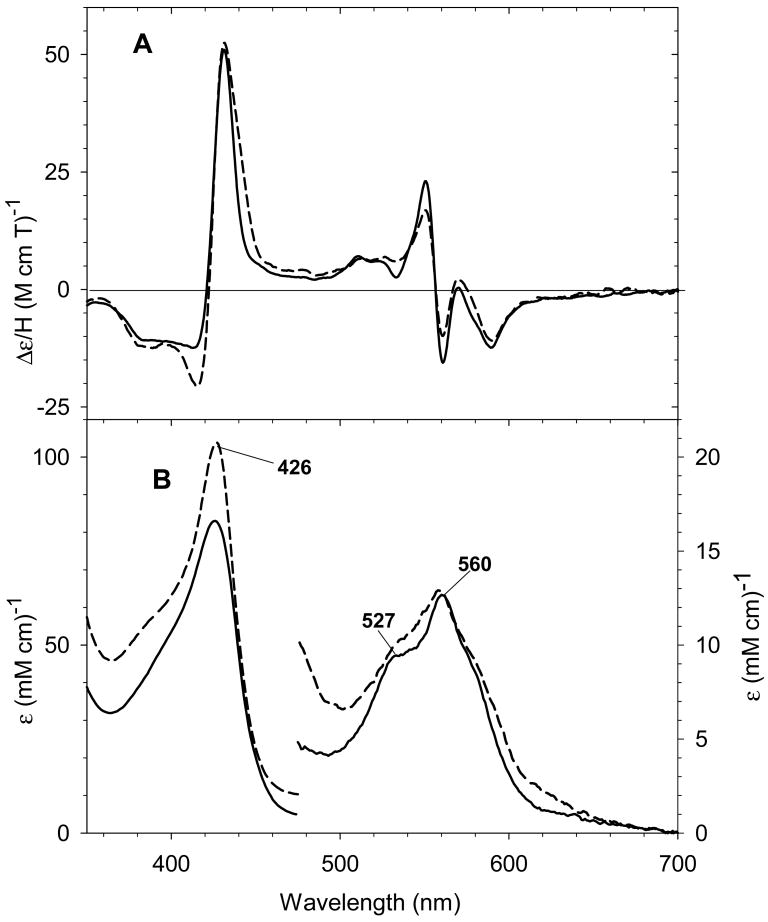
Following addition of a thiol (cyclopentanethiol, CPSH) or a thioether (THT) to ferrous exogenous ligand-free H93G Mb, the cavity mutant Mb is able to accommodate the neutral mono- (38 and 39 for CPSH and THT adducts, respectively) or bis-sulfur-donor axial ligand(s) (40 and 41 for CPSH and THT adducts, respectively) depending on the concentration of the thiol or thioether. Fig. 23 exhibits the spectral change upon titration of (top) exogenous ligand-free deoxyferrous H93G Mb with first one THT ([THT] < 70 μM) THT and (bottom) then with a second THT. The binding affinities were determined by Hill plots shown in Fig. 24. The data revealed that the affinity for the first THT to bind in the proximal pocket is about 5000 times higher than that of the second THT to the distal site. The resulting UV-Vis and MCD spectra of the ferrous H93G(CPSH) Mb complex closely resembles those of the ferrous H175C/D235L cytochrome c peroxidase (Fig. 25). Their prominent MCD peaks around 430 nm are typical of five-coordinate high-spin ferrous heme complexes [32]. For the UV-Vis spectra, both have the Soret peak at 426 nm and two charge transfer bands at ∼531 nm and ∼560 nm (Fig. 25). Based on these data, we concluded that the ferrous H175C/D235L cytochrome c peroxidase has a five-coordinated high-spin neutral thiol-ligated heme iron structure. In addition, it was proposed that upon heme iron reduction, the cysteinate ligand is protonated to form the neutral thiol ligand and that this may be a general property of those proteins that fail to retain cysteinate ligation in the ferrous state [26].
Fig. 23.
UV-Vis spectral changes upon titration of ferrous H93G Mb with tetrahydrothiophene (THT) with lower concentrations (A) of THT (< 70 μM) and with higher concentrations (B) of THT (> 2 mM). Vertical arrows indicate the direction of absorbance change. The spectra were recorded in 0.1 M potassium phosphate buffer at pH 7.0 at 4 °C. Reproduced from reference [26] with permission of the copyright holders.
Fig. 24.
Hill plots of the titration data (absorbance change at 426 nm) shown in Fig. 23. In the Y-axis label, Y is fractional saturation of H93G Mb with THT. The Hill plots yield Kd1 = 12.6 μM (closed squares) and Kd2 = 66.0 mM (closed triangles) with slopes of 0.8 and 1.1, respectively. For additional information, see reference [26]. Reproduced from reference [26] with permission of the copyright holders.
Fig. 25.
(A) MCD and (B) UV-Vis spectra of deoxyferrous H93G(CPSH) Mb (480 μM CPSH) (dashed line) in 0.1 M potassium phosphate buffer, pH 7.0, at 4 °C and of ferrous H175C/D235L CCP (solid line) in 0.1 M potassium phosphate buffer, pH 7.0, at 4 °C. The figure was adapted from reference [26] with modification.
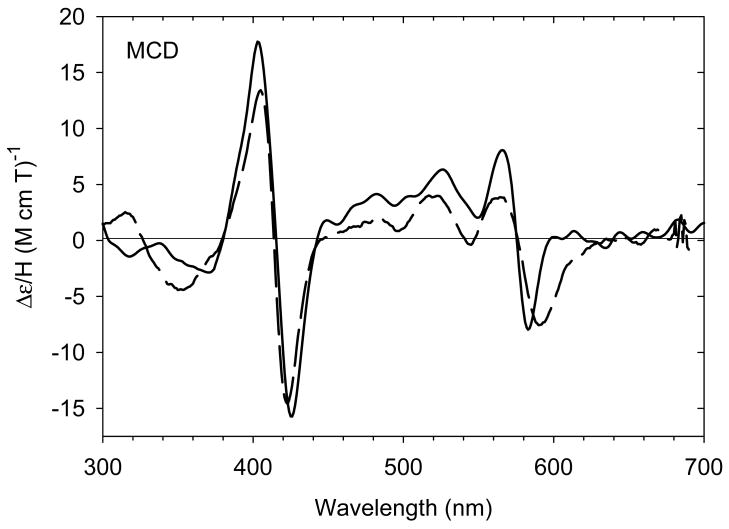
Addition of higher concentrations of thioether and thiol to ferrous H93G Mb led to formation of the respective low-spin six-coordinate complexes (Fig. 26). The very intense derivative-shaped MCD band in the visible region is typical of six-coordinate low-spin ferrous heme complexes, in this case the bis-CPSH (40) and bis-THT (41) adducts. However, the Soret MCD peak for bis-THT deoxyferrous H93G Mb is about 10 nm red-shifted compared to that of the bis-CPSH adducts. A similar sensitivity to the nature of the donor ligand was seen in the MCD spectra of ferrous bis-alkylamine-ligated H93G Mb compared to ferrous cytochrome b5 (vide supra) [28]. The bis-thioether-ligated ferrous H93G Mb (41) is a heme coordination model for bis-Met ligation in bacterioferritin [88].
Fig. 26.
(A) MCD and (B) UV-Vis spectra of MCD and UV-Vis spectra of bis-CPSH (dashed line) ferrous H93G Mb and calculated spectra of a homogeneous bis-THT ferrous H93G Mb adduct (solid line). The spectra were recorded in 0.1 M potassium phosphate buffer at pH 7.0 at 4 °C. The figure was adapted from reference [26] with modification.

Adducts of ferrous H93G(neutral thiol/thioether) Mb with CO (42 and 43 for CPSH and THT adducts, respectively), NO (44 with THT) and O2 (45 and 46 for CPSH and THT adducts, respectively) have also been prepared and characterized by MCD and UV-Vis spectroscopy [26]. Fig. 27 displays the -40 °C MCD and UV-Vis absorption spectra of oxyferrous H93G Mb adducts with the proximal neutral sulfur donor ligands CPSH (45) and THT (46), respectively [26]. When compared to the UV-Vis spectrum of the oxyferrous H93G (THT) Mb adduct, the parallel CPSH complex has additional UV-Vis bands around 390 nm (shoulder) and 630 nm. In addition, the general intensity of MCD and UV-Vis spectra of the oxyferous CPSH species, especially in the Soret region, is only around 60% of the parallel thioether adducts. The relative low intensity of the spectra and the extra spectral features both indicate that the oxyferrous H93G(CPSH) Mb sample was partially autoxidized (Fig. 27) [26].
Fig. 27.
(A) MCD and (B) UV-Vis spectra of oxyferrous H93G Mb in the presence of CPSH (5 mM) (dashed line; MCD data enlarged 1.66-fold) and THT (5 mM) (solid line). The spectra were recorded in a 60/40 (v/v) mixture of ethylene glycol/0.1 M potassium phosphate buffer (pH 7.0) at -40 °C. Reproduced from reference [26] with permission of the copyright holders.
Following addition of 2 equivalents of hydrogen peroxide to ferric H93G(THT) Mb, a ferryl derivative was partially generated [29]. The resulting MCD spectrum contained features of both the starting ferric state (MCD trough at 623 nm) and a new species (MCD trough at 582 nm) (data not shown) [29]. After subtraction of the spectral contribution from the residual ferric starting material and normalization, the resulting MCD spectrum looks very similar to that of ferryl horse heart Mb (blue-shifted by 10 nm for easier comparison) (Fig. 28). This spectral similarity indicates that the extrapolated MCD spectrum of ferryl H93G(THT) (47) is accurate and confirms that the ferryl H93G(THT) Mb complexes were partially formed following addition of hydrogen peroxide to the starting ferric species.
Fig. 28.
MCD spectra of extrapolated ferryl H93G(THT, 21 mM) Mb (solid line) and ferryl horse heart Mb (blue-shifted by 10 nm, (dashed line) in 0.1 M potassium phosphate buffer, pH 7.0, at 4 °C. Reproduced from reference [29] with permission of the copyright holders.
6. Conclusion
The ability of H93G Mb to bind a wide variety of exogenous ligands as proximal and distal ligands makes it a versatile template for mimicking the native coordination structure of heme containing protein. Substantial progress in the preparation of more sophisticated heme iron protein active site coordination models has been achieved by using H93G Mb cavity mutant system. More importantly, mixed-ligand derivatives can be relatively easily generated due to the differential ligand binding affinities to the proximal and distal sides of the H93G Mb. A number of H93G Mb adducts with nitrogen-, oxygen-, and sulfur-donor ligand(s) have been successfully prepared and characterized by magnetic circular dichroism and electronic absorption spectroscopy. The result of this effort is a significant enhancement of the spectral database for biomimetic heme iron complexes of known structure for use in establishing the coordination structure of newly discovered heme proteins or newly prepared heme ligation mutants by comparison of spectroscopic properties. However, there are some intrinsic limitations to this cavity mutant system, i.e. even though a single anionic ligands will readily bind to ferric H93G Mb and neutral ligands bind to ferrous H93G Mb with relatively high affinity, despite years of unremitting efforts, we have been unable to coordinate two anionic ligands to ferric H93G Mb or a single anionic ligand to the ferrous protein. A future direction of this research will be to investigate the catalytic function of H93G Mb with different ligands in the cavity, in an effort to develop a better understanding of the function of proximal ligand in metalloproteins.
Acknowledgments
We would like to thank Dr. Lukasz Lebioda and Dr. Leslie Lovelace for helpful discussions and Dr. Steven G. Boxer for the H93G Mb expression system. This work was supported by the NIH (GM 26730) and Research Corp. (to J.H.D.).
Abbreviations
- MPs
microperoxidases
- H93G
His93Gly
- Mb
myoglobin
- Cyt P450
cytochrome P450
- UV-Vis
UV-visible
- MCD
magnetic cirucular dichroism
- CD
circular dichroism
- Im
imidazole
- WT
wild type
- Py
pyridine
- Kd
dissociation constant
- ccNiR
cytochrome c nitrite reductase
- CooA
CO oxidation activator
- CHA
cyclohexylamine
- 4Me-Im
4-methylimidazole
- CAM
camphor
- BME
β-mercaptoethanol
- Shp
streptococcal heme-associated protein
- THT
tetrahydrothiophene
- P420
the inactive form of cytochrome P450
- C420
the inactive form of chloroperoxidase
- CCP
cytochrome c peroxidase
- CPSH
cyclopentanethiol
Footnotes
Publisher's Disclaimer: This is a PDF file of an unedited manuscript that has been accepted for publication. As a service to our customers we are providing this early version of the manuscript. The manuscript will undergo copyediting, typesetting, and review of the resulting proof before it is published in its final citable form. Please note that during the production process errors may be discovered which could affect the content, and all legal disclaimers that apply to the journal pertain.
References
- 1.Dawson JH. Science. 1988;240:433–439. doi: 10.1126/science.3358128. [DOI] [PubMed] [Google Scholar]
- 2.Perutz MF, Muirhead H, Cox JM, Goaman LCG. Nature. 1968;219:131–139. doi: 10.1038/219131a0. [DOI] [PubMed] [Google Scholar]
- 3.Dunford HB. Heme Peroxidases. Wiley-VCH, John Wiley and Sons; New York: 1999. [Google Scholar]
- 4.Ortiz de Montellano PR, editor. Cytochrome P-450: Structure, Mechanism, and Biochemistry. Plenum Press; New York: 1986. [Google Scholar]
- 5.Sono M, Roach MP, Coulter ED, Dawson JH. Chem Rev. 1996;96:2841–2887. doi: 10.1021/cr9500500. [DOI] [PubMed] [Google Scholar]
- 6.Chang CK, Traylor TG. Proc Natl Acad Sci USA. 1973;70:2647–2650. doi: 10.1073/pnas.70.9.2647. [DOI] [PMC free article] [PubMed] [Google Scholar]
- 7.Collman JP. Acc Chem Res. 1977;10:265–272. [Google Scholar]
- 8.Wuenschell GE, Tetreau C, Lavalette D, Reed CA. J Am Chem Soc. 1992;114:3346–3355. [Google Scholar]
- 9.Traylor TG. Acc Chem Res. 1981;14:102–109. [Google Scholar]
- 10.Marques HM. Dalton Trans. 2007;39:4371–4385. doi: 10.1039/b710940g. [DOI] [PubMed] [Google Scholar]
- 11.Marques HM, Perry CB. J Inorg Biochem. 1999;75:281–291. doi: 10.1016/s0162-0134(99)00100-2. [DOI] [PubMed] [Google Scholar]
- 12.Adachi S, Nagano S, Ishimori K, Watanabe Y, Morishima I, Egawa T, Kitagawa T, Makino R. Biochemistry. 1993;32:241–252. doi: 10.1021/bi00052a031. [DOI] [PubMed] [Google Scholar]
- 13.Egeberg KD, Springer BA, Martinis SA, Sligar SG, Morikis D, Champion PM. Biochemistry. 1990;29:9783–9791. doi: 10.1021/bi00494a004. [DOI] [PubMed] [Google Scholar]
- 14.Ikeda Y, Kawahara Si, Taki M, Kuno A, Hasegawa T, Taira K. Protein Eng. 2003;16:699–706. doi: 10.1093/protein/gzg084. [DOI] [PubMed] [Google Scholar]
- 15.Qi D, Tann CM, Haring D, Distefano MD. Chem Rev. 2001;101:3081–3111. doi: 10.1021/cr000059o. [DOI] [PubMed] [Google Scholar]
- 16.England PM. Biochemistry. 2004;43:11623–11629. doi: 10.1021/bi048862q. [DOI] [PubMed] [Google Scholar]
- 17.Muir TW. Annu Rev Biochem. 2003;72:249–289. doi: 10.1146/annurev.biochem.72.121801.161900. [DOI] [PubMed] [Google Scholar]
- 18.Lu Y. Curr Opin Chem Biol. 2005;9:118–126. doi: 10.1016/j.cbpa.2005.02.017. [DOI] [PubMed] [Google Scholar]
- 19.Barrick D. Biochemistry. 1994;33:6546–6554. doi: 10.1021/bi00187a023. [DOI] [PubMed] [Google Scholar]
- 20.Roach MP, Pond AE, Thomas MR, Boxer SG, Dawson JH. J Am Chem Soc. 1999;121:12088–12093. [Google Scholar]
- 21.Pond AE, Roach MP, Thomas MR, Boxer SG, Dawson JH. Inorg Chem. 2000;39:6061–6066. doi: 10.1021/ic0007198. [DOI] [PubMed] [Google Scholar]
- 22.Dawson JH, Pond AE, Roach MP. Biopolymers (Biospectroscopy) 2002;67:200–206. doi: 10.1002/bip.10087. [DOI] [PubMed] [Google Scholar]
- 23.Pond AE, Roach MP, Sono M, Rux AH, Franzen S, Hu R, Tomas MR, Wilks A, Dou Y, Ikeda-Saito M, Ortiz de Montellano PR, Woodruff WH, Boxer SG, Dawson JH. Biochemistry. 1999;38:7601–7608. doi: 10.1021/bi9825448. [DOI] [PubMed] [Google Scholar]
- 24.Qin J, Perera R, Lovelace LL, Dawson JH, Lebioda L. Biochemistry. 2006;45:3170–3177. doi: 10.1021/bi052171s. [DOI] [PMC free article] [PubMed] [Google Scholar]
- 25.Du J, Sono M, Dawson JH. Spectroscopy. 2008;22:123–141. [Google Scholar]
- 26.Perera R, Sono M, Sigman JA, Pfister TD, Lu Y, Dawson JH. Proc Natl Acad Sci USA. 2003;100:3641–3646. doi: 10.1073/pnas.0737142100. [DOI] [PMC free article] [PubMed] [Google Scholar]
- 27.Perera R, Dawson JH. J Porphyrins Phthalocyanines. 2004;8:246–254. [Google Scholar]
- 28.Du J, Perera R, Dawson JH. Inorg Chem. doi: 10.1021/ic101644u. In press. [DOI] [PMC free article] [PubMed] [Google Scholar]
- 29.Du J, Sono M, Dawson JH. J Porphyrins Phthalocyanines. In press. [Google Scholar]
- 30.Roach MP, Puspita WJ, Watanabe Y. J Inorg Biochem. 2000;81:173–182. doi: 10.1016/s0162-0134(00)00101-x. [DOI] [PubMed] [Google Scholar]
- 31.Roy Mason W. A Practical Guide to Magnetic Circular Dichroism Spectroscopy. Wiley; DeKalb, Illinois, USA: 2007. [Google Scholar]
- 32.Cheek J, Dawson JH. The Porphyrin Handbook. Vol. 7. 2000. pp. 339–369. [Google Scholar]
- 33.Buckingham AD, Stephens PJ. Ann Rev Phys Chem. 1966;17:399–432. [Google Scholar]
- 34.Stephens PJ. Ann Rev Phys Chem. 1974;25:201–232. [Google Scholar]
- 35.Stephens PJ. Adv Chem Phys. 1976;35:197–264. [Google Scholar]
- 36.Caldwell D. Annu Rev Phys Chem. 1971;22:259–278. [Google Scholar]
- 37.Vickery LE. Method Enzymol. 1978;54:284–303. doi: 10.1016/s0076-6879(78)54020-2. [DOI] [PubMed] [Google Scholar]
- 38.Vickery LE, Nozawa T, Sauer K. J Am Chem Soc. 1976;98:343–350. doi: 10.1021/ja00418a005. [DOI] [PubMed] [Google Scholar]
- 39.Dawson JH, Dooley DM. In: Iron Porphyrin, Part 3. Lever ABP, Gray HB, editors. VCH; New York: 1989. pp. 1–135. [Google Scholar]
- 40.Suzuki S, Yoshimura T, Nakahara A, Shidara S, Matsubara T. Inorg Chem. 1987;26:1006–1008. [Google Scholar]
- 41.Egeberg KD, Springer BA, Martinis SA, Sligar SG, Morikis D, Champion PM. Biochemistry. 1990;29:9783–9791. doi: 10.1021/bi00494a004. [DOI] [PubMed] [Google Scholar]
- 42.Hildebrand DP, Burk DL, Maurus R, Ferrer JC, Brayer GD, Mauk AG. Biochemistry. 1995;34:1997–2005. doi: 10.1021/bi00006a021. [DOI] [PubMed] [Google Scholar]
- 43.Das TK, Franzen S, Pond AE, Dawson JH, Rousseau DL. Inorg Chem. 1999;38:1952–1953. doi: 10.1021/ic990049+. [DOI] [PubMed] [Google Scholar]
- 44.DePillis GD, Decatur SM, Barrick D, Boxer SG. J Am Chem Soc. 1994;116:6981–6982. [Google Scholar]
- 45.Yang F, Phillips GN., Jr J Mol Biol. 1996;256:762–774. doi: 10.1006/jmbi.1996.0123. [DOI] [PubMed] [Google Scholar]
- 46.Hanania GIH, Yeghiayan A, Cameron BF. Biochem J. 1966;98:189–192. doi: 10.1042/bj0980189. [DOI] [PMC free article] [PubMed] [Google Scholar]
- 47.Antonini E, Brunori M. Hemoglobin and Myoglobin in their Reactions with Ligands. North-Holland Publishing Company; Amsterdam, London: 1971. [Google Scholar]
- 48.Kobayashi N. Inorg Chem. 1985;24:3324–3330. [Google Scholar]
- 49.McRee DE, Jensen GM, Fitzgerald MM, Siegel HA, Goodin DB. Proc Natl Acad Sci USA. 1994;91:12847–12851. doi: 10.1073/pnas.91.26.12847. [DOI] [PMC free article] [PubMed] [Google Scholar]
- 50.Sun J, Fitzgerald M, Goodin DB, Loehr TM. J Am Chem Soc. 1997;119:2064–2065. [Google Scholar]
- 51.Hardman KO, Eylar EHKO, Banaszak LJ, Gurd FRN. J Biol Chem. 1966;241:432–442. [PubMed] [Google Scholar]
- 52.Roach MP, Ozaki S, Watanabe Y. Biochemistry. 2000;39:1446–1454. doi: 10.1021/bi992054v. [DOI] [PubMed] [Google Scholar]
- 53.Lionetti C, Guanziroli MG, Frigerio F, Ascenzi P, Bolognesi M. J Mol Biol. 1991;217:409–412. doi: 10.1016/0022-2836(91)90744-q. [DOI] [PubMed] [Google Scholar]
- 54.Einsle O, Messerschmidt A, Stach P, Bourenkov GP, Bartunik HD, Huber R, Kroneck PMH. Nature. 1999;400:476–480. doi: 10.1038/22802. [DOI] [PubMed] [Google Scholar]
- 55.Einsle O, Stach P, Messerschmidt A, Simon J, Kroger A, Huber R, Kroneck PMH. J Biol Chem. 2000;275:39608–39616. doi: 10.1074/jbc.M006188200. [DOI] [PubMed] [Google Scholar]
- 56.Aono S, Nakajima H, Saito K, Okada M. Biochem Biophys Res Commun. 1996;228:752–756. doi: 10.1006/bbrc.1996.1727. [DOI] [PubMed] [Google Scholar]
- 57.Lanzilotta WN, Schuller DJ, Thorsteinsson MV, Kerby RL, Roberts GP, Poulos TL. Nature Struct Biol. 2000;7:876–880. doi: 10.1038/82820. [DOI] [PubMed] [Google Scholar]
- 58.Chi YI, Huang LS, Zhang Z, Fernández-Velasco JG, Berry EA. Biochemistry. 2000;39:7689–7701. doi: 10.1021/bi000090k. [DOI] [PubMed] [Google Scholar]
- 59.Sujak A, Drepper F, Haehnel WJ. Photochem Photobiol B: Biology. 2004;74:135–143. doi: 10.1016/j.jphotobiol.2004.03.007. [DOI] [PubMed] [Google Scholar]
- 60.Del Gaudio J, LaMar GN. J Am Chem Soc. 1978;100:1112–1119. [Google Scholar]
- 61.Epstein LM, Straub DK, Maricondi C. Inorg Chem. 1967;6:1720–1724. [Google Scholar]
- 62.Dolphin DA, Sams JR, Tsin TB, Wong KL. J Am Chem Soc. 1976;98:6970–6975. doi: 10.1021/ja00438a037. [DOI] [PubMed] [Google Scholar]
- 63.Del Gaudio J, La Mar GN. J Am Chem Soc. 1976;98:3014–3015. doi: 10.1021/ja00426a056. [DOI] [PubMed] [Google Scholar]
- 64.Dixon DW, Kirmaier C, Holten D. J Am Chem Soc. 1985;107:808–813. [Google Scholar]
- 65.Marques HM, Munro OQ, Crawcour ML. Inorg Chim Acta. 1992;196:221–229. [Google Scholar]
- 66.Byfield MP, Hamza MSA, Pratt JMJ. Chem Soc Dalton Trans. 1993:1641–1645. [Google Scholar]
- 67.Copeland DM, Soares AS, West AH, Richter-Addo GB. J Inorg Biochem. 2006;100:1413–1425. doi: 10.1016/j.jinorgbio.2006.04.011. [DOI] [PubMed] [Google Scholar]
- 68.Cheek J, Mandelman D, Poulos TL, Dawson JH. J Biol Inorg Chem. 1999;4:64–72. doi: 10.1007/s007750050290. [DOI] [PubMed] [Google Scholar]
- 69.Einsle O, Messerschimdt A, Huber R, Kroneck PMH, Neese F. J Am Chem Soc. 2002;124:11737–11745. doi: 10.1021/ja0206487. [DOI] [PubMed] [Google Scholar]
- 70.Fita I, Rossman MG. J Mol Biol. 1985;185:21–37. doi: 10.1016/0022-2836(85)90180-9. [DOI] [PubMed] [Google Scholar]
- 71.Abraham BD, Sono M, Boutard O, Shriner A, Dawson JH, Brash AR, Gaffney BJ. Biochemistry. 2001;40:2251–2259. doi: 10.1021/bi002121h. [DOI] [PubMed] [Google Scholar]
- 72.Greer J. J Mol Biol. 1971;59:107–126. doi: 10.1016/0022-2836(71)90416-5. [DOI] [PubMed] [Google Scholar]
- 73.Perutz MF, Pulsinelli PD, Ranney HM. Nature (London), New Biol. 1972;237:259–264. doi: 10.1038/newbio237259a0. [DOI] [PubMed] [Google Scholar]
- 74.Pulsinelli PD, Perutz MF, Nagel RL. Proc Natl Acad Sci USA. 1973;70:3870–3874. doi: 10.1073/pnas.70.12.3870. [DOI] [PMC free article] [PubMed] [Google Scholar]
- 75.Nagai M, Yoneyama Y. J Biol Chem. 1983;258:14379–14384. [PubMed] [Google Scholar]
- 76.Nagai M, Yoneyama Y, Kitagawa T. Biochemistry. 1989;28:2418–2422. doi: 10.1021/bi00432a012. [DOI] [PubMed] [Google Scholar]
- 77.Adachi S, Nagano S, Watanabe Y, Ishimori K, Morishima I. Biochem Biophys Res Commun. 1991;180:138–144. doi: 10.1016/s0006-291x(05)81266-5. [DOI] [PubMed] [Google Scholar]
- 78.Vatsis KP, Peng HM, Coon MJ. J Inorg Biochem. 2002;91:542–553. doi: 10.1016/s0162-0134(02)00438-5. [DOI] [PubMed] [Google Scholar]
- 79.Sun J, Loehr TM, Wilks A, Ortiz de Montellano PR. Biochemistry. 1994;33:13734–13740. doi: 10.1021/bi00250a026. [DOI] [PubMed] [Google Scholar]
- 80.Dawson JH, Sono M. Chem Rev. 1987;87:255–1276. [Google Scholar]
- 81.Poulos TL. Drug Metab Dispos. 2005;33:10–18. doi: 10.1124/dmd.104.002071. [DOI] [PubMed] [Google Scholar]
- 82.Dawson JH, Holm RH, Trudell JR, Barth G, Linder RE, Bunnenberg E, Djerassi C, Tang SC. J Am Chem Soc. 1976;98:3707–3709. doi: 10.1021/ja00428a054. [DOI] [PubMed] [Google Scholar]
- 83.Adachi S, Nagano S, Ishimori K, Watanabe Y, Morishima I, Egawa T, Kitagawa T, Makino R. Biochemistry. 1993;32:241–252. doi: 10.1021/bi00052a031. [DOI] [PubMed] [Google Scholar]
- 84.Adachi S, Nagano S, Watanabe Y, Ishimori K, Morishima I. Biochem Biophys Res Commun. 1991;180:138–144. doi: 10.1016/s0006-291x(05)81266-5. [DOI] [PubMed] [Google Scholar]
- 85.Matusi T, Nagano S, Ishimori K, Watanabe Y, Morishima I. Biochemistry. 1996;35:13118–13124. doi: 10.1021/bi960459z. [DOI] [PubMed] [Google Scholar]
- 86.Hildebrand DP, Ferrer JC, Tang HL, Smith M, Mauk AG. Biochemistry. 1995;34:11598–11605. doi: 10.1021/bi00036a036. [DOI] [PubMed] [Google Scholar]
- 87.Bushnell GW, Louie GV, Brayer GD. J Mol Biol. 1990;214:585–595. doi: 10.1016/0022-2836(90)90200-6. [DOI] [PubMed] [Google Scholar]
- 88.George GN, Richards T, Bare RE, Gea Y, Prince RC, Stiefel EI, Watt GD. J Am Chem Soc. 1993;115:7716–7718. [Google Scholar]
- 89.Aranda R, Worley CE, Liu M, Bitto E, Cates MS, Olson JS, Lei B, Phillips GN. J Mol Biol. 2007;374:374–383. doi: 10.1016/j.jmb.2007.08.058. [DOI] [PMC free article] [PubMed] [Google Scholar]
- 90.Ran Y, Zhu H, Liu M, Fabian M, Olson JS, Aranda R, IV, Phillips GN, Dooley DM, Lei B. J Biol Chem. 2007;282:31380–31388. doi: 10.1074/jbc.M705967200. [DOI] [PMC free article] [PubMed] [Google Scholar]
- 91.Murray SG, Hartley FR. Chem Rev. 1981;81:365–414. [Google Scholar]
- 92.Mashiko T, Reed CA, Haller KJ, Kastner ME, Scheidt WR. J Am Chem Soc. 1981;103:5758–5767. [Google Scholar]
- 93.Reedy CJ, Gibney BR. Chem Rev. 2004;104:617–650. doi: 10.1021/cr0206115. [DOI] [PubMed] [Google Scholar]
- 94.Barker PD, Nerou EP, Cheesman MR, Thomson AJ, Oliveira P, Hill HAO. Biochemistry. 1996;35:13618–13626. doi: 10.1021/bi961127x. [DOI] [PubMed] [Google Scholar]
- 95.Blanke SR, Martinis SA, Sligar SG, Hager LP, Rux JJ, Dawson JH. Biochemistry. 1996;35:14537–14543. doi: 10.1021/bi961512m. [DOI] [PubMed] [Google Scholar]
- 96.Martinis SA, Blanke SR, Hager LP, Sligar SG, Hui Bon Hoa G, Rux JJ, Dawson JH. Biochemistry. 1996;35:14530–14536. doi: 10.1021/bi961511u. [DOI] [PubMed] [Google Scholar]
- 97.Nakajima H, Nakagawa E, Kobayashi H, Tagawa S, Aono S. J Biol Chem. 2001;276:37895–37899. doi: 10.1074/jbc.M105429200. [DOI] [PubMed] [Google Scholar]
- 98.Svastits EW, Alberta JA, Kim I, Dawson JH. Biochem Biophys Res Commun. 1989;165:1170–1176. doi: 10.1016/0006-291x(89)92725-3. [DOI] [PubMed] [Google Scholar]


