Abstract
The optical stretcher is a dual-beam trap capable of stretching individual cells. Previous studies have used either ray- or wave-optical models to compute the optical pressure on the surface of a spherical cell. We have extended the ray-optics model to account for focusing by the spherical interface and the effects of multiple internal reflections. Simulation results for red-blood cells (RBCs) show that internal reflections can lead to significant perturbation of the deformation, leading to a systematic error in the determination of cellular elasticity. Calibration studies show excellent agreement between the predicted and measured escape force, and RBC stiffness measurements are consistent with literature values. Measurements of the elasticity of murine osteogenic cells reveal that these cells are approximately 5.4 times stiffer than RBCs.
1. Introduction
The optical stretcher is a novel, dual-beam optical trap that is capable of trapping and stretching soft dielectrics, such as living biological cells, along the beam axis [1,2]. Unlike laser tweezers, which use a single focused beam to produce a pointlike trap, the optical stretcher uses diverging light that is spread across the surface of the trapped object. This has two immediate consequences: higher laser powers, but lower intensities, are required for optical trapping, and the optical stress acts at all points along the surface, rather than at the center of mass. While other techniques like microplate manipulation, micropipette aspiration, and atomic force microscopy can be used to measure single-cell elasticity, the optical stretcher has a unique advantage in that it is able to exert pico-Newton scale surface forces on the living cell without making mechanical contact [3].
Since its inception, the original developers of the optical stretcher have made extensive use of it to characterize the elasticity of red blood cells (RBCs) and a variety of eukaryotic cells and have demonstrated the optical stretcher’s potential to be used as a high throughput screening device that can use elasticity as a fundamental marker of cell transformations, for example, with the progression of disease [4,5]. With the successful integration of the optical stretcher, microfluidics, and computer controlled cell delivery, the potential utility as an automated cell screening device cannot be underestimated.
Since the invention of the optical stretcher in 2001, to the best of our knowledge, no direct method capable of measuring the spatially-resolved optical stress distribution on the cell surface has been developed. Hence, mathematical and computational models have been used to calculate the optical stress distribution and net stretching force. The theory first presented by Guck et al. [1,2] was based approximately on the ray-optics model. By assuming a broad cosine-squared angular dependence for the stress distribution, the equations of deformation could be solved exactly, making the determination of cell elasticity from observed strain straightforward. Ananthakrishnan et al. have extended the model to include a thick actin cortex, using fluorescence microscopy to estimate the cortex thickness [6]. In this case, the surface stress distribution obtained from ray-optics (RO) modeling was fit to functions of the form σ = σ0cosn(θ), where n is an even integer, to find the best match for an analytical solution for a given ratio of the beam to cell radius. In practice, depending on the type of cell, the best values of n ranged from 4 to 24, indicating a more localized stress distribution.
To determine the impact of these assumptions on the derived cellular elasticity, we employ a ray-tracing algorithm that uses the actual experimental configuration to compute the optical stress distribution without approximation. The algorithm also includes the effects of multiple internal reflections that must occur for the case of dielectric spheres but have to this point been ignored. The exact optical stress distribution can then be used to determine the expected deformation assuming a thin-shell model of cellular elasticity, which is expected to be valid for cells lacking a cortical cytoskeleton, such as red blood cells. This allows for a direct test of the effect of the cosine-squared approximation on the determination of cell elasticity. The computed optical stress distribution can also be used to interpret cellular deformation data and provide an estimate of cellular elasticity. For a specific example, we compare the stiffness of RBCs, 2T3 osteoblast-like cells, and MLO-Y4 osteocyte-like cells, assuming either a cosine-squared stress distribution or employing the full ray-tracing algorithm. We find that the results obtained using the cosine-squared approximation can deviate substantially from those obtained with the exact ray-optics solution, potentially leading to systematic error in the determination of cell stiffness.
2. Optical Pressure and Force Generation by the Optical Stretcher
The optical forces exerted on the surface of a spherical dielectric by a dual-beam optical trap was first considered by Roosen et al. [7] for the case of collimated light beams and Constable et al. [8] for light diverging from optical fibers. While these studies considered only the net optical force, Guck et al. were the first to consider the stress distribution acting on the surface of the sphere [1,2], demonstrating that a dual, diverging beam trap can be used to stretch cells along the beam axis.
When a ray of intensity I is incident on a spherical dielectric, the force, resulting from both reflection and refraction, is directed normally outward and with a surface pressure given by [9]
| (1) |
In Eq. (1), T and R are the Fresnel transmission and reflection coefficients, nt is the index of refraction of the spherical dielectric, ni is the index of refraction of the surrounding fluid, θ is the angular position on the sphere, θi is the incident angle with respect to the surface normal, θt is the refracted angle, and c is the speed of light in vacuum. The intensity profile, I(θ), is calculated by using the net optical power delivered by each fiber and standard Gaussian beam propagation techniques [10]. To properly calculate the net optical pressure distribution, including focusing by the spherical cell and multiple internal reflections within the cell, a ray-tracing approach can be taken, as described by Stephenson [9,11]. Briefly, the cell is represented as a discrete, spherical grid of area elements dA = ρ2 sin θdθdϕ, where θ and ϕ are the azimuthal and axial angles, respectively. Photon packets are initially weighted according to the number of incident photons arriving at each grid element on the side of the sphere facing the fiber. The optical pressure on each grid element is computed according to Eq. (1). Each packet is then reduced in weight according to the Fresnel transmission coefficient and the propagation direction recomputed according to the refraction angle. The photon packet then traverses the cell until it encounters the surface. Once again the photon packet contributes optical pressure according to Eq. (1) at the surface element it encounters, and the packet is reduced in weight according to the Fresnel reflection coefficient. For each photon packet, this process is repeated for multiple internal reflections until the packet drops below a threshold weight (<10−10 the initial photon weight). At this point, the packet is terminated stochastically with a probability based on the packet’s weight.
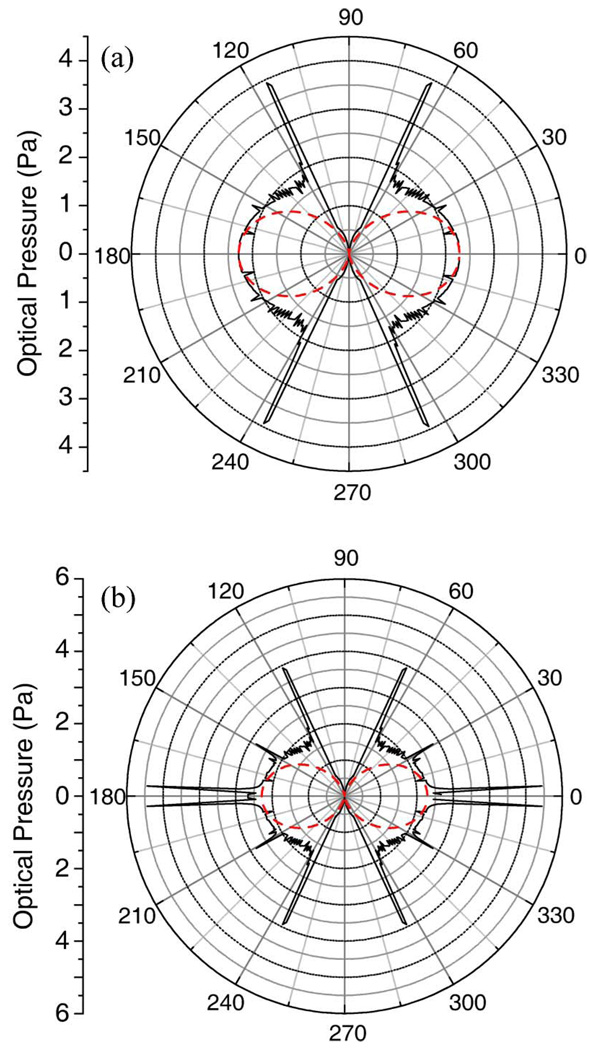
The pressure distribution computed through this ray-tracing procedure is shown in Fig. 1 for a 10 µm diameter sphere and a fiber separation (distance separating the two optical fibers) of 200 µm, allowing for one [Fig. 1(a)] or multiple [Fig. 1(b)] internal reflections. The stress distributions clearly show well-defined pressure spikes at specific angles. One internal reflection leads to symmetrical pressure spikes near 64° and 116° due to the focusing by the spherical dielectric. Additional pressure spikes become apparent with multiple internal reflections. These are expected and have been well understood since Descartes’s ray-tracing solution of the rainbow [12]. In comparison with the ray-tracing solution of the RO models, the dashed lines show an approximate, analytic function of the form
| (2) |
which has been used by Guck et al. [2]. In Eq. (2), σ0 is the peak stress and the polar angle is measured relative to the beam axis. As first observed by Stephenson [9,11] and more recently by Bareil et al. [13], this approximation neglects many features of the actual RO solution and systematically deviates from the exact RO solution. While all RO solutions neglect the effects of diffraction (which would have the effect of smoothing and reducing the magnitude of the pressure spikes), they are practically very useful solutions because of the simplicity of the model and the fact that they afford reasonable accuracy for cell biomechanical studies. In particular, Eq. (2) is advantageous because it permits analytical solution of the equations of deformation. Nevertheless, since the optical deformation of the cell will directly depend on the choice of the optical stress profile, we next consider the effect that ray focusing and multiple internal reflections could have on the optical deformation and evaluate the systematic deviations in the analysis of cellular stiffness data using Eq. (2).
Fig. 1.
(Color online) Calculated stress distributions on a 10 µm diameter sphere trapped in an optical stretcher with a fiber separation of 200 µm. The cosine-squared approximation (dotted line) is compared to the RO model (solid line) (a) ignoring or (b) allowing for multiple internal reflections.
3. Numerical Solution of the Equations of Deformation for Spherical Shells
The deformation of a thin, spherical dielectric shell of radius ρ, thickness h, Young’s modulus E, and Poisson’s ratio ν has previously been considered for the special case of a cosine-squared stress distribution [Eq. (2)] [2]. We have recently considered the more general case of deformation resulting from an arbitrary, axially symmetric stress distribution, σ(θ) [14]. Following the work of Guck et al. [2], the conformational energy of a stretched thin spherical cell is due to the work done by the optical stress and membrane elasticity. In response to an optical stress, the shape of the dielectric will be that which minimizes the conformational energy. Using the Euler–Lagrange equations to determine the equations of deformation, Guck et al. obtained the following expressions for the radial (ur) and polar (uθ) deformations of the membrane:
| (3) |
| (4) |
In lieu of this analytical approximation, the Euler–Lagrange equations can be solved numerically for any function σr(θ). The details of the calculations are provided in [14]. The resulting differential equations are
| (5) |
| (6) |
Equations (5) and (6) can be rewritten as a pair of coupled differential equations:
| (7) |
| (8) |
Discretizing Eq. (7) on a linear grid results in a series of algebraic equations that reduces to a tridiagonal matrix equation. This can be readily solved by matrix inversion to obtain the deformation of the major- and minor-axes resulting from optical stretching [15]. The deformation can then be directly compared to the approximate solution expressed by Eqs. (3) and (4).
A. Comparison with the Cosine-Squared Approximation
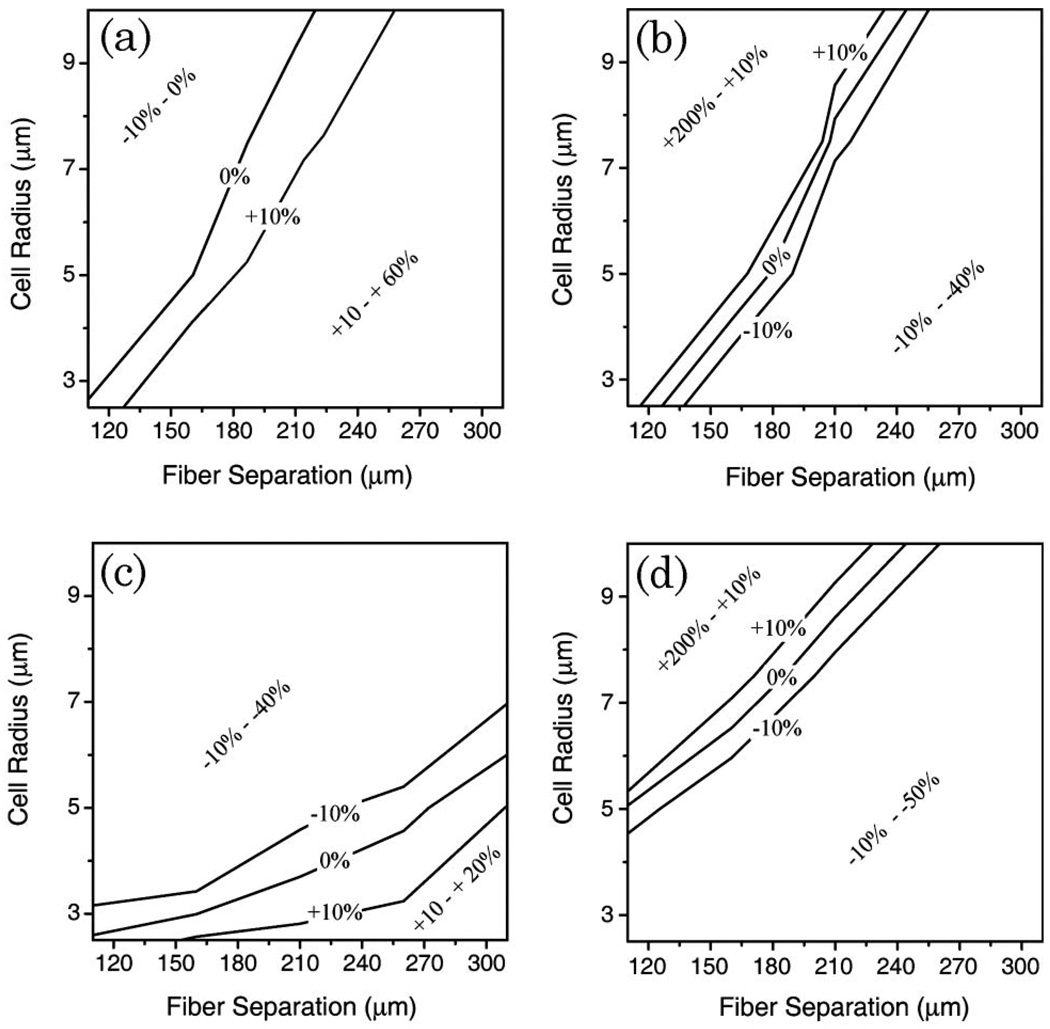
It is instructive to compare cellular elasticity estimates obtained from either major- or minor-axis deformation measurements using either the exact ray-tracing model or the cosine-squared approximation. Simulations were carried out using the exact ray-tracing model with a specific value for the stiffness parameter, Eh, to obtain major- and minor-axis cellular deformations as a function of the average optical stress. These simulated data sets were then fit by Eq. (3) (using θ = 0° for the major axis and θ = 90° for the minor axis) to extract the value of Eh, as would be done in a typical cell stretching experiment when employing the cosine-squared approximation. The percentage difference between the extracted value and the input value was used as the deviation from the exact ray-tracing solution for fiber separations ranging from 110 to 300 µm and for cell radii ranging from 2.5 to 10 µm. Negative deviations indicated the calculated value of Eh was less than the true value and positive deviations indicated that the calculated value exceeded the true value. Results of the comparison are summarized in Fig. 2 for two cases that were considered. In Figs. 2(a) and 2(b), multiple internal reflections were ignored by artificially setting the photon packet weight to zero after two interactions (one entering the cell, and one leaving), while in Figs. 2(c) and 2(d), multiple internal reflections were included.
Fig. 2.
Percent deviation of the calculated cellular elasticity (Eh) from the true value, using major- or minor-axis deformations and the cosine-squared approximation [Eq. (3)] to calculate the stiffness. (a) and (b) show the case when internal reflections are suppressed, while (c) and (d) include multiple internal reflections. Regions bounded by ±10% deviation lines indicate stretcher configurations where a cosine-squared stress distribution is a good approximation to the RO model. Use of this approximation for other combinations of fiber separation and cell radius will introduce a significant systematic error in the calculation of Eh.
Agreement between the exact ray-tracing solution and the cosine-squared approximation was found only for a narrow range of cell radius and fiber separation. In Fig. 2, exact agreement is shown by the 0% deviation line, while the configuration space between the ±10% deviation lines provide reasonably good agreement. In general, the cosine-squared approximation works better when analyzing major-axis deformations than it does for minor-axis deformations. This is expected since the stress distributions differ the most at right angles to the beam axis. The comparison also reveals that the cosine-squared approximation is best used when fiber separation can be specifically chosen for a given cell radius. This is also in agreement with observations initially made by Guck [2].
Allowing for multiple internal reflections [Figs. 2(c) and 2(d)] within the cell further complicates analysis using the cosine-squared approximation. Nevertheless, it is still possible to identify a range of fiber separations that provide good agreement between the exact ray-optics model and the cosine-squared approximation. When analyzing major-axis deformations of cells with radii ranging from 3–6 µm, the cosine-squared stress distribution is a good approximation to the RO model when fiber separations are appropriately selected in the range of 150 to 300 µm. But for larger cells, the cosine-squared approximation systematically underestimates cellular elasticity by 10–40% when the optical stress is given by the RO model. Similar systematic errors are obtained when analyzing minor-axis deviations. But for this data the cosine-squared approximation does better for larger cells. Overall, it is clear that use of the cosine-squared stress distribution is a reasonable approximation to the RO model provided the optical stretcher configuration is carefully selected considering the cell size. In practice, using the cosine-squared approximation with inappropriate fiber separations may lead to deviations of −40% to +20% in the assessment of cellular stiffness from major-axis deformation measurements, and from −40% to +200% for minor-axis measurements.
B. Scaling Laws for Cellular Deformation
To facilitate the use of the numerical solution of the deformation equations, we have conducted simulations systematically varying all experimental parameters to characterize the relationship between these parameters and cellular deformation. We began with general scaling expressions for the major- and minor-axis deformations:
| (9) |
| (10) |
where σavg is the average optical stress determined from RO simulations, and the parameters A, B, a, b, c, d, e, and f are constants to be determined from numerical simulations. As a point of comparison, the cosine-squared approximation of the stress profile [Eq. (3)] is obtained by setting A = 2, B = 0.5, a = d = −1, b = 0, c = f = 2, and e = 1. In general, since the distribution of the optical stress varies with fiber separation, index mismatch between the cell and surrounding medium, and potentially other experimental factors, the coefficients and scaling exponents will also depend on these factors. For our experimental system, RO simulations were conducted using refractive indices of 1.326 and 1.380 for the medium and cell, respectively [16]. Since stretching in our apparatus is conducted within a square glass capillary tube, simulations also accounted for its optical and geometrical properties.
The numerical simulations were well fit by the power-law equations with the smallest R2 linear-regression coefficient of 0.98 when radii were varied from 1–10 µm and for fiber separations ranging from 110 to 300 µm. The resulting deformation equations are summarized in Table 1. The most significant departure from the deformation produced by a cosine-squared stress distribution is seen in the dependence on the cell radius. For major-axis deformations, there was no apparent trend in the radius exponent over the range of fiber separations tested. The average value of 2.60 ± 0.05 is significantly greater than the purely quadratic dependence seen with the cosine-squared approximation. In contrast, for minor-axis deformations the radius exponent increased systematically with increasing fiber separation. For all separations the minor-axis exponents are significantly smaller than the quadratic dependency of the cosine-squared approximation. It is interesting that the simulations reveal a slight dependence of the major-axis deformation on the Poisson’s ratio. This occurs whether or not multiple internal reflections are allowed to contribute to the stress distribution and can modify the major-axis deformation by ±10%, depending on the optical fiber separation. Therefore, remaining consistent with Guck et al. [1,2], we have assumed a Poisson’s ratio of 0.5 throughout. It is not possible to directly compare the values of the A and B coefficients, since these have different units due to the variation in the exponents. The deformation equations of Table 1, in conjunction with appropriate ray-tracing simulations needed to obtain σavg, now provide a means of extracting the cellular stiffness from measurements of cellular deformation.
Table 1.
Summary of Empirical Deformation Equations for Major, ur(0), and Minor, ur(90), Axes, Determined for Several Fiber Separationsa
| Fiber Separation (µm) | ur(0) = | ur(90) = |
|---|---|---|
| 110 | 3100σavg(Eh)−1(1 + ν)0.20ρ2.61 | −1.0 × 10⁻⁴σavg(Eh)−1(1 + ν)1ρ1.32 |
| 150 | 1900σavg(Eh)−1(1 + ν)−0.29ρ2.58 | −1.3 × 10⁻³σavg(Eh)−1(1 + ν)1ρ1.52 |
| 200 | 2600σavg(Eh)−1(1 + ν)−0.03ρ2.65 | −3.4 × 10⁻³σavg(Eh)−1(1 + ν)1ρ1.62 |
| 250 | 1700σavg(Eh)−1(1 + ν)−0.27ρ2.62 | −4.8 × 10⁻³σavg(Eh)−1(1 + ν)1ρ1.65 |
| 300 | 400σavg(Eh)−1(1 + ν)−0.30ρ2.50 | −6.0 × 10⁻³σavg(Eh)−1(1 + ν)1ρ1.67 |
In all cases quantities are provided in MKS units.
4. Materials and Methods
A. Polystyrene Sphere Suspensions
A suspension of 7.8 µm diameter polystyrene spheres (Bangs Labs, Fishers, Indiana) was prepared at ~2 × 10⁵ spheres per mL in deionized (DI) water. The number density was verified with a hemocytometer. We found it helpful to add a small amount of Triton X100 and 25% D2O to better match the density of the sphere (1.05 g/ml) and to more evenly distribute the spheres throughout the microcapillary tube.
B. RBC Suspensions
An osmotic shock buffer (100 mM NaCl, 5 mM KCl, 3 mM CaCl2, 2 mM MgCl2, 20 mM HEPES acid, 25 mM dextrose, 0.1 mM adenine, and 0.01 mM inosine in 500 mL DI water) was used to swell RBCs to a spherical shape. Approximately 3 µL of blood was suspended in 400 µL nanopure water, 600 µL osmotic shock buffer, 50 µL BSA, and 5 µL heparin. RBCs were used and discarded within 3 h of preparation.
C. Osteogenic Cell Culture
The 2T3 osteoblast-like and MLO-Y4 osteocyte-like cell lines were provided by Jack Yee of the osteoporosis research group at Creighton University [17,18]. 2T3 cells were propagated in α-MEM medium supplemented with 10% fetal bovine serum (FBS), 5000 units/mL penicillin-streptomycin (Invitrogen, Carlsbad, California), and incubated at 37 °C and 5% CO2. MLO-Y4 cells were similarly propagated, except the growth medium contained 5% FBS and 5% fetal calf serum (FCS), and the cells were grown on collagen-coated dishes. Two to three days before the experiment, the cells were plated on 60 mm plastic dishes and allowed to reach confluency. On the day of the experiment, the cells were trypsinized and suspended in Tyrodes imaging buffer supplemented with 0.5% bovine serum albumin (BSA) and 5 mM glucose at a density of 105 cells/mL. The cells were used and discarded within 3 h of preparation.
D. Optical Stretcher Configuration
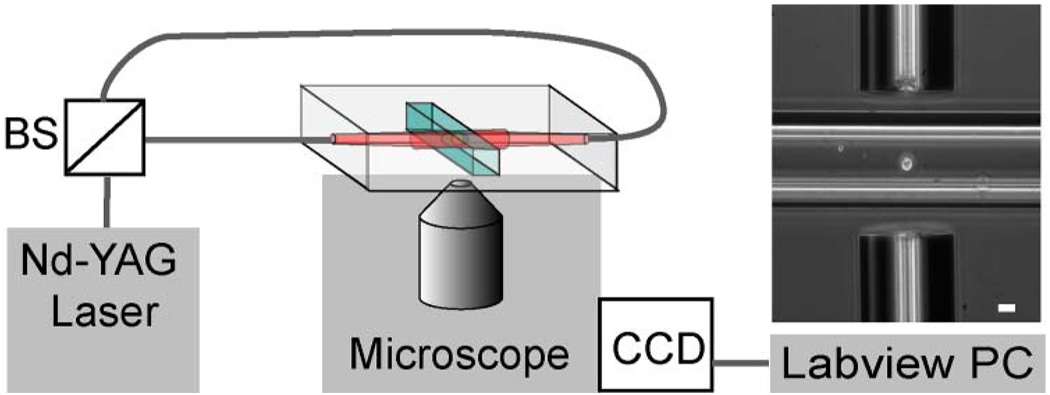
A diagram of the apparatus is shown in Fig. 3. Light from a Nd–YAG laser (IPG Photonics, Oxford, Massachusetts) emitting at 1064 nm was coupled into two optical fibers with a mode field diameter of 4.8 µm. These laser fibers were aligned end to end, collinear, and separated by a distance ranging from 150 to 300 µm. A square microcapillary tube (50 µm ID, VitroCom Inc., Mountain Lakes, New Jersey) was centered between the optical fibers, and placed at the focus of a Zeiss Axiovert 25CFL microscope with a Basler A201 CCD camera. A 10X Ph1 A-plan Zeiss objective was used for alignment and measurement with a resolution of 780 nm/pixel. For observation of optical stretching, the magnification was increased by using either a 40X U PLAN S-APO Olympus objective, resulting in a resolution of 216 nm/pixel or a 63X Ph2 Achroplan Zeiss objective and 4× magnification adjuster, resulting in a resolution of 47.9 nm/pixel. Control of all equipment was orchestrated using LabView, which also stored images with all acquisition parameters, such as time of acquisition and laser power.
Fig. 3.
(Color online) Layout of the near-infrared optical stretcher. Nd-YAG laser light is fiber-optic coupled into two single mode fibers by a 50:50 beam splitter (BS). The image shows an osteoblast-like cell that is trapped in the stretcher. The fiber separation is 150 µm, and the scale bar is 20 µm.
E. Escape Force Calibration
A sphere suspension was injected into a polyethylene delivery tube attached to the microcapillary chamber. The spheres were guided to the trapping region by gravity flow. Once a sphere was trapped, the flow speed was gradually increased while imaging at 20 frames per s until the sphere escaped from the trap and left the field of view.
Acquired image frames were analyzed using a Lab-View analysis program developed with the IMAQ libraries. The position of the sphere was manually identified in each frame, and the escape speed was determined by the slope of the best-fit line to the position data. This speed was used to calculate the viscous drag force on the sphere using Stokes’ law,
| (11) |
where ρ is the radius of the sphere, η is the viscosity of the medium, υ is the escape speed. For this study, ρ = 7.8 µm and η = 1 cP (for water at 20 °C). These escape forces were determined for several fiber separations. The experimental conditions for each trial were used as the basis for a RO simulation to determine the theoretical radial escape force. Briefly, several calculations were done to determine the optical pressure distribution [Eq. (1)] on a sphere displaced up to 10 µm radially from equilibrium at a fixed interval. For each calculation, the net radial force acting on the sphere was calculated by numerically integrating the optical pressure over the surface of the sphere:
| (12) |
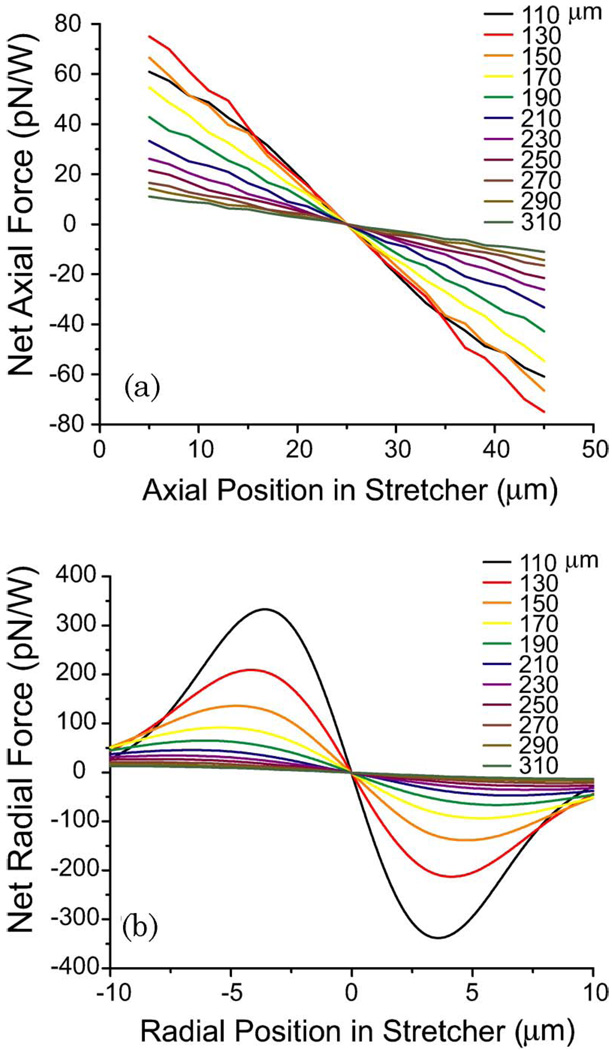
The axial restoring force was similarly calculated by integrating the component of the force directed along the fiber axis. An example of the computed restoring forces for 7.8 µm diameter polystyrene spheres in stretchers with varying fiber separation is shown in Fig. 4. The slope of the lines near equilibrium provides the effective trap stiffness, and the maximum radial trapping force is the expected escape force. The experimentally measured values were plotted against the theoretical values to determine the degree of correlation.
Fig. 4.
(Color online) (a) Axial and (b) radial trapping forces exerted on a 7.8 µm diameter polystyrene sphere calculated for fiber separations ranging from 110–310 µm. For these simulations, the center of the stretcher is held fixed (at an axial position of 25 µm and a radial position of 0 µm) in the center of a glass capillary tube.
F. Optical Manipulation and Calculation of Cellular Stiffness
Prepared cell suspensions were injected into the capillary tube as described for polystyrene spheres and similarly guided into the stretching region. Once trapped, images were taken over a sequence of laser powers (typically 50 to 750 mW per fiber) to induce stretching. At least 15 images were taken at each laser power, allowing 1 s between images to permit cell deformation to approach equilibrium while minimizing time in the stretching region to avoid unnecessary laser heating.
Images of stretched cells were analyzed using LabView. The intensity profile along a line drawn through the center of the cell on the beam axis (major axis, 0°), as well as perpendicular to this axis (minor axis, 90°), showed characteristic minima. The location of the first minimum was taken to be the edge of the cell. These measurements were calibrated for each objective by performing the same analysis on polystyrene spheres with known diameters similar to that of the cells. The length of the cell was plotted against laser power and a best-fit line was used to estimate the radius of the untrapped cell. This radius was used along with other system parameters to calculate the pressure exerted on the cell surface using the RO model for each data point.
The index of refraction of 2T3 or MLO-Y4 cells has not been measured, but was assumed to be the same as RBCs and other eukaryotic cells that have been described in the literature, ranging from 1.36–1.40 [4,5,19–22]. Simulations, conducted for cells 6–14 µm in diameter, indicate that the average pressure exerted on the cell increases linearly with increasing index mismatch between the cell and the surrounding medium. The average pressure increased 2.3-fold as the index of the cell, n, was varied from 1.36 to 1.40. For the simulations used in this study, we assumed n = 1.38. Therefore, the actual pressure may differ from the true value by as much as 40%, depending on the exact index of refraction of the cell.
Cell deformation was plotted against the average pressure for the major and minor axes. The slope of the best-fit line to the major-axis deformation was used to calculate Eh, as described in Section 3.
5. Results
A. Escape Force Calibration
When a trapped dielectric sphere is displaced from its equilibrium position in the stretcher, it experiences a restoring force. For axial displacements, the RO model reveals that the magnitude of the restoring force increases linearly with displacement, similar to a Hookean spring [Fig. 4(a)]. The slopes of the force-displacement curves near equilibrium indicate that the effective axial spring constant for the stretcher decreases as the separation of the optical fibers increases. For a 7.8 µm diameter polystyrene sphere, the optical stiffness of the trap decreases from 4.0 to 0.5 × 10⁻⁶ N/m · W as the fiber separation is increased from 110 to 310 µm. For radial displacements, the restoring force is stronger due to the increased intensity gradient along the axis perpendicular to the optical fibers [Fig. 4(b)]. While the force-displacement curves are clearly not Hookean along this axis, the slope of the force-displacement curves near equilibrium can still be used to estimate the radial spring constant of the stretcher. For these simulations, the optical stiffness decreases from 73 × 10−6 N/m · W with increasing fiber separation. Since the radial restoring force exhibits a local maximum, it is possible to determine this value by trapping polystyrene spheres and measuring the drag force needed to remove the sphere from the stretcher. By doing this for several fiber separations, we were able to directly test the predictive capabilities of the RO model.
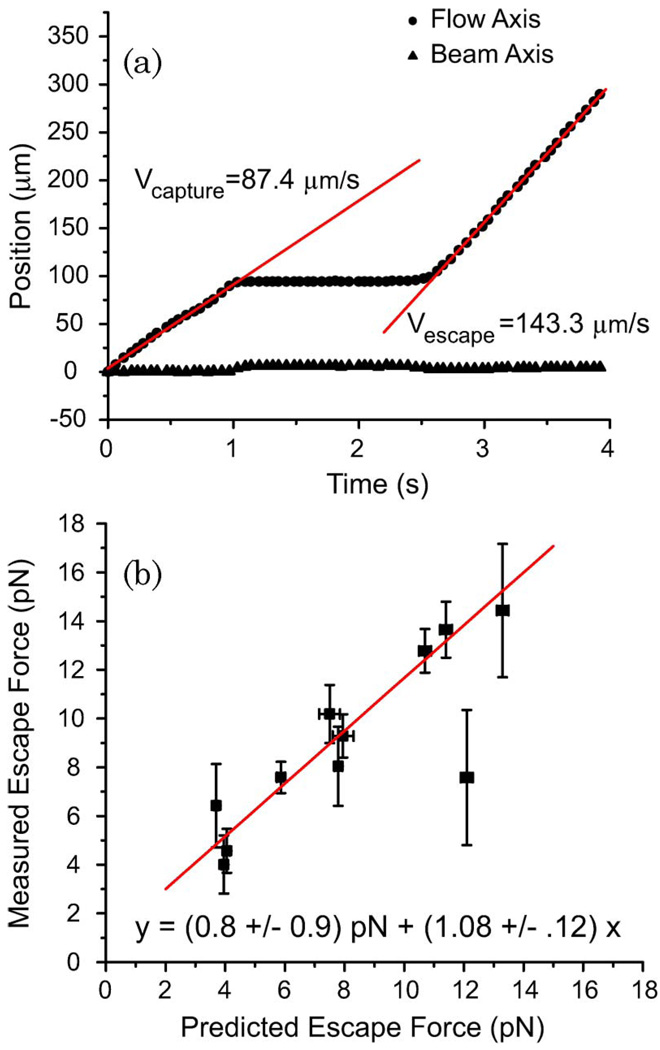
A typical capture-escape data set is shown in Fig. 5(a). After the polystyrene sphere was captured, the flow velocity was gradually increased until the drag force was sufficient to remove the sphere from the stretcher. There was little displacement of the sphere perpendicular to the flow axis, so the slope of the sphere position versus time along the flow axis was used to calculate the escape speed. For each experiment, numerical simulations such as those shown in Fig. 4(b) were performed to determine the predicted escape force. A comparison of experimental measurements and RO simulations for several fiber separations and a variety of laser powers is shown in Fig. 5(b). The best-fit line to all of the data has a slope of 1.08 ± .12, demonstrating that the RO model correctly predicts the integrated force profile on spheres trapped in the stretcher. While it is not possible to accurately measure the angular pressure distribution, this nevertheless provides sufficient validation of the model for application to cellular elasticity measurements.
Fig. 5.
(Color online) Measurement of the escape force for polystyrene spheres trapped in the optical stretcher. (a) Plot of the sphere position versus time as the sphere is trapped, held, and then pulled out by the viscous drag of fluid flow. The slopes of the lines give the speed of the sphere. (b) Comparison of the theoretical and experimentally determined escape forces required to pull a 7.8 µm polystyrene sphere from the optical stretcher. Fiber separations of 200 and 250 µm and several laser powers were used. Error bars represent the standard error for experiments conducted under similar conditions. The equation of the best-fit line is shown.
B. Cell Stiffness Measurements
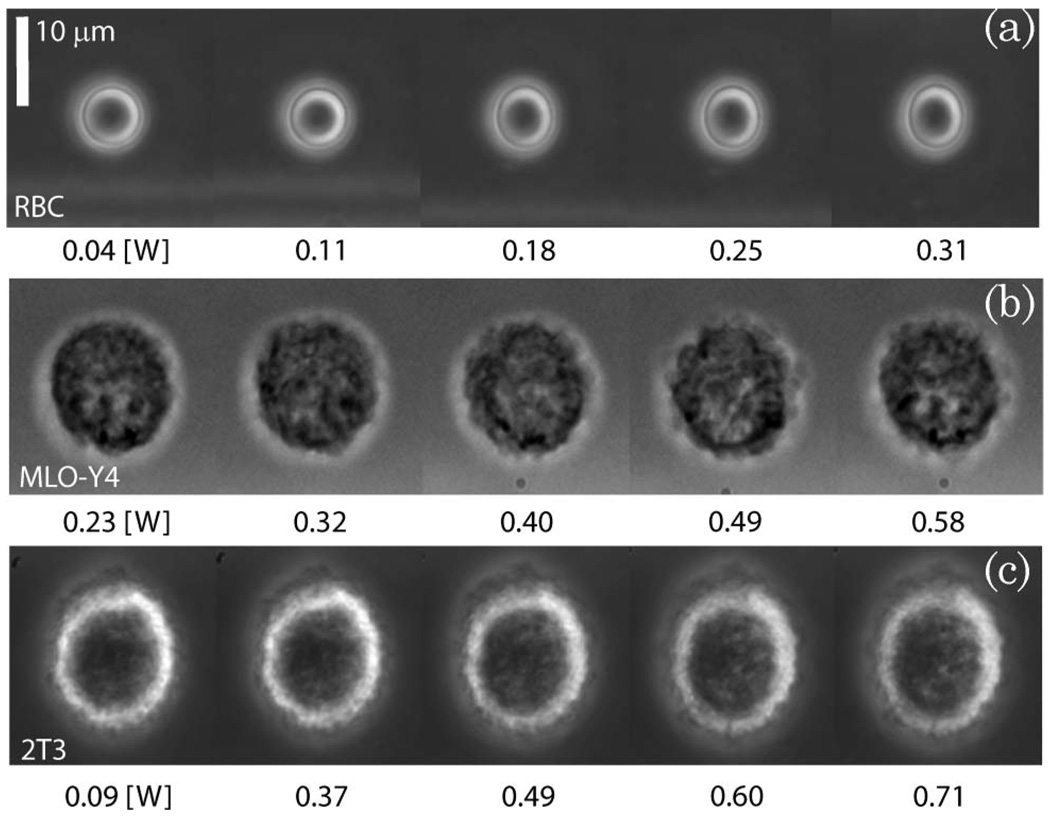
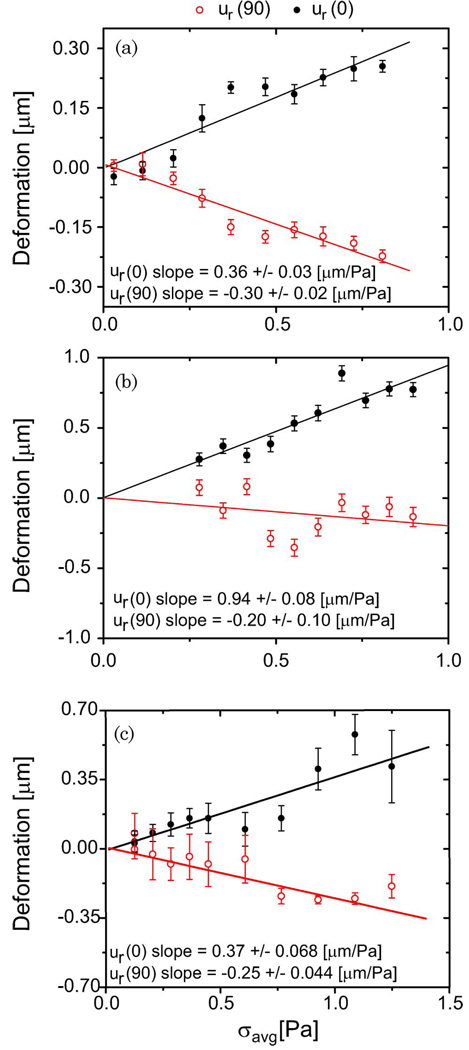
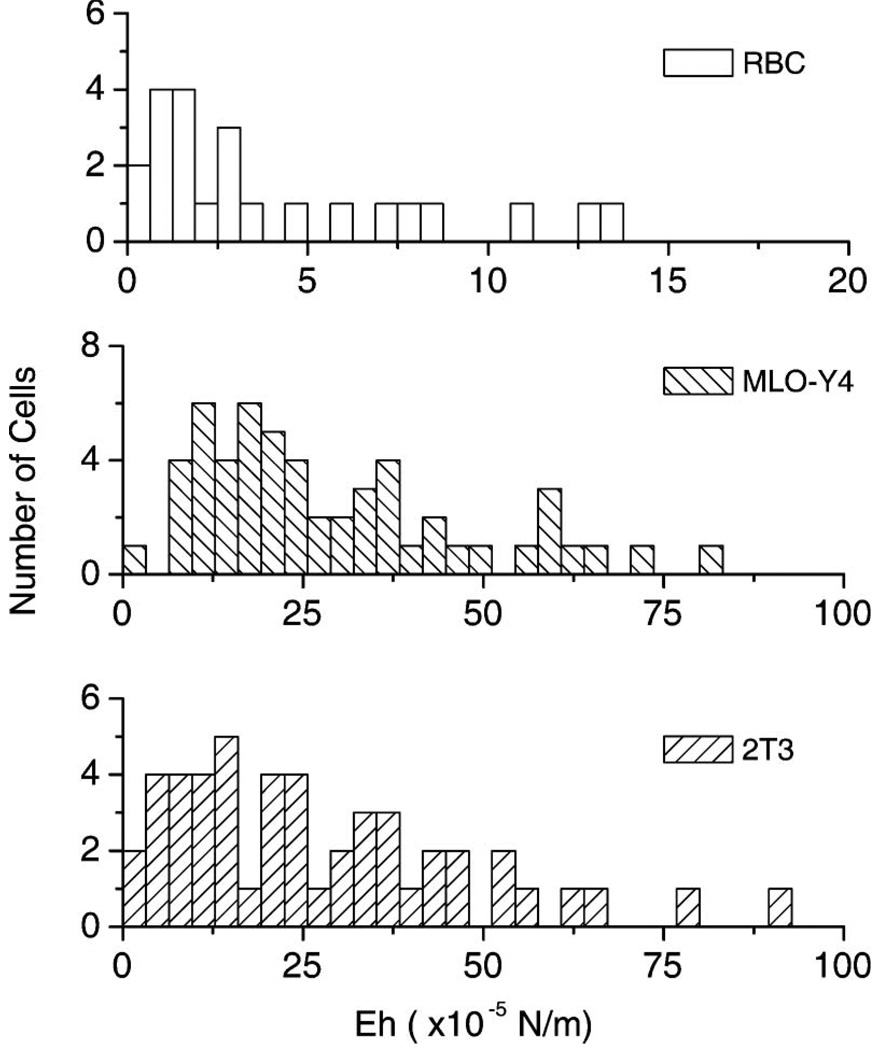
Typical examples of RBC, 2T3, and MLO-Y4 deformations are shown in Fig. 6. These individual cells were analyzed using the technique described in Section 4, and the deformation versus stress curves are shown in Fig. 7. The fiber separation varied from 150–175 µm for these examples. While both 2T3 and RBC cells stretch at a similar rate as the optical pressure is increased, the RBC is more elastic since it has a substantially smaller radius. Analysis of the RBC data shown in Figs. 6(a) and 7(a) with the RO model revealed Eh = 5.0 ± 0.1 × 10⁻⁵ N/m for this 6.2 µm diameter cell. The same analysis conducted with the cosine-squared approximation [Eq. (3)] gave a significantly smaller value of Eh = 2.95± 0.07 × 10⁻⁵ N/m, as expected from Fig. 2 for these values of cell radius and fiber separation. In contrast, the MLO-Y4 and 2T3 osteogenic cells were substantially stiffer. Figures 6(b) and 7(b) show a more significant deformation with optical pressure for the osteocyte-like cell. But the 14.3 µm diameter MLO-Y4 is also significantly larger than the RBC. Consequently, its measured stiffness of 26 ± 3 × 10⁻⁵ N/m (using the RO model) exceeds that of the RBC by more than a factor of 5.2. Once again the cosine-squared approximation led to a significantly smaller value of 17 ± 2 × 10⁻⁵ N/m. Finally, the 2T3 cell shown in Figs. 6(c) and 7(c) is the stiffest of the three. The RO model led to a value of 46 ± 4 × 10⁻⁵ N/m for Eh for this 15.1 µm diameter cell, while the cosine-squared approximation resulted in a lower estimate of 27 ± 3 × 10⁻⁵ N/m. A similar analysis was repeated for many cells. Figure 8 shows a histogram of single-cell stiffness values obtained from optical stretcher measurements for each cell type. There was no significant difference in the elasticity of the two osteogenic cell lines. Taken together, the mean stiffness of the osteogenic cells was 29 × 10−5 N/m, approximately 5.4 times greater than the RBC value of 5.4 × 10⁻⁵ N/m. The same data yield smaller stiffnesses of 22 × 10−5 N/m and 3.0 × 10⁻⁵ N/m for 2T3 and RBC cells, respectively, if the cosine-squared approximation is used.
Fig. 6.
Examples of (a) RBC, (b) MLO-Y4, and (c) 2T3 deformation during optical stretching. The laser stretcher is oriented vertically relative to these images, and the laser power is shown below each image. The 10 µm scalebar applies to all image panels.
Fig. 7.
(Color online) Sample (a) RBC, (b) MLO-Y4, and (c) 2T3 major-axis (closed symbols) and minor-axis (open symbols) deformations measured in response to optical stretching. The data-points and errorbars report the average and standard deviation of at least 15 single-cell measurements made at each laser power. The stress was calculated from the RO model simulation of the experiment. The cell stiffness is inversely proportional to the slopes of the best-fit lines.
Fig. 8.
Summary of single-cell RBC, MLO-Y4, and 2T3 elasticity measurements. While there is variance in each population, osteogenic cells appear to be about 5.4 times stiffer than RBCs.
6. Discussion
The optical stretcher is a novel optical force tool that can measure the elasticity of individual, living cells. We have used a hybrid ray-optics and continuum mechanics approach to evaluate the assumptions made in previous work and to attempt to account for the increased optical stress due to internal reflections that occur within the cell. Initially, Guck et al. [1,2] assumed that the optical stress had a cosine-squared angular dependence on the surface of a spherical cell. Our analysis indicates that this can be a valid approximation to the RO stress distribution if the fiber separation is carefully chosen according to the cell radius (Fig. 2). But this approximation also does not account for beam focusing and internal reflections that will occur within the cell. As first described by Stephenson [9] and most recently pointed out by Bareil et al. [13], internal reflections lead to regions of high optical pressure in the same way that water vapor produces a rainbow at characteristic angular positions in the sky. The inclusion of internal reflections significantly alters and reduces the range of fiber separations that would need to be selected. To avoid systematic errors incurred by the use of this approximation, we have shown that the exact RO stress distribution can be used in the numerical solution of Euler–Lagrange equations to determine the equations of deformation.
While it is not yet possible to measure the spatial distribution of optical stress on the surface of a cell with high spatial resolution, the excellent agreement between the predicted and measured average forces lends support to the exact RO model. Nevertheless, it is also important to recognize that the living cell is not a uniform isotropic sphere, as our modeling has assumed. In particular, the localized pressure spikes shown in Fig. 1 will be more distributed because of diffraction and scattering by organelles. Still, localization of the optical pressure should be properly considered.
Ananthakrishnan et al. [6] developed a finite-element model of the eukaryotic cell consisting of an actin cortex, an interior network of microtubule and intermediate filaments, and an elastic nucleus. Applying the model to cellular deformation data, they found that the outer actin cortical shell was the principal determinant of the cellular response to optical stretching. The stress distribution that was employed in that analysis was much more localized than that originally described by Guck et al. [1,2]. They found that data obtained from NIH 3T3 and BALB-3T3 fibroblasts required analytical expressions of the stress distribution of σ(θ) = σ0 cosn θ, with n in the range of 14–24, while smaller, transformed fibroblasts were best described with n in the range of 4–14. The RO model with multiple internal reflections similarly produces a stress distribution that is less broad and more localized than the cosine-squared approximation.
Recently, Xu et al. [23] compared the optical stress distribution on a homogeneous sphere as calculated by the rigorous Generalized Lorenz–Mie Theory (GLMT) and Geometrical Optics (GO). Their GO calculation is similar to the RO model employed here, and the comparison is particularly relevant since they considered the case of a 20 µm diameter cell, similar to that of the osteogenic cells that we have measured. While the GLMT is clearly the more rigorous electromagnetic solution, GO well-approximates both the magnitude and angular dependence of the optical stress distribution for this biologically relevant case. The most notable differences in the optical stress distributions occur in the rapidly varying interference structure predicted by the GMLT, the underestimation of the stress by GO in the shadow region (near θ = 90°), and the improved angular distribution and reduction in magnitude of the pressure spikes seen in the GO solution. While it would be interesting to see if the improvements realized in the GLMT theory would translate to improved elasticity measurements in biological cells, again, these improvements may be offset by the added complexity of the numerical GLMT solution and the fact that biological cells are not perfect, homogeneous, isotropic spheres.
It is interesting to consider the distribution of values for the single-cell elasticity measurements summarized in Fig. 8. All three cell types show similar distributions, though osteogenic cells are, on average, 5.4 times stiffer than RBCs. Most cells are tightly clustered about a mean value, but the distribution has a tail with some cells several times stiffer than the mean. Given the small number of outlier cells, it is not clear whether these may be measurement artifacts, or if some cells are truly much stiffer than average. At this point, we have not attempted to filter the data according to the viscoelastic response as has been described recently by Lincoln et al. [5], but it is encouraging that RBC elasticity measurements presented here are similar to other reports [2,6].
While the optical stretcher has several advantages relative to alternative techniques, laser-induced heating during optical stretching can present a significant problem for relatively stiff cells. Considering only the absorption of the 1064 nm laser light by water, we found laser-induced heating can cause temperature increases of 8–15 °C/W for fiber separations ranging from 310–110 µm, respectively [24]. This is in good agreement with measurements of optical heating by ourselves and others [25]. Given the stiffness of cells with an actin cortex, it is difficult to avoid transiently heating the cell by less than 10 °C when using 1064 nm light. While it is possible for cellular elasticity to change during the measurement process because of this temperature increase, by minimizing the trapping time and stretching at the lowest possible laser powers we have attempted to avoid artifacts of laser-induced heating. For the measurements summarized in Fig. 8, the cell was in the optical stretcher for approximately 30 s, long enough to trap and acquire images while holding the cell at a series of increasing laser powers for a 1 s duration. Cellular deformation also appeared to increase linearly with applied laser power, as expected. In future studies, laser heating could be further minimized by using laser light sources with wavelengths near 800 nm that are minimally absorbed by water [24].
Another limitation of the optical stretcher method is the fact that the optical modeling requires knowledge of the index of refraction of the cell, a quantity that is not easily measured and can change with the health of the cell [21]. Cell index of refraction has a strong effect on the optical pressure produced by the beam. For this initial study, a literature-supported value of 1.38 was used for comparing RBC and osteogenic cells. In the future, phase sensitive techniques such as quantitative phase microscopy, holographic microscopy, or tomographic phase microscopy should be used to verify the index of refraction of individual cells [22,26].
Despite these limitations, biomechanical measurements with the optical stretcher have been successfully used to distinguish different cell types [27] and promise to offer insight into disease progression at the level of the single cell [28,29]. Here, for the first time to the best of our knowledge, we have measured the stiffness of the 2T3 osteoblast-like and the MLO-Y4 osteocyte-like cells. Future studies combining confocal imaging and optical stretching will examine other osteogenic cells (including osteoclasts) to determine the extent to which cellular biomechanics contributes to the ability of a single cell to produce a biochemical response with changes in mechanical load. This is of critical importance in elucidating the mechanisms underlying bone diseases such as osteoporosis.
Acknowledgments
This study was supported by revenue from the Nebraska Tobacco Settlement awarded to Creighton University by the State of Nebraska, and grant number P20 RR16469 from the National Center for Research Resources (NCRR), a component of the National Institutes of Health (NIH).
Footnotes
OCIS codes: 170.4520, 170.1530.
References
- 1.Guck J, Ananthakrishnan R, Moon TJ, Cunningham CC, Kas J. Optical deformability of soft biological dielectrics. Phys. Rev. Lett. 2000;84:5451–5454. doi: 10.1103/PhysRevLett.84.5451. [DOI] [PubMed] [Google Scholar]
- 2.Guck J, Ananthakrishnan R, Mahmood H, Moon TJ, Cunningham CC, Kas J. The optical stretcher: a novel laser tool to micromanipulate cells. Biophys. J. 2001;81:767–784. doi: 10.1016/S0006-3495(01)75740-2. [DOI] [PMC free article] [PubMed] [Google Scholar]
- 3.Van Vliet KJ, Bao G, Suresh S. The biomechanics tool-box: experimental approaches for living cells and biomolecules. Acta Mater. 2003;51:5881–5905. [Google Scholar]
- 4.Guck J, Schinkinger S, Lincoln B, Wottawah F, Ebert S, Romeyke M, Lenz D, Erickson HM, Ananthakrishnan R, Mitchell D, Kas J, Ulvick S, Bilby C. Optical deformability as an inherent cell marker for testing malignant transformation and metastatic competence. Biophys. J. 2005;88:3689–3698. doi: 10.1529/biophysj.104.045476. [DOI] [PMC free article] [PubMed] [Google Scholar]
- 5.Lincoln B, Wottawah F, Schinkinger S, Ebert S, Guck J. High-throughput rheological measurements with an optical stretcher. Methods Cell Biol. 2007;83:397–423. doi: 10.1016/S0091-679X(07)83017-2. [DOI] [PubMed] [Google Scholar]
- 6.Ananthakrishnan R, Guck J, Wottawah F, Schinkinger S, Lincoln B, Romeyke M, Moon T, Kas J. Quantifying the contribution of actin networks to the elastic strength of fibroblasts. J. Theor. Biol. 2006;242:502–516. doi: 10.1016/j.jtbi.2006.03.021. [DOI] [PubMed] [Google Scholar]
- 7.Roosen G. A theoretical and experimental study of the stable equilibrium positions of spheres levitated by two horizontal laser beams. Opt. Commun. 1977;21:189–194. [Google Scholar]
- 8.Constable A, Kim J, Mervis J, Zarinetchi F, Prentiss M. Demonstration of a fiberoptic light-force trap. Opt. Lett. 1993;18:1867–1869. doi: 10.1364/ol.18.001867. [DOI] [PubMed] [Google Scholar]
- 9.Stephenson JR. Masters thesis. Creighton University; 2002. Computational modeling of the optical stretcher: an evaluation of the stretching force and trap stability for cubic and spherical objects. [Google Scholar]
- 10.Yariv A, Yariv A. Optical Electronics in Modern Communications. Oxford University; 1997. [Google Scholar]
- 11.Stephenson JR. Size- and geometry-dependent trapping efficiency of the optical stretcher. presented at the March Meeting of the American Physics Society; 23 April 2002; Albuquerque, New Mexico. [Google Scholar]
- 12.Greenler R. Rainbows, Halos, and Glories. Cambridge University; 1980. [Google Scholar]
- 13.Bareil PB, Sheng YL, Chiou A. Local stress distribution on the surface of a spherical cell in an optical stretcher. Opt. Express. 2006;14:12503–12509. doi: 10.1364/oe.14.012503. [DOI] [PubMed] [Google Scholar]
- 14.Ekpenyong A. Masters thesis. Creighton University; 2008. Hybrid ray optics and continuum mechanics modeling of cell deformation in the optical stretcher. [DOI] [PMC free article] [PubMed] [Google Scholar]
- 15.Press WH. Numerical Recipes in C: The Art of Scientific Computing. Cambridge University; 1992. [Google Scholar]
- 16.Yu JT, Chen JY, Lin ZF, Xu L, Wang PN, Gu M. Surface stress on the erythrocyte under laser irradiation with finite-difference time-domain calculation. J Biomed. Opt. 2005;10 doi: 10.1117/1.2136847. 064013. [DOI] [PubMed] [Google Scholar]
- 17.Ghosh-Choudhury N, Windle JJ, Koop BA, Harris MA, Guerrero DL, Wozney JM, Mundy GR, Harris SE. Immortalized murine osteoblasts derived from BMP 2-T-antigen expressing transgenic mice. Endocrinology. 1996;137:331–339. doi: 10.1210/endo.137.1.8536632. [DOI] [PubMed] [Google Scholar]
- 18.Bonewald LF. Establishment and characterization of an osteocyte-like cell line, MLO-Y4. J. Bone Miner. Met. 1999;17:61–65. doi: 10.1007/s007740050066. [DOI] [PubMed] [Google Scholar]
- 19.Franze K, Grosche J, Skatchkov SN, Schinkinger S, Foja C, Schild D, Uckermann O, Travis K, Reichenbach A, Guck J. Muller cells are living optical fibers in the vertebrate retina. Proc. Natl. Acad. Sci. U. S. A. 2007;104:8287–8292. doi: 10.1073/pnas.0611180104. [DOI] [PMC free article] [PubMed] [Google Scholar]
- 20.Lincoln B, Erickson HM, Schinkinger S, Wottawah F, Mitchell D, Ulvick S, Bilby C, Guck J. Deformability-based flow cytometry. Cytometry A. 2004;59:203–209. doi: 10.1002/cyto.a.20050. [DOI] [PubMed] [Google Scholar]
- 21.Park Y, Diez-Silva M, Popescu G, Lykotrafitis G, Choi W, Feld MS, Suresh S. Refractive index maps and membrane dynamics of human red blood cells parasitized by Plasmodium falciparum. Proc. Natl. Acad. Sci. U. S. A. 2008;105:13730–13735. doi: 10.1073/pnas.0806100105. [DOI] [PMC free article] [PubMed] [Google Scholar]
- 22.Choi W, Fang-Yen C, Badizadegan K, Oh S, Lue N, Dasari RR, Feld MS. Tomographic phase microscopy. Nat. Methods. 2007;4:717–719. doi: 10.1038/nmeth1078. [DOI] [PubMed] [Google Scholar]
- 23.Xu F, Lock JA, Gouesbet G, Tropea C. Optical stress on the surface of a particle: homogeneous sphere. Phys. Rev. A. 2009;79 053808. [Google Scholar]
- 24.Huff J. Masters thesis. Creighton University; 2005. Laser induced heating in the optical stretcher. [Google Scholar]
- 25.Ebert S, Travis K, Lincoln B, Guck J. Fluorescence ratio thermometry in a microfluidic dual-beam laser trap. Opt. Express. 2007;15:15493–15499. doi: 10.1364/oe.15.015493. [DOI] [PubMed] [Google Scholar]
- 26.Popescu G, Park Y, Choi W, Dasari RR, Feld MS, Badizadegan K. Imaging red blood cell dynamics by quantitative phase microscopy. Blood Cells Mol. Dis. 2008;41:10–16. doi: 10.1016/j.bcmd.2008.01.010. [DOI] [PMC free article] [PubMed] [Google Scholar]
- 27.Guck J, Schinkinger S, Lincoln B, Wottawah F, Ebert S, Romeyke M, Lenz D, Erickson HM, Ananthakrishnan R, Mitchell D, Kas J, Ulvick S, Bilby C. Optical deformability as an inherent cell marker for testing malignant transformation and metastatic competence. Biophys. J. 2005;88:3689–3698. doi: 10.1529/biophysj.104.045476. [DOI] [PMC free article] [PubMed] [Google Scholar]
- 28.Rosenbluth MJ, Lam WA, Fletcher DA. Analyzing cell mechanics in hematologic diseases with microfluidic biophysical flow cytometry. Lab. Chip. 2008;8:1062–1070. doi: 10.1039/b802931h. [DOI] [PMC free article] [PubMed] [Google Scholar]
- 29.Suresh S, Spatz J, Mills JP, Micoulet A, Dao M, Lim CT, Beil M, Seufferlein T. Connections between single-cell biomechanics and human disease states: gastrointestinal cancer and malaria. Acta Biomater. 2005;1:15–30. doi: 10.1016/j.actbio.2004.09.001. [DOI] [PubMed] [Google Scholar]


