

Abstract
The M2 proton channel from the influenza A virus is a small protein with a single transmembrane helix that associates to form a tetramer in vivo. This protein forms proton-selective ion channels, which are the target of the drug amantadine. Here, we propose a mechanism for the pH-dependent association, and amantadine binding of M2, based on studies of a peptide representing the M2 transmembrane segment in dodecylphosphocholine micelles. Using analytical ultracentrifugation, we find that the sedimentation curves for the peptide depend on its concentration in the micellar phase. The data are well-described by a monomer–tetramer equilibrium, and the binding of amantadine shifts the monomer–tetramer equilibrium toward tetrameric species. Both tetramerization and the binding of amantadine lead to increases in the magnitude of the ellipticity at 223 nm in the circular dichroism spectrum of the peptide. The tetramerization and binding of amantadine are more favorable at elevated pH, with a pKa that is assigned to a His side chain, the only ionizable residue within the transmembrane helix. Our results, interpreted quantitatively in terms of a reversible monomer and tetramer protonation equilibrium model, suggest that amantadine competes with protons for binding to the deprotonated tetramer, thereby stabilizing the tetramer in a slightly altered conformation. This model accounts for the observed inhibition of proton flux by amantadine. Additionally, our measurements suggest that the M2 tetramer is substantially protonated at neutral pH and that both singly and doubly protonated states could be involved in M2’s proton conduction at more acidic pHs.
M2 from the influenza A virus is a 97-residue protein that forms highly selective proton channels, which are essential for infectivity. After the entry of the virus into the cell, during virus uncoating in endosomes, M2 permits protons to enter the virion interior, and this acidification weakens the interactions of the matrix protein (M1) with the ribonucleoprotein core (1). The active form of the channel has been demonstrated to be a tetramer (2). The four monomers have a single transmembrane helix, with a His residue that appears to be essential to the ion conduction mechanism. Recently, we proposed a model for the three-dimensional structure of the transmembrane region of M2, based on the channel-forming properties of an extensive set of mutations, using Fourier analysis to obtain helix orientations and crossing (3). The predicted structure consists of a bundle of four α-helices arranged with approximate 4-fold symmetry around a central channel, which spans the transmembrane region of the protein. This model agrees reasonably well with spectroscopic data (4–6), with cysteine cross-linking studies (7), and with two independently proposed structures based on molecular dynamics calculations (8, 9). Our model also provides a rationale for the proton selectivity of the channel; the tetramer defines a continuous, water-filled pore interrupted at only one position, His37, which may act as a proton shuttle similar to that of carbonic anhydrase (10). A considerable body of evidence shows that His37 is indeed essential for the proton selectivity of M2 (11, 12).
The proton channel activity of most strains is inhibited by the drug amantadine, although resistant strains with mutations within the M2 transmembrane helix have been isolated (3, 13–15). These mutations map to one face of the helix where the channel lumen is most likely formed. Molecular modeling (3) suggests that the luminal space between Leu26 and His37 is complementary in its shape, hydrophobicity, and polarity to that of an amantadine molecule. Thus, binding of this drug is expected to block proton channel activity (12) by displacing water molecules that are essential for proton conduction (see ref 9). Amantadine inhibits M2 with very slow on- and off-rates (16) with a second-order rate constant between 150 and 1000 M−1 s−1 for different subtypes of virus and dissociates at a rate that is too slow to be experimentally measured.

The mechanism of proton conduction by the M2 channel in oocytes (11, 14, 17) or mammalian cells (18, 19) has been interpreted to involve protonation of His37 within the transmembrane portion of the channel. The channel is most active at low pH, but it is unclear whether there is a large conformational change in the protein induced at low pH. Recent cross-linking studies of M2 (7) showed that cysteine side chains substituted at positions 40, 42, and 43 change their reactivity toward disulfide formation as the pH is lowered from 7.4 to 5.2, indicative of a possible conformational change following the protonation of His37. Amantadine inhibition also exhibits a pH dependence, with the drug binding most tightly at neutral pH or higher (16). Because M2 is not active at elevated pH, it was thus concluded that amantadine binds to a “closed state” of the channel.
To further address the pH dependence of the M2 protein, we have studied a 25-residue synthetic peptide (M2TM)1 spanning its transmembrane sequence, which has previously been shown to form proton channels in planar bilayers (4, 20) (SSDPLVVAASIIGILHLILWILDRL-amide). In previous work, we demonstrated that this peptide formed tetrameric aggregates in dodecylphosphocholine (DPC) micelles at pH 7.5 (21). Here, using analytical ultracentrifugation, circular dichroism (CD), fluorescence spectroscopy, and 1H NMR in DPC micelles, we investigate the pH dependence of the monomer–tetramer equilibrium for M2TM, and its binding to amantadine.
MATERIALS AND METHODS
Preparation of Peptide Samples
M2TM peptide (residues 22–46, C-terminally amidated) was synthesized and purified as described previously (21). The identity of the purified M2TM was confirmed by matrix-assisted laser desorption/ionization mass spectrometry.
Samples of M2TM in DPC (Avanti Polar Lipids) micelles were prepared by dissolving the desired amount of peptide in methanol in a glass vial and removing the organic solvent under a stream of nitrogen to create a film of material on the glass. After the film had been held overnight under high vacuum, a DPC solution in the appropriate buffer was added, and the samples were vigorously vortexed until they became clear. Typically, the addition of amantadine to the samples was made by first adding amantadine free base in a trifluoroethanol solution to a glass vial and then allowing the solvent to evaporate from the vial before adding the peptide/DPC solution and vortexing. In the case of analytical ultracentrifugation and CD-monitored amantadine binding kinetics, the drug was incorporated into the samples by addition of 1% (v/v) 0.1 M amantadine in 0.1 M HCl. Controls were prepared to certify that the addition of amantadine and/or HCl did not disturb either the pH or the solvent density match.
Analytical Ultracentrifugation
Sedimentation equilibrium experiments were performed at 25 °C on peptide solubilized in DPC micelles using a Beckman XL-I analytical ultracentrifuge (22). To eliminate the contribution of the DPC to the buoyant molecular weight of the peptide–DPC complex, experiments were carried out at a solvent density adjusted to equal that of the DPC (21, 23, 24). Density adjustment was carried out by centrifugation of 20 mM DPC in buffer [50 mM Tris-HC1 (pH 7.5) and 0.1 M NaCl] containing different percentages of deuterium oxide (D2O). Density match occurs for buffer containing 52.5% D2O (solvent density ρ = 1.0594 as measured in a Paar densitometer). The peptide monomer molecular mass and partial specific volume were calculated using the program Sedinterp (25) and corrected for partial deuteration (52.5%) of the amide nitrogens, amines, alcohols, and guanidinium groups. Values calculated for M2TM were 2745.15 Da and 0.7907 cm3/g. The partial specific volume of amantadine is 0.918 cm3/g (26). Data were obtained and analyzed by nonlinear least-squares curve fitting as previously described (21).
Circular Dichroism
CD measurements were taken using an Aviv 62A DS circular dichroism spectrometer at 25 °C. In the experiments in which the influence of pH was studied, M2TM/DPC samples were prepared in water and then diluted 2-fold with buffer. Final concentrations were 0.1 M NaCl and 50 mM buffers with compositions that were appropriate for the desired pH values: pH 3, glycine; pH 4.1 and 5.1, acetate; pH 5.6, 6.0, 6.3, 6.5, and 6.7, MES; and pH 7.3, 8.0, and 8.9, Tris. Peptide concentrations were determined by UV absorbance at 280 nm, and CD spectra were recorded as previously described (21). The pH dependence experiments were carried out using 0.2 mm path length cells. The ellipticity ratio θ223/θ209 (r) was used as a measure of tetramer content by assuming an additive contribution of spectra from each component. That is, any single spectrum [θ(λ)] from a presumed mixture of different species was expressed as
where [monomer], [tetramer], and [amtetramer] denote the molar concentrations of the noted species and the θ(λ) values are the corresponding molar ellipticities at wavelength λ. Note that the protonated and unprotonated species are assumed to have equal ellipticities. r has the advantage of being invariant to small differences in concentrations between individual samples. For fitting model parameters to the experimental data (as in Figures 4, 6, and 7), this ratio was expressed as a function of known peptide, detergent, and amantadine concentrations and pH using iterative root-finding algorithms in MLAB and Igor Pro to solve the equations for the coupled equilibria described in the Results (Scheme 2). Details of our procedures are available as Supporting Information. Amantadine was assumed to be partitioned between aqueous and detergent phases with a dimensionless partition coefficient. On the basis of its high aqueous pKa (10.5), we also assume the drug to be entirely in its monoprotonated state. The peptide (which is insoluble in buffer) is assumed to be partitioned entirely into the detergent phase. Because the equilibria involve detergent-bound species, all molar concentrations (except [H+]) are divided by the detergent molarity. Consequently, the tetramerization constants are in mole fraction (MF) units.
Figure 4.

Peptide to detergent ratio dependence of tetramerization equilibrium at pH 8 with 50 μM peptide. (A) Ratio of the measured CD ellipticity at 223 nm to that at 209 nm (r). White circles are without amantadine, and black circles are with a constant 1/10 amantadine/detergent mole fraction. Lines are calculated from the equilibrium dissociation model by globally fitting data (with and without amantadine) at 10 different peptide/detergent ratios with a fixed pH of 8.0 and a peptide concentration of 50 μM (this figure), at 10 different pH’s (one point at pH 8.9 without amantadine was omitted from the fit to avoid its undue influence on pK values) with a fixed 1/100 peptide/detergent mole ratio (see Figure 7), and with 10 different amantadine concentrations (see Figure 6) at pH 8.0 and a peptide/detergent ratio of 1/400. Fits were obtained by fixing the monomer pKa to 6.77 (determined by NMR) and fixing pKa(tet)2 to 5.7 (estimated from electrophysiology data). Molar ellipticity parameters were fit using the pH-dependent data in this figure, and the other parameters were determined by global fitting of all data sets. Details of the procedure are available as Supporting Information: pKa(mon) = 6.77, pKd = 6.92, pKa(tet)1 = 6.4 ± 0.7, pKa(tet)2 = 5.7, pKd(Aman) = 5.8 ± 0.1, and AmanPartCoeff = 233 ± 30. (B) Calculated species distribution for panel A equilibria with no amantadine detergent. (C) Calculated species distribution for panel A equilibria with a 1/10 mole fraction of amantadine detergent. Species not indicated in these panels were computed to be at negligible levels.
Figure 6.

Titration of M2TM with amantadine, monitored by the ratio of θ223 to θ209 (r). The peptide concentration was 50 μM; the DPC concentration was 20 mM, and the buffer was 50 mM Tris-HCl (pH 8) and 0.1 M NaCl. The line is calculated from parameters obtained from global fitting as described in the legend of Figure 4.
Figure 7.

pH titration. (A) Ratio of the measured θ223 to θ209 (r). The lines were calculated from the equilibrium dissociation model using the parameters described in the legend of Figure 4. Peptide and DPC concentrations were 0.1 and 10 mM, respectively. White circles are without amantadine, and black circles are with 1 mM amantadine. (B) Calculated species distribution for panel A equilibria with no amantadine case. (C) Calculated species distribution for panel A equilibria with a 1/10 mole fraction of amantadine detergent. Species not indicated in these panels were computed to be at negligible levels.
Scheme 2.

Fluorescence
Fluorescence spectra were recorded at 25 °C using a Spex 1680 Fluorolog instrument. The excitation wavelength was 280 nm, and both (excitation and emission) bandwidths were set at 2.5 nm. Emission spectra [I(λ)], corrected for photomultiplier response, were scanned at 1 nm/s, and a baseline was recorded and subtracted after each spectrum. The cell path lengths were 5 mm × 5 mm. The concentration of the peptide was 25 μM. From each spectrum, the emission wavelength maximum (λmax) and the first moment {λ1 = Σ[I(λ) × λ]/Σ[I(λ)]} were determined and used to characterize the average environment of the tryptophan residues.
1H NMR. Proton NMR spectra were collected on M2TM protein at 200 μM monomer in 200 mM DPC-d38 ([M2TM]/[DPC] = 1/1000) and 50 mM Na2HPO4 in D2O at 25 °C. Under these conditions, the peptide is known to exist as a monomer. Data were collected on a Varian INOVA spectrometer operating at a proton frequency of 750.13 MHz as a function of pD and corrected for the isotope effect (pD = pH + 0.4). Each spectrum is the average of 512 free induction decays of 8K complex data points and was processed with 4.0 Hz line broadening.
RESULTS
Analytical Ultracentrifugation
Previous analytical ultracentrifugation studies have demonstrated that both M2 and M2TM exist in a monomer to tetramer equilibrium (21). The equilibrium is reversible, and the population of monomers versus tetramers depends on the peptide/detergent ratio, favoring monomers at very low peptide/detergent ratios. Here, we use the same method to determine the effect of amantadine on the oligomerization and stability of M2TM. The peptide was incorporated into DPC micelles, at detergent/peptide ratios that are significantly higher than the number of DPC molecules per micelle (~65 as determined by analytical ultracentrifugation) (21). As described below, the amantadine-bound tetramer has an extinction coefficient at 280 nm that is 4% greater than that expected for four monomers, which we included in the fitting equations. Equilibrium radial concentration profiles at four different peptide concentrations are well described by a cooperative monomer–tetramer equilibrium with a dissociation constant Kd of 2 × 10⁻⁷ ± 2 × 10⁻⁸ MF3, as calculated from a global nonlinear least squares fit to the data (Figure 1A). Because the degree of association of the peptide depends only on its mole fraction in the micellar phase (χpep) and not on its molar concentration in the bulk solution, the dissociation constant (Kd) for the peptide is expressed as χmon4/χtet, in which χmon and χtet are the molar fractions of the monomer and tetramer, respectively. The addition of 0.3 mM amantadine results in a marked shift in the tetramerization curve, favoring the formation of tetramers. Under these conditions, the data are optimally fit with a monomer–tetramer equilibrium model (Figure 1B) with an approximately 25-fold lower apparent dissociation constant (Kd = 8 × 10⁻⁹ ± 1 ×10⁻⁹ MF3) than in the absence of amantadine. The calculated buoyant molecular mass for amantadine in this buffer is sufficiently small (4.16 Da) to ignore its contribution to the sedimentation of the tetramer (calculated buoyant molecular mass of 1782.5 Da).
Figure 1.

Sedimentation equilibrium A280–radius profiles of M2TM in DPC micelles at 40K rpm in the (A) absence and (B) presence of 0.3 mM amantadine. The DPC concentration in all cases was 20 mM, and M2/DPC mole ratios were (a) 1/225, (b) 1/330, (c) 1/440, and (d) 1/680. The buffer was 50 mM Tris-HCl (pH 7.5) and 0.1 M NaCl. The residuals of the fits are shown in the four upper panels. The lower panels in each case show the calculated relative contributions (y-axis) of tetramers and monomers as a function of the total peptide concentration (x-axis) over the range observed in the combined experimental data.
Fluorescence
Different models for the M2TM tetramer (3, 9, 27, 28) predict that the side chain of Trp41 lies in the helix–helix interface of the tetramer, just below the critical residue, His37. In the monomer, Trp is more likely to be exposed to water, perhaps at the detergent hydrocarbon–water interface due to the aromaticity of the indole group (29, 30). Thus, one might expect large changes in the Trp fluorescence spectrum to be associated with the formation of tetramers. To investigate this possibility, we prepared three samples with different percentages of monomers, tetramers, and amantadine-bound tetramers (as deduced from the equilibrium constants obtained from analytical ultracentrifugation experiments). One sample contained primarily monomers ([M2TM]/[DPC] = 1/2000), another a mixture of ~60% monomers and ~40% tetramers ([M2TM]/[DPC] = 1/200), and a last sample primarily amantadine-bound tetramers ([M2TM]/[DPC]/[amantadine] = 1/200/10). The pH was held constant at 8.0 in all experiments. As shown in Figure 2 and Table 1, the M2TM Trp fluorescence spectra exhibit a blue shift as the proportion of tetrameric species increases, indicating that the indole group is experiencing an increasingly hydrophobic and/or rigid environment (31).
Figure 2.
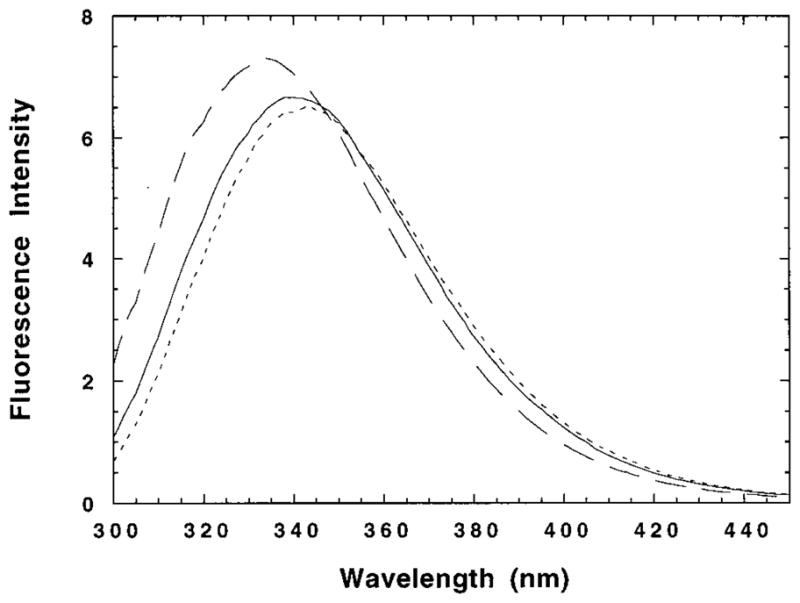
Fluorescence emission spectra of three M2TM/DPC samples: (– – –) [M2TM]/[DPC]/[amantadine] = 1/200/10, [M2TM]/[DPC] = 1/200 (—), and [M2TM]/[DPC] = 1/2000 (- - -). The M2TM concentration was 25 μM in all samples. The excitation wavelength was 280 nm. The buffer was 50 mM Tris-HCl (pH 8) and 0.1 M NaCl.
Table 1.
Tryptophan Fluorescence Emission First Moment and Maximum
| [M2TM]/[DPC]/[amantadine] | λ1 (nm) | λmax (nm) |
|---|---|---|
| 1/2000/0 | 352.4 | 343.5 |
| 1/200/0 | 350.1 | 340.5 |
| 1/200/10 | 344.4 | 334.0 |
Amantadine did not induce any shift in the emission spectrum when added to the amantadine resistant mutant (V27S)M2TM (not shown). This finding demonstrates that the blue shift following addition of amantadine to M2TM is due to a structural change in the peptide, and not to a nonspecific change in environment associated with partitioning of amantadine into the micelles. Thus, Trp fluorescence emerges as a technique that is suitable for monitoring the monomer–tetramer equilibrium of M2TM. We also observed that the Trp side chain in predominantly tetrameric M2TM samples (with or without amantadine) exhibited a more structured absorbance spectrum than in monomeric samples, also suggesting an increase in the rigidity and/or hydrophobicity of the environment surrounding the indole side chain (31) in the tetrameric conformations. Finally, the extinction coefficient at 280 nm in the amantadine-bound tetramer increases about ~4% over that of the monomer in our experimental system.
Circular Dichroism
To determine whether tetramerization and amantadine binding cause structural changes in M2TM, we obtained the CD spectra from samples containing different percentages of monomers, tetramers, and amantadine-bound tetramers (Figure 3), as deduced from the constants obtained by analytical ultracentrifugation. In these experiments, the bulk concentration of the peptide was held constant, and shifts in the monomer–tetramer equilibrium were achieved by changing the concentration of the detergent. Initially, we focussed on experiments at pH 8.0, which promotes the binding of amantadine to the full-length protein (16).
Figure 3.

CD spectra of three M2TM/DPC samples: [M2TM]/[DPC] = 1/2000 (—), [M2TM]/[DPC] = 1/100 (···), and [M2TM]/[DPC]/[amantadine] = 1/100/10 (– – –). The M2TM concentration was 50 μM in all samples. The buffer was 50 mM Tris-HCl (pH 8) and 0.1 M NaC1.
Figure 3 compares the spectra of a predominantly monomeric sample ([M2TM]/[DPC] = 1/2000), with a sample containing ~60% tetramers ([M2TM]/[DPC] = 1/100), as well as a sample with primarily amantadine-bound tetramers ([M2TM]/[DPC]/[amantadine] = 1/100/10). The formation of amantadine-free tetramers was associated with a small but significantly increased intensity of the ellipticity at 223 nm (θ223), and an accompanying reduction in the magnitude of the 209 nm band. The CD spectrum of a sample containing primarily amantadine-bound tetramers exhibited an even larger, but qualitatively similar, change in the CD spectrum. We therefore used r, the ratio of θ223 to θ209, as an empirical measure of the equilibrium composition of any given sample (see Materials and Methods).
Figure 4A illustrates the variation in the ellipticity ratio (r) as a function of peptide to detergent ratio (χpep) at pH 8. In agreement with the results from analytical ultracentrifugation, the individual curves conform well to a monomer–tetramer equilibrium, favoring the formation of tetramers as the concentration of the peptide in the micellar phase is increased (at high peptide/lipid ratios, Figure 4B). Further, the data depicted in Figure 4A, together with the data depicted in Figures 6 and 7A (see within), were subjected to a global fitting analysis, as described in Materials and Methods and later in the Results. The addition of amantadine (at a constant 1/10 amantadine/detergent mole fraction) again resulted in a shift in the curves of r versus χpep, indicating that the drug preferentially binds to the tetrameric form of the peptide (see species fractions plot in Figure 4C). Interestingly, the extrapolated value of r for the tetramer was significantly greater in the presence of amantadine than in its absence (Figure 4A). The difference was small, but quite reproducible, suggesting a subtle conformational change in the peptide upon binding of amantadine.
Figure 5A shows the CD spectrum of M2TM before and after the addition of amantadine. The binding of 1 mM amantadine occurs on the minute time scale (Figure 5C) as inferred from the time course of the change in θ223. This finding is consonant with earlier studies demonstrating that the binding of the drug occurs on a similarly slow time regime (16). The spectral changes are due to binding of the drug to M2TM, rather than a change in the micellar environment associated with its presence. This is demonstrated by the fact that the CD spectrum of the amantadine resistant mutant (V27S)M2TM does not change in the presence of the drug (Figure 5B,C).
Figure 5.

(A and B) CD spectra of a sample in 25 μM peptide in 10 mM DPC micelles in 50 mM Tris-HCl (pH 8) and 0.1 M NaCl without amantadine (—) and at equilibrium with 1 mM amantadine (– – –): (A) M2TM and (B) the (V27S)M2TM mutant. (C) Kinetics of amantadine-induced CD changes at 223 nm for M2TM (○) and (V27S)M2TM (●), in the samples described above.
Figure 6 illustrates the effect of amantadine concentration on r with [M2TM]/[DPC] = 1/400, at pH 8. With increasing amantadine concentrations, the tetrameric form is increasingly stabilized. Together, the above data on the affinity, kinetics of binding, and sensitivity to mutation of the M2TM are remarkably similar to those inferred from electrophysiological experiments with the full-length protein (16).
Figure 7A shows the pH dependence of tetramerization and amantadine binding at an M2TM/DPC molar ratio of 1/100. At low pH, the monomeric species predominates, but at higher pH, the equilibrium shifts toward tetramers with a midpoint near the expected pKa of an unperturbed His side chain. In the presence of amantadine ([amantadine]/[DPC] molar ratio of 1/10), the midpoint shifts toward lower pH, indicating that amantadine stabilizes the tetramer toward acid-induced disassembly.
NMR Measurements
Proton NMR was used to characterize further the pH dependence of the association of M2TM. In particular, as described below, global fitting of the CD data suggested that the dissociation of the tetramer is driven by protonation of M2TM monomers. To confirm this analysis and to experimentally determine the pKa of monomeric M2TM, we conducted an NMR titration of M2TM in D2O under conditions where it was greater than 90% monomeric across the entire pH range that was examined. Figure 8 illustrates the chemical shift of the His37 δ2 proton as a function of pH. A sigmoidal curve is observed with an associated pKa of 6.77 (corrected for the hydrogen/deuterium isotope effect). This value is close to the pKa of 6.9 (similarly estimated by NMR measurements) for an unperturbed histidine residue (His31) in unfolded T4 lysozyme (32).
Figure 8.

Proton chemical shift of the His37 δ2 proton of 200 μM M2TM in DPC-d38 micelles ([M2TM]/[DPC] = 1/1000) as a function of pH. The line is the fit to single-proton dissociation model (pKa = 6.77) assuming that the chemical shift is a linear function of the fractional degree of protonation.
A General Model for pH-Dependent Tetramerization and Amantadine Binding
We sought a simple, physically reasonable model to fully explain the pH dependence of tetramerization and amantadine binding for M2TM, with implications for the full-length protein. The simplest possible scheme to fully account for the pH dependence of the monomer–tetramer equilibrium is given in Scheme 1 in which the dissociation constants for protonation of monomers and tetramers are Ka(mon) and Ka(tet), respectively, and Kd1–Kd4 are the equilibrium constants for dissociation of the variously protonated tetramers. Because the curves in Figure 4 are highly cooperative, Scheme 1 models the association as fully cooperative (i.e., assumes that the concentrations of intermediate dimeric and trimeric forms are minimal).
Scheme 1.
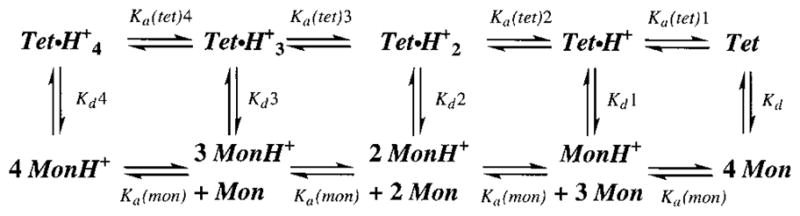
Because M2TM tetramers are unstable at low pH, the tetrameric dissociation constants (Kdn) must become increasingly larger as the protonation state of the tetramer increases. Further, simple electrostatic considerations as well as molecular dynamics simulations show that the tetramers become quite unstable when more than two His residues are protonated in the tetramer (9). We therefore make the simplifying assumption that the species Tet·H+3 and Tet·H+4 are not significantly populated. Thus, it is unnecessary to specify Ka(tet)3, Ka(tet)4, Kd4, and Kd3 under our experimental conditions. There remain six constants. Two of these can be determined from the appropriate thermodynamic cycles, leaving only four parameters, Ka(mon), Ka(tet)1, Ka(tet)2, and Kd, that are needed to fit the experimental data. One of these [Ka(mon)] can be estimated from NMR spectra over a range of pH values. With this parameter, we can also estimate Kd values from the analytical ultracentrifugation by correcting the nominal concentrations to those of the unprotonated monomer existing at pH 7.5 where the analytical ultracentrifugation experiments were carried out (see the Supporting Information).
Amantadine has a very high pKa (~10.5), so it is likely to bind in the protonated state throughout our range of pH values. Amantadine shows a steadily increasing ability to enhance the tetramerization of M2TM as the pH is increased to 8.0 (Figure 7), suggesting that it has the highest affinity for the unprotonated state. Thus, we initially modeled the binding of amantadine according to Scheme 2, which describes the various equilibria between significantly populated species in the micellar phase.
To adequately model the amantadine binding data, which were collected at various total DPC concentrations, it was also necessary to consider its partition coefficient to account for its equilibration between the aqueous and the micellar phase. The effect of this parameter can also be seen in the biphasic response of the peptide/detergent ratio in Figure 4, in which the peptide concentration was fixed and the detergent concentration was varied, while simultaneously maintaining the amantadine/detergent mole ratio at 1/10. As the concentration of the detergent decreases, the peptide/detergent ratio increases, initially leading to an increased extent of tetramer formation. However, at the lowest detergent concentrations, the amantadine is not fully associated with the micelles, resulting in a decrease in the extent of tetramer formation.
An analysis of the sensitivity of the fit to small changes in the parameters indicated that all of the parameters were well defined with the exception of Ka(tet)2. It was not possible to allow both Ka(tet)1 and Ka(tet)2 to vary simultaneously because of extensive covariation. However, model calculations indicated that the data were well described by the model only if (1) the value of pKa(tet)1 was greater than 6 and (2) Ka(tet)1 was greater than Ka(tet)2. To constrain the model parameters further, we used the results of a study (17) in which current–voltage data for heterologously expressed M2 protein were collected over a wide pH range. These data provided evidence that conductance was associated with protonation of the side chain of His37 with a pKa of 5.6–5.9, depending on voltage. We therefore re-fit the curves to the data by fixing the second pKa to a value of 5.7, allowing only the first pKa to vary in the fitting. All the data depicted in Figures 4, 6, and 7 were well described by the model, and a value of 6.4 was obtained for Ka(tet)1.
We also explored alternative schemes in which amantadine was allowed to bind to protonated states of the tetramer. However, such schemes led to an erosion in the fit of the curves to the data, as well as giving physically unreasonable parameters.
DISCUSSION
An important conclusion of this work is that the M2TM peptide contains all the necessary determinants to specify a functional transmembrane tetramer. The peptide specifically and reversibly associates into tetramers, which bind amantadine in a pH-dependent manner similar to that of the full-length protein. Further, the relatively slow rates of association of amantadine with the channel are similar to the slow rates of channel inhibition measured for the full-length protein. Together with previous work showing that this peptide forms proton-selective channels (20), the current study establishes M2TM as a minimal model for the study of proton channel proteins.
A somewhat surprising result of this work is the finding that the first pKa of the tetramer (6.4) is near the unperturbed pKa of a His side chain, and higher than might be expected in the low dielectric of a packed protein interior. Electrophysiological studies (11, 12, 14, 16–19, 33, 34) all show current increases upon acidification, indicating a His pKa of <6. Nevertheless, although not discussed previously, studies of amantadine inhibition of M2 conductance (16) also have provided evidence for a pKa of >5.5. The inhibition constant for amantadine interaction with the channel increases approximately 2-fold between pH 6.2 and 7.5. If the first pKa of His37 in the tetramer were 5.5, then one would expect little change between pH 6.2 and 7.5. Instead, this observation indicates a higher pKa. Thus, we conclude that the first protonation of a single His in the tetramer is relatively facile, and occurs near neutral pH. Interestingly, a near-normal pKa for the first protonation of His37 is also reasonably consistent with predicted structures, in which the His side chains lie proximal to a solvent-filled cavity. A protonated His may be further stabilized by interacting with a deprotonated His from a neighboring helix. Finally, the presence of four His side chains in the tetramer will increase the apparent pKa by a statistical factor of log 4. Thus, the relatively unperturbed first pKa of His37 for the M2 tetramer is consistent with the function of the protein in stabilizing a proton in an otherwise low dielectric environment. This also indirectly supports computer models of the tetramer that show a solvent-filled cavity near the center of the protein (3, 8, 9, 35, 36).
Our data also strongly suggest that amantadine binds to the neutral state of the channel, in agreement with electrophysiological studies indicating that the drug binds to a (high-pH) inactive, “closed” form of M2 (16). In our model, the active, “open” state of the channel would correspond to the protonated states of the tetramer (see below), which are only marginally stable in the M2TM/DPC model system, but should be stable in vivo. The degree of conformational change between the “active”, protonated forms of the tetramer and the “closed”, neutral form may not be directly assessed from our data. However, the binding of amantadine to the neutral tetramer gives rise to a small shift in its CD spectrum, showing an increase in the negative ellipticity at 223 nm relative to that at 209 nm. This finding demonstrates that there is some change in the conformation or environment of the structure, as proposed previously (12). However, it is difficult to interpret these results in terms of a unique structural model, because the Trp side chain and peptide bonds show CD effects in this region of the spectrum. Previously, it was proposed that the θ222/θ208 ratio could be used to distinguish coiled coils from straight helices (37, 38), but subsequent carefully controlled experiments (39) and theoretical studies (40) have shown this not to be generally applicable.
Presumably, amantadine would bind with its charged ammonium group hydrogen-bonded to the neutral imidazole side chains of His37, and its hydrophobic, bicyclic structure displacing the water molecules from the center of the channel (12). Along these lines, amantadine may be considered as a hydrophobically stabilized proton surrogate that competes directly with protons for binding to the electron lone pairs of His37.
Our data, together with extensive electrophysiological data on the M2 proton channel, can be combined to suggest a possible two-proton mechanism for conductance of protons (Scheme 3). The M2 channel in vivo conducts protons between the low-pH endosomal compartment and the higher-pH virus interior. We consider here a model where the rate of flow of protons down their concentration gradient (Hout and Hin are the proton concentrations outside and inside, respectively) will depend on the rates of protonation and deprotonation of the different possible tetramers (Tet, Tet·H+, and Tet·H+2). The k’s are rate constants for the forward and backward reactions as written. Note that the forward direction is always toward the “in” side. With the rate constants defined as functions of transmembrane voltage and the experimentally determined protonation constants (see the Appendix for details), this model serves to define the current as a function of solution pH, the experimentally defined protonation and dissociation constants, and voltage.
Scheme 3.

Of interest here is the pH dependence of amantadine-sensitive currents measured by various investigators for the M2 protein expressed in Xenopus oocytes and in transfected mammalian cell lines. It has frequently been reported (11, 14, 17, 34) that M2 proton conductance is activated by lowered pH. Moreover, molecular dynamics simulations (8, 9) have suggested that this activation might involve a structural change induced by protonation of one or more transmembrane histidines. In Figure 9, the kinetic mechanism shown above, together with the tetramer pKa’s inferred from our work, was used to fit one particular set of published data on the pH dependence of M2 conductance which encompasses a sufficiently wide pH range to exhibit a sigmoidal pH dependence (17). Note that we assume M2 to be a nondissociable tetramer, as in vivo it is stabilized by disulfide bonds and noncovalent interactions. As shown in Figure 9, the “activation” of the channel coincides with a simple protonation step. No structural activation step is necessary to fit the data, although we cannot rule out such an event. Near pH 7, our CD data would predict (see the Figure 9 inset) that a significant fraction (roughly 20%) of M2 tetramers contains one protonated histidine. Perhaps it is the increasing fraction of this species that underlies the activation process ascribed to M2 exposed to (exterior) acidic conditions. However, because the monoprotonated fraction would be expected to saturate near pH 5.5, proton conduction observed at lower pH’s must be associated with the second protonation of a His side chain within the tetramer. What is yet to be determined is to what extent the mono- and diprotonated states differ in their rates of proton conduction (determined by their relative on- and off-rates for protonation). Recent molecular dynamics simulations (41) suggest that the doubly protonated tetramer is stable (the fully protonated tetramer is not) and has a more open structure than the singly protonated one, implying a higher intrinsic conductivity. More detailed investigations of current–voltage curves over a wide pH range will be necessary to explore this possibility.
Figure 9.

Normalized chord conductance vs pH from electrophysiological measurements of M2 currents in transfected mammalian cells (●) (17). The solid line was computed by curve fitting using the conductance definition used by Chizhmakov et al. (17) and the current–voltage model described in the text for a fixed pKa(tet)1 of 6.4 and a pKa(tet)2 of 5.7. Barrier and site positions in the model (see the Appendix) were set equal to reduce the number of fitting parameters, and the site position (d2 = d1 = d3) was allowed to vary. The resulting fitted value of d1 was 0.3. Equally good fits could be obtained by fixing d2 to values between 0.2 and 0.9, allowing pKa(tet)2 to vary, yielding values between 5.1 and 5.9. The inset shows the hypothetical distribution of di- (—), mono-(···), and nonprotonated (– – –) tetramers for nondissociable (native) M2 protein based on a pKa(tet)1 of 6.4 and a pKa(tet)2 of 5.7. Current–voltage curves predicted for these pKa’s and for d1 = 0.3 at different external pH’s are shown in the Appendix.
In conclusion, M2TM has proven to be an excellent model for the full-length protein, suggesting it should be a very good target for structural studies. The definition of the associative behavior of M2TM should now allow detailed high-resolution crystallographic and NMR investigations of the structures of the tetrameric forms of the protein.
Supplementary Material
Acknowledgments
We thank Larry Pinto, Jörgen Mould, Qinfeng Zhong, and Mike Klein for many stimulating discussions and Robert Lamb for helpful comments. We also thank Paul Axelsen for use of his spectrofluorimeter.
APPENDIX
The two-site mechanism for proton conductance in the influenza A virus M2 channel (Scheme 3) can be used to derive an equation for steady state proton current through the channel. For convenience, we define the fractional concentrations of Tet, Tet·H+, and Tet·H+2 as S0, S1, and X, respectively. Because electrophysiology measurements are conventionally done with grounded external solutions, we define the current, measured with zero potential outside, as the net rate of proton transport from inside to outside. Then, with Hout and Hin, the proton concentrations outside and inside, respectively, the current per total tetramer concentration (i) can be expressed as
Note that the material balance condition S0 + S1 + X = 1 has been used to eliminate X from the equations. The k’s are rate constants for the forward and backward reactions as defined in the mechanism.
The fractional concentrations at steady state are determined by setting their time derivatives to zero:
This system of equations serves to define S0 and S1 in terms of measured pH’s and parametric rate constants. To keep a compact notation, define
Then solving the steady state equations for S0 and S1 gives, after elementary algebra
and for the current
Current–voltage curves are calculated by allowing the rate constants to be voltage-dependent. The k’s will, in general, be functions of voltage because of the two barriers and the internal site, which are spaced at fractional distances di from the ground- to voltage-clamped side through the pore.

The dependencies, in general, are
where the defined equilibrium constants K1 and K2 have been used along with the requirement of microscopic reversibility (voltage-independent ratios of inner- and outer-site reaction rates must be equal) to reduce the number of explicit parameters. For fitting of chord conductance data where current–voltage curves are not known over a wide voltage range, the electrical distances of the sites and barriers were set equal because their differences could not be uniquely defined. The graph shown below illustrates the dependence of current on voltage for the set of parameters (see the text) chosen to fit chord conductance versus pH data from Chizhmakov et al. (17), in Figure 9.

Footnotes
This work was partially supported by NIH Grant GM56423 (W.F.D. and J.D.L.). D.S. was a recipient of a postdoctoral fellowship from the Dirección General de Enseñanza Superior [Ministerio de Educación y Cultura (Spain)].
Abbreviations: CD, circular dichroism; D2O, deuterium oxide; DPC, dodecylphosphocholine; MF, mole fraction; M2TM, transmembrane segment of the influenza A M2 protein (residues 22–46); NMR, nuclear magnetic resonance; r, θ223/θ209 ellipticity ratio; χpep, peptide to detergent mole ratio.
SUPPORTING INFORMATION AVAILABLE
MLAB program, data files, and fitting results output described in this paper. This material is available free of charge via the Internet at http://pubs.acs.org.
References
- 1.Lamb RA, Holsinger LJ, Pinto LH. In: Receptor-Mediated Virus Entry into Cells. Wimmer E, editor. Cold Spring Harbor Laboratory Press; Cold Spring Harbor, NY: 1994. pp. 303–321. [Google Scholar]
- 2.Sakaguchi T, Tu Q, Pinto LH, Lamb RA. Proc Natl Acad Sci USA. 1997;94:5000–5005. doi: 10.1073/pnas.94.10.5000. [DOI] [PMC free article] [PubMed] [Google Scholar]
- 3.Pinto LH, Dieckmann GR, Gandhi CS, Shaughnessy MA, Papworth CG, Braman J, Lear JD, Lamb RA, DeGrado WF. Proc Natl Acad Sci USA. 1997;94:11301–11306. doi: 10.1073/pnas.94.21.11301. [DOI] [PMC free article] [PubMed] [Google Scholar]
- 4.Duff KC, Kelly SM, Price NC, Bradshaw JP. FEBS Lett. 1992;311:256–258. doi: 10.1016/0014-5793(92)81114-2. [DOI] [PubMed] [Google Scholar]
- 5.Duff KC, Gilchrist PJ, Saxena AM, Bradshaw JP. Virology. 1994;202:287–293. doi: 10.1006/viro.1994.1345. [DOI] [PubMed] [Google Scholar]
- 6.Kovacs FA, Cross TA. Biophys J. 1997;73:2511–2517. doi: 10.1016/S0006-3495(97)78279-1. [DOI] [PMC free article] [PubMed] [Google Scholar]
- 7.Bauer CM, Pinto LH, Cross TA, Lamb RA. Virology. 1999;254:196–209. doi: 10.1006/viro.1998.9552. [DOI] [PubMed] [Google Scholar]
- 8.Sansom MSP, Kerr ID, Smith GR, Son HS. Virology. 1997;233:163–173. doi: 10.1006/viro.1997.8578. [DOI] [PubMed] [Google Scholar]
- 9.Zhong Q, Husslein T, Moore PB, Newns DM, Pattnaik P, Klein ML. FEBS Lett. 1998;434:265–271. doi: 10.1016/s0014-5793(98)00988-0. [DOI] [PubMed] [Google Scholar]
- 10.Christianson DW, Fierke CA. Acc Chem Res. 1996;29:331–339. [Google Scholar]
- 11.Wang C, Lamb RA, Pinto LH. Biophys J. 1995;69:1363–1371. doi: 10.1016/S0006-3495(95)80003-2. [DOI] [PMC free article] [PubMed] [Google Scholar]
- 12.Gandhi CS, Shuck K, Lear JD, Dieckmann GR, DeGrado WF, Lamb RA, Pinto LH. J Biol Chem. 1999;274:5474–5482. doi: 10.1074/jbc.274.9.5474. [DOI] [PubMed] [Google Scholar]
- 13.Hay AJ, Wolstenholme AJ, Skehel JJ, Smith MH. EMBO J. 1985;4:3021–3024. doi: 10.1002/j.1460-2075.1985.tb04038.x. [DOI] [PMC free article] [PubMed] [Google Scholar]
- 14.Holsinger LJ, Nichani D, Pinto LH, Lamb RA. J Virol. 1994;68:1551–1563. doi: 10.1128/jvi.68.3.1551-1563.1994. [DOI] [PMC free article] [PubMed] [Google Scholar]
- 15.Hay AJ. Semin Virol. 1992;3:21–30. [Google Scholar]
- 16.Wang C, Takeuchi K, Pinto LH, Lamb RA. J Virol. 1993;67:5585–5594. doi: 10.1128/jvi.67.9.5585-5594.1993. [DOI] [PMC free article] [PubMed] [Google Scholar]
- 17.Chizhmakov IV, Geraghty FM, Ogden DC, Hayhurst A, Antoniou M, Hay AJ. J Physiol. 1996;494:329–336. doi: 10.1113/jphysiol.1996.sp021495. [DOI] [PMC free article] [PubMed] [Google Scholar]
- 18.Mould JA, Li HC, Dudlak CS, Lear JD, Pekosz A, Lamb RA, Pinto LH. J Biol Chem. 2000;275:8592–8599. doi: 10.1074/jbc.275.12.8592. [DOI] [PubMed] [Google Scholar]
- 19.Wang C, Lamb RA, Pinto LH. Virology. 1994;205:133–140. doi: 10.1006/viro.1994.1628. [DOI] [PubMed] [Google Scholar]
- 20.Duff KC, Ashley RH. Virology. 1992;190:485–489. doi: 10.1016/0042-6822(92)91239-q. [DOI] [PubMed] [Google Scholar]
- 21.Kochendoerfer GG, Salom D, Lear JD, Wilk-Orescan R, Kent SBH, DeGrado WF. Biochemistry. 1999;38:11905–11913. doi: 10.1021/bi990720m. [DOI] [PubMed] [Google Scholar]
- 22.Furst A. Eur Biophys J. 1997;35:307–310. [Google Scholar]
- 23.Tanford C, Reynolds JA. Biochim Biophys Acta. 1976;457:133–170. doi: 10.1016/0304-4157(76)90009-5. [DOI] [PubMed] [Google Scholar]
- 24.Fleming KG, Ackerman AL, Engelman DM. J Mol Biol. 1997;272:266–275. doi: 10.1006/jmbi.1997.1236. [DOI] [PubMed] [Google Scholar]
- 25.Laue T, Shaw BD, Ridgeway TM, Pelletier SL. In: Analytical Ultracentrifugation in Biochemistry and Polymer Science. Harding SE, Rowe AJ, Horton JC, editors. The Royal Society of Chemistry; Cambridge, U.K: 1992. pp. 90–125. [Google Scholar]
- 26.Hoiland H. In: Thermodynamic data for Biochemistry and Biotechnology. Hinz H-J, editor. Springer-Verlag; Berlin: 1986. pp. 17–44. [Google Scholar]
- 27.Dieckmann GR, DeGrado WF. Curr Opin Struct Biol. 1997;7:486–494. doi: 10.1016/s0959-440x(97)80111-x. [DOI] [PubMed] [Google Scholar]
- 28.Forrest LR, DeGrado WF, Dieckmann GR, Sansom MS. Folding Des. 1998;3:443–448. doi: 10.1016/S1359-0278(98)00061-3. [DOI] [PubMed] [Google Scholar]
- 29.Yau WM, Wimley WC, Gawrisch K, White SH. Biochemistry. 1998;37:14713–14718. doi: 10.1021/bi980809c. [DOI] [PubMed] [Google Scholar]
- 30.Jacobs RE, White SH. Biochemistry. 1989;28:3421–3437. doi: 10.1021/bi00434a042. [DOI] [PubMed] [Google Scholar]
- 31.Lakowicz JR. Principles of Fluorescence Spectroscopy. Plenum Press; New York: 1983. [Google Scholar]
- 32.Anderson DE, Becktel WJ, Dahlquist FW. Biochemistry. 1990;29:2403–2408. doi: 10.1021/bi00461a025. [DOI] [PubMed] [Google Scholar]
- 33.Pinto LH, Holsinger LJ, Lamb RA. Cell. 1992;69:517–528. doi: 10.1016/0092-8674(92)90452-i. [DOI] [PubMed] [Google Scholar]
- 34.Shimbo K, Brassard DL, Lamb RA, Pinto LH. Biophys J. 1996;70:1336–1346. doi: 10.1016/S0006-3495(96)79690-X. [DOI] [PMC free article] [PubMed] [Google Scholar]
- 35.Forrest LR, Kukol A, Arkin IT, Tieleman DP, Sansom MS. Biophys J. 2000;78:55–69. doi: 10.1016/s0006-3495(00)76572-6. [DOI] [PMC free article] [PubMed] [Google Scholar]
- 36.Schweighofer KJ, Pohorille A. Biophys J. 2000;78:150–163. doi: 10.1016/S0006-3495(00)76581-7. [DOI] [PMC free article] [PubMed] [Google Scholar]
- 37.Zhou NE, Kay CM, Hodges RS. J Biol Chem. 1992;267:2664–2670. [PubMed] [Google Scholar]
- 38.Greenfield NJ, Hitchcock-DeGregori SE. Protein Sci. 1993;2:1263–1273. doi: 10.1002/pro.5560020809. [DOI] [PMC free article] [PubMed] [Google Scholar]
- 39.Holtzer ME, Holtzer A. Biopolymers. 1995;36:365–379. doi: 10.1002/bip.360360310. [DOI] [PubMed] [Google Scholar]
- 40.Bode KA, Applequist J. Biopolymers. 1993;42:855–860. doi: 10.1002/(SICI)1097-0282(199712)42:7%3C855::AID-BIP10%3E3.0.CO;2-8. [DOI] [PubMed] [Google Scholar]
- 41.Zhong Q, Newns DM, Pattnaik P, Lear JD, Klein ML. FEBS Lett. 2000;473:195–198. doi: 10.1016/s0014-5793(00)01522-2. [DOI] [PubMed] [Google Scholar]
Associated Data
This section collects any data citations, data availability statements, or supplementary materials included in this article.