

Abstract
Purpose
This study determined the molecular characteristics and clinical significance of amplification of the 13q31 chromosomal region in alveolar rhabdomyosarcoma (ARMS), an aggressive pediatric cancer with frequent PAX3-FOXO1 and PAX7-FOXO1 gene fusions.
Experimental Design
The 13q31 amplicon was localized in an initial panel of ARMS cases using oligonucleotide arrays. A fluorescence in situ hybridization assay for this localized region was designed, and applied to more ARMS cases to determine the frequency and distribution of amplification. Quantitative reverse transcription-PCR assays were applied to measure gene expression. The clinical significance of copy number and expression was determined with Kaplan-Meier and Cox proportional hazard models.
Results
We localized the 13q31 amplicon to a 0.15 Mb region containing the MIR17HG gene encoding the polycistronic microRNA cluster, miR-17-92. This amplicon is present in 23% of ARMS cases with a marked preference for PAX7-FOXO1-positive cases. In tumors with 13q31 amplification, there is significantly increased expression of five of six microRNA’s within the miR-17-92 cluster (miR-17, miR-19a, miR-19b, miR-20a, and miR-92). In addition, a subset of non-amplified tumors with copy number-independent overexpression of all six microRNA’s was identified. In clinical analyses, there was a significantly worse outcome associated with increased expression of the five microRNA’s described above in 13q31-amplified cases when compared to non-amplified cases. There was also an improved outcome in 13q31-amplified cases with lower expression of these microRNA’s.
Conclusions
13q31 amplification and expression of the miR-17-92 cluster provide novel markers for identifying good and poor prognostic subsets of PAX7-FOXO1-positive ARMS.
Keywords: Rhabdomyosarcoma, amplification, translocation, microRNA, MYCN
Introduction
Rhabdomyosarcoma (RMS) is a family of soft tissue cancers of childhood that are derived from mesenchymal cells related to the skeletal muscle lineage (1). There are two major histological subtypes: embryonal (ERMS) and alveolar (ARMS). In contrast to the ERMS subtype, ARMS often originates in the extremities and is characterized by early metastasis, poor response to treatment and frequent relapse.
Cytogenetic analyses demonstrated that ARMS is genotypically distinct from ERMS and other pediatric solid tumors (1). A 2;13 chromosomal translocation is the most prevalent finding, whereas, a variant 1;13 translocation occurs in a smaller subset of ARMS cases. These translocations generate PAX3-FOXO1 and PAX7-FOXO1 fusion genes, respectively, which encode novel fusion transcription factors with oncogenic activity. Molecular genetic analyses revealed that 55%, 23% and 22% of ARMS tumors are characterized as PAX3-FOXO1-positive, PAX7-FOXO1-positive or fusion–negative, respectively (2).
Although these fusions between members of the paired box and forkhead family of transcription factors are implicated in ARMS pathogenesis, increasing evidence suggests that the fusion protein is not sufficient for tumorigenesis (3). A number of initial genome-wide screens of ARMS tumors indicated the frequent occurrence of gene amplification (4–6), a strategy for directly increasing oncogene copy number and expression. We hypothesize that these amplification events interact with the gene fusions in a collaborative model of ARMS tumorigenesis and will provide useful markers for clinical management. Recent studies from our laboratory using oligonucleotide arrays focused on the amplicons derived from the 2p24 and 12q13-q14 chromosomal regions (7). Our studies found that the 2p24 amplicon occurs preferentially in PAX3- and PAX7-FOXO1-positive ARMS cases (~20% of each) whereas the 12q13-q14 amplicon occurs preferentially in PAX3-FOXO1-positive cases (~25%). In analyses of clinical outcome, this 12q13-q14 amplicon identified a poor prognostic subset of PAX3-FOXO1-positive ARMS whereas the 2p24 amplicon was not associated with clinical outcome.
Other areas of amplification in ARMS were previously localized to chromosomal regions 1p36, 2q34-qter, 13q14, and 13q31 (5, 6). In this report, we focus on the 13q31 amplicon and analyze ARMS tumors from the Children’s Oncology Group (COG). In particular, we use oligonucleotide arrays to localize the amplified region and then identify the involved genes from corresponding genetic maps. The amplification status of numerous tumors is assessed with DNA-based assays, and then RNA-based assays are applied to correlate copy number findings with expression status of target genes in these tumors. Finally, the clinical significance of amplification and target gene expression is determined by comparing copy number and expression findings with pathologic, molecular, and clinical data.
Materials and Methods
Tumor cases
As previously described, frozen tissue samples were received from the COG Soft Tissue Sarcoma (STS) Tumor Bank (7). All samples were reviewed by pathologists affiliated with the COG STS Committee, using current criteria for diagnosing ARMS, including the presence of greater than 50% alveolar histology. Fusion status was measured by one of several RT-PCR protocols (8, 9).
Of the 123 ARMS samples in this study, 86 samples were derived from patients enrolled on Intergroup Rhabdomyosarcoma Study (IRS) Group or COG STS clinical trials. These cases were distributed among the following trials: IRS IV (n = 23), IRS V pilot (n = 3), D9501 (n = 4), D9502 (n = 2), D9602 (n = 4), D9802 (n = 10), and D9803 (n = 40). Six of the 86 patients were subsequently determined to be ineligible for these trials; two cases did not conform to the pathologic or clinical criteria for the trial, two cases did not have adequate staging, and there is no information for the remaining two cases. Since clinical data were available from these ineligible patients, they were included in the clinical correlative studies.
The various trials from which these cases are drawn have similar chemotherapy control arms with comparable outcomes. In addition, the experimental arms did not show different outcomes when compared with the control arms. Therefore there is justification for combining the study populations for outcome analysis in the present study.
DNA preparation and microarray analysis
Genomic DNA was extracted using a QIAamp DNA Mini Kit (Qiagen, Valencia, CA), in accordance with the manufacturer’s instructions. Following quantification, DNA was analyzed on Affymetrix GeneChip Human Mapping 50K XbaI arrays of the 100K Mapping Panel (Affymetrix, Santa Clara, CA), following the manufacturer’s instructions. All analyses were performed in the University of Pennsylvania’s Microarray Core Facility. To further define the minimum region of 13q31 amplification, selected samples were analyzed on Affymetrix GeneChip Human 250K StyI arrays of the 500K mapping panel. Data from the 50K and 250K oligonucleotide arrays were analyzed with Copy Number Analysis Tool (Affymetrix) and Copy Number Workflow (Partek Genomics Suite, St. Louis, MO), respectively, as previously described (7).
Fluorescence in situ hybridization (FISH)
Interphase FISH was performed on touch imprints made from snap frozen or OCT-embedded tumor samples. A BAC probe (CTD-2058L20) containing the MIR17HG gene at chromosomal region 13q31-13q32 was direct-labeled with SpectrumGreen-dUTP using the Nick Translation Kit (Abbott Molecular; Abbott Park, IL). The MIR17HG-containing probe was hybridized in combination with the LSI13 (Abbott Molecular; Abbott Park, IL) SpectrumOrange-labeled control probe specific for the RB1 gene at chromosome 13q14. A minimum of 100 interphase cells was counted for each probe with a DAPI II counterstain (Abbott Molecular; Abbott Park, IL), and amplification was defined as a test to control ratio of greater than or equal to five. Typically >10 signals were observed in amplified cells with this probe.
Quantitative RT-PCR
RNA was isolated from primary tumors using RNA STAT-60 (Tel-Test, Friendswood, TX) in accordance with manufacturer’s instructions. Fusion status was previously determined for 121 of the 123 cases, as described previously (7). RNA was available and adequate in quality for gene expression studies from 108 of the 123 cases; 79 of these 108 samples were derived from patients enrolled on IRS or COG STS clinical trials, including five ineligible cases described above. Quantitative reverse transcription (qRT)-PCR was conducted using primer-probe sets designed with Primer Express software or pre-made ABI assays (Applied Biosystems, Foster City, CA) following the manufacturer’s instructions. Amplification and analysis were performed using an ABI Prism 7900 Sequence Detector System (Applied Biosystems). When screening for the primary miRNA (pri-miRNA) transcript with a pre-made ABI assay, 18S rRNA was assayed as an internal control gene to ensure equivalent input of cDNA. In contrast, RNU48 was the corresponding control gene used to determine mature miRNA expression.
Statistical analyses
To determine statistical significance, the mean data in each of two groups were analyzed using unpaired Student’s t-tests. To determine statistical significance of a variable with more than two groups, a one-way ANOVA approach was used with Scheffe’s post-hoc test comparisons being conducted by SPSS version 12 (SPSS Science Inc). To determine statistical significance of two multi-group variables, a two-way ANOVA approach was used with Neuman-Keul’s post-hoc comparisons being conducted by SigmaStat Software version 2.033 (SPSS Science Inc.). The relationship between fusion status and amplification was examined by Fisher’s exact test with Bonferroni’s post-hoc comparisons conducted by SAS version 9.2 software (SAS Institute, Inc.). For all tests, the significance of the difference between means was accepted at the overall 0.05 level, and where appropriate, corrections were made for multiple comparisons with Bonferroni approach. To examine a relationship in expression between each member of the miRNA cluster, a Pearson’s correlation analysis was performed on the log2-transformed data and the analysis was done with SAS 9.2 software.
For survival analyses, Kaplan-Meier curves were drawn for the variable with multiple groups and the non-parametric log-rank statistic was used to assess the significance of outcome across groups. Cox proportional hazards models were further fitted to evaluate the association of interesting variables with outcomes in univariate and multivariate survival analyses. When the interaction between variables showed significance, the confidence intervals were calculated from extracting the information from the variance-covariance matrix of the full model. This way the estimation would be more accurate than that in the subset analysis (separating the data into subsets and modeling each individually).
Results
Microarray analysis of 13q31 amplicon in ARMS tumors
In a previous report, we initiated a copy number analysis of a panel of 57 ARMS tumors comprising 31 PAX3-FOXO1-positive, 9 PAX7-FOXO1-positive, 16 fusion-negative and 1 indeterminate fusion status on a 50K oligonucleotide array (7). In the current study, we are following up on a previous report from comparative genomic hybridization studies of a recurrent amplicon derived from the 13q31 chromosomal region (6). In the panel of 57 ARMS cases, we also find the presence of a recurrent 13q31 amplification event in 8 cases including, 1 PAX3-FOXO1-positive, 1 fusion-negative, and 6 PAX7-FOXO1-positive cases.
To localize the minimum common region of 13q31 amplification, we identified the 13q31 amplicon endpoints in each amplified tumor. By comparing these endpoints, we initially situated the minimum common region of amplification to a 0.55 Mb segment (Fig. 1). To further delineate the minimal common amplified region, we analyzed five selected amplified cases on higher density 250K oligonucleotide arrays. The minimum overlapping amplicon shared among these amplified cases was thereby reduced to 0.15 Mb. Comparison of this interval with the human genome map (NCBI Build 36.2) revealed that the minimal common amplified region contains two genes, MIR17HG and a peptidylprolyl isomerase pseudogene, LOC390419. Importantly, the miR-17-92 cluster of microRNA’s (miRNA’s) is located within the third intron of MIR17HG (10) and has been previously implicated in neoplastic development in both hematopoietic and epithelial malignancies (11, 12). A previous publication proposed that GPC5 is the critical target of this 13q31 amplicon and provided evidence of a compatible pro-oncogenic function in which the protein product enhanced fibroblast growth factor signaling to stimulate cell proliferation (13). However, the present mapping data clearly indicates that GPC5 is fully amplified in only a small subset of ARMS tumors with this amplicon (1 of 8 tumors) and is not contained within the minimum region of 13q31 amplification.
Figure 1. Localization of the minimal common amplified region at genomic locus 13q31.
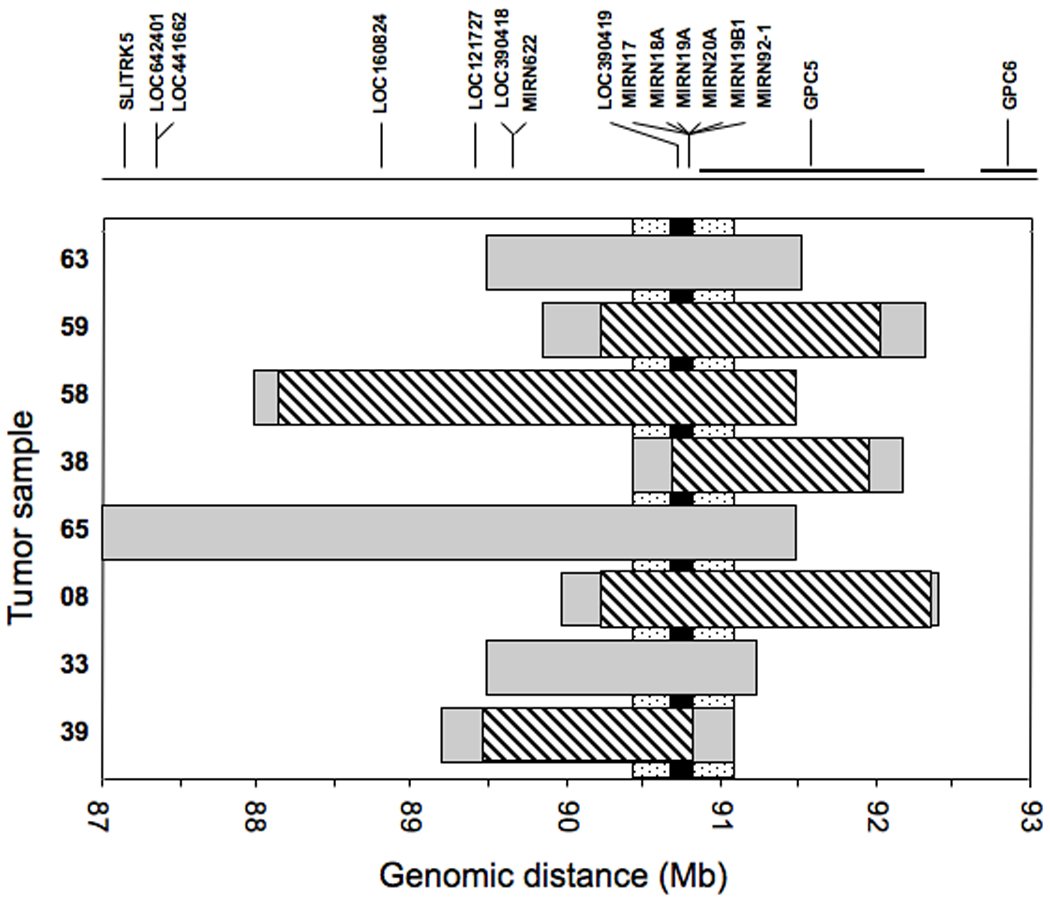
The gray rectangles indicate the extent of amplification measured in each tumor using the Affymetrix GeneChip 50K array. The stippled vertical bar indicates the minimal common area of amplification based on this initial mapping data using the 50K array. The diagonal-striped rectangles indicate the further localization of the amplicons in a selected set of tumors using the Affymetrix GeneChip 250K array. The black vertical bar indicates the final localization of the minimal common area of amplification based on this more detailed mapping analysis. At the top, the genes present in the 13q31 region are shown, based on NCBI Build 36.2 of the human genetic map, and at the bottom, a scale of the corresponding genomic position (in megabases) is shown.
FISH studies of 13q31 amplification in ARMS tumors
To extend these findings, we identified a BAC clone corresponding to the minimum common amplified region, and used this clone as a probe in conjunction with a control probe from the 13q14 region to quantify the copy number of the 13q31 chromosomal region by a FISH assay. We initially focused on the 57 cases analyzed on the copy number arrays. In agreement with the microarray results, this FISH assay found 13q31 amplification in all ARMS tumors in which a 13q31 amplicon was described above. Moreover, two additional cases with 13q31 amplification were also identified by FISH analysis. One case showed amplification in only a small subset (22%) of the cells, and thus enhanced sensitivity by FISH analysis may explain false negative array result. However, in the second case, the FISH assay detected amplification in 53% of cells, and thus the reason for the discordance between the array and FISH analyses is unknown.
We subsequently analyzed 66 additional ARMS cases of all fusion types by FISH. Collectively, we found 13q31 amplification in 28 of 123 cases (23%), including 22/33 PAX7-FOXO1 (67%), 4/50 PAX3-FOXO1 (8%) and 2/38 fusion-negative (5%) cases. Using Fisher’s exact test of significance, we found a significant association between fusion status and 13q31 amplification (p<0.0001). Moreover, the proportion of amplified cases was significantly higher in the PAX7-FOXO1 group than in the fusion-negative (p<0.0001) and PAX3-FOXO1 groups (p<0.0001). No difference was found between the fusion-negative and PAX3-FOXO1 groups (p=1.0). All p values were compared to the Bonferroni adjusted alpha level, i.e., 0.05/3 = 0.017.
Expression studies of miR-17-92 cluster in 13q31-amplified ARMS tumors
Based on the finding of one functional gene (MIR17HG) in the minimum common amplified region, we proceeded to explore the expression of the gene products in the 108 ARMS tumors with available RNA. MIR17HG encodes an extended primary transcript (pri-miRNA) encompassing 7 kb (10). As described above, the miR-17-92 cluster is located within the third intron of this gene, and a series of processing events leads to the release of six functionally mature 18–22 nucleotide miRNA's from the MIR17HG pri-miRNA. To determine if 13q31 amplification results in overexpression of the MIR17HG pri-miRNA, the abundance of this species was measured by qRT-PCR in the ARMS tumors. The results showed that the median expression of MIR17HG was increased 1.9-fold in ARMS cases with 13q31 amplification compared to that in ARMS cases without 13q31 amplification (p=0.004, Fig. 2A). As discussed in detail below, there is a subset of non-amplified cases with high expression of the pri-miRNA. However, these data demonstrate that increased genomic copy number of the MIR17HG gene is generally associated with elevated expression of the corresponding pri-miRNA in ARMS tumors.
Figure 2. miR-17-92 expression in 13q31-amplified and non-amplified ARMS tumors.
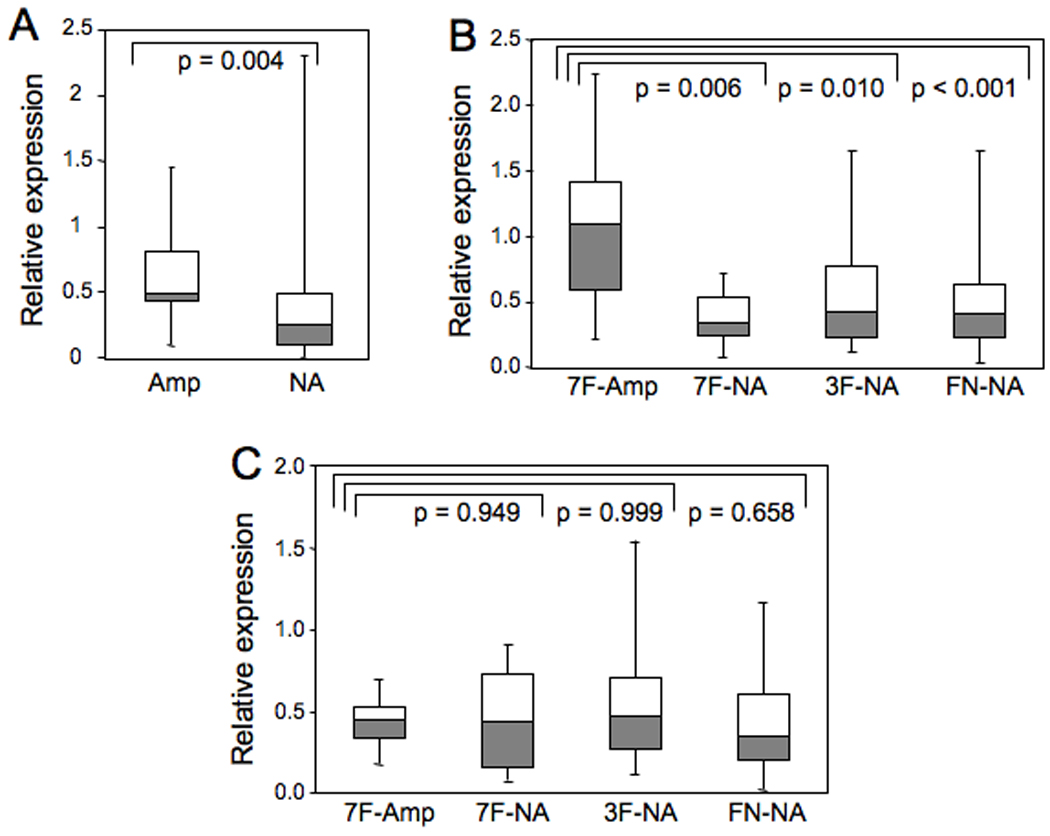
(A) Expression of MIR17HG pri-miRNA was measured by qRT-PCR in all amplified and non-amplified ARMS tumors, and normalized for 18S rRNA. The distribution of MIR17HG pri-miRNA expression is represented graphically by a Box and Whisker plot. The horizontal line dividing the box into two parts represents the median. The lower and upper edges of the boxes indicate the 25th and 75th percentiles, and line segments illustrate the lower and upper extremes, except for outliers. The t-test was used to compare expression between the two groups, and the corresponding p value is shown. (B) Expression of miR-20a was measured by qRT-PCR in the designated subsets and normalized for RNU48 expression. The one-way Anova with Scheffe post hoc test was used to compare expression among subsets, and the corresponding p-values are shown. (C) Expression of miR-18a was measured by qRT-PCR in the designated subsets and normalized for RNU48 expression. Data was analyzed as in part B. Abbreviations: 7F - PAX7-FOXO1; 3F - PAX3-FOXO1; FN - fusion-negative; Amp - amplified; NA - not amplified.
As six mature miRNA’s are excised from the MIR17HG pri-miRNA, we next assessed expression of individual mature miRNA’s in 108 ARMS tumors by qRT-PCR. For cases without 13q31 amplification, all six miRNA’s showed high correlations with regards to their expression levels; Pearson’s correlation coefficients ranged from 0.74 to 0.91 (Supplemental Table 1). This high correlation is maintained in 13q31-amplified cases for all miRNA’s except miR-18a, which showed a poor correlation with the other miRNA’s (i.e., Pearson’s correlation coefficients ranged from 0.16 to 0.47). These findings provide evidence of a central regulatory mechanism that ensures comparable expression of individual members of the miR-17-92 cluster within a tumor. This regulatory mechanism is apparently disrupted for miR-18a in 13q31-amplified tumors.
To determine if 13q31 amplification leads to elevated expression of the mature miRNA’s of the miR-17-92 cluster, we compared expression levels between amplified and non-amplified cases. We find evidence that amplification is coupled with overexpression for five of the six mature miRNA’s (miR-17, miR-19a, miR-19b, miR-20a, and miR-92a). As exemplified by miR-20a, its abundance was significantly higher in cases with 13q31 amplification than cases without amplification (p<0.001). Furthermore, miR-20a expression was significantly higher in PAX7-FOXO1-positive tumors with 13q31 amplification (n=16) than PAX7-FOXO1-positive tumors without 13q31 amplification (n=10, p=0.006) as well as non-amplified PAX3-FOXO1-positive tumors (n=42, p=0.010) and non-amplified fusion-negative ARMS tumors (n=34, p<0.001) (Fig.2B). These p values were compared to the Bonferroni adjusted alpha level, i.e., 0.05/3 = 0.017. However, it should also be noted that the 13q31-amplified PAX7-FOXO1-positive cases include a subset that does not express high miR-20a levels. Similar trends were observed in miR-17, miR-19a, miR-19b, and miR-92a (Supplemental Fig. 1). For miRNA’s overexpressed as a result of 13q31 amplification, the increased median miRNA expression in the 13q31-amplified PAX7-FOXO1-positive subset varied from 1.6- to 3.2-fold. Of note, the small number of amplified PAX3-FOXO1-positive and fusion-negative cases contributed to the lack of a statistically significant difference and relatively low confidence in the comparison of miRNA expression between amplified and non-amplified tumors in these subsets. In contrast to the first five miRNA’s, analysis of miR-18a did not reveal obvious expression differences between any amplified and non-amplified subsets (Fig. 2C).
Analysis of individual miRNA’s of the miR-17-92 cluster in ARMS tumors revealed multiple cases in which tumors without 13q31 amplification expressed high levels of these miRNA’s. We selected the median value of miRNA expression in 13q31-amplified PAX7-FOXO1-positive cases as a gauge of miR-17-92 abundance in ARMS tumors and then queried the non-amplified tumors for cases that expressed this high level for at least three of the five miRNA’s overexpressed in amplified cases. Based on these criteria, 7 of 42 (17%) non-amplified PAX3-FOXO1-positive cases, 0 of 10 (0%) non-amplified PAX7-FOXO1-positive cases, and 2 of 34 (6%) non-amplified fusion-negative ARMS cases, or an overall 9 of 86 non-amplified ARMS cases (10%) expressed high miR-17-92 levels. These findings are consistent with previous published data indicating high miR-17-92 expression in several ARMS cell lines lacking 13q31 amplicons and indicate the existence of alternative mechanisms for upregulating expression of mature miRNA’s independent of 13q31 amplification (14).
Role of MYCN amplification and overexpression
Amplification of the 2p24 chromosomal region occurs in ~20% of fusion-positive ARMS tumors and generally results in upregulation of MYCN, which encodes a transcription factor implicated in MIR17HG transcriptional control (15). Based on this information, we investigated whether miR-17-92 is induced in a MYCN-dependent manner as an alternative mechanism for upregulating this miRNA cluster in ARMS. For each of the six miRNA’s, we used a two-way ANOVA to compare 13q31-nonamplified cases with (n=5) and without (n=41) MYCN amplification/overexpression, and also to control for differences between PAX3-FOXO1- and PAX7-FOXO1-positive fusion subtypes. Though the median expression level for each miRNA in the amplified/overexpressed group was consistently higher than the level in the non-amplified group (Supplemental Fig. 2), this increase did not reach statistical significance. In a three-way ANOVA with an additional factor to control for the differences across the six miRNA’s, the comparison between 13q31-nonamplified cases with (n=5) and without (n=41) MYCN amplification/overexpression was still not significant (p = 0.14). We attribute this lack of statistical significance at least partly to the small number of MYCN-amplified/overexpressed cases available for analysis as well as to a substantial subset of non-MYCN-amplified cases that are hypothesized to overexpress these miRNA’s due to other mechanisms.
Association of 13q31 amplification and miR-17-92 expression with clinical outcome
To study an association with clinical characteristics, 13q31 amplification data were compared with pertinent clinical parameters in the 86 ARMS cases with available clinical data (18 amplified and 68 non-amplified) (Supplemental Table 2). The most notable associations were the increased occurrence of 13q31-amplified tumors in the extremities and the lower invasiveness of 13q31-amplified tumors. These associations have been previously noted in PAX7-FKHR-positive tumors (2), in which 13q31 amplification mostly occurs.
We next investigated an association with outcome data, using the Kaplan-Meier method to estimate survival distributions and the log-rank test to compare survival distributions by amplification status. The outcome was quantitatively better for amplified cases relative to non-amplified cases for both overall survival and failure-free survival (Fig. 3A-B). There was a significant difference seen in overall survival by 13q31 amplification status (p=0.013) whereas there was only a trend towards significance in failure-free survival (p=0.085). In a subsequent multivariate analysis, after adjusting for age sex, group, node status, primary site, and tumor size, 13q31 amplification status was a significant independent predictor of overall survival (p = 0.026, HR = 0.24, 95% CI: 0.07–0.87) (Table 1). A similar multivariate analysis was also highly suggestive of an independent predictive role for 13q31 amplification in failure-free survival (p = 0.06, HR = 0.4, 95% CI: 0.16–1.04).
Figure 3. Effect of 13q31 amplification on outcome of ARMS patients.
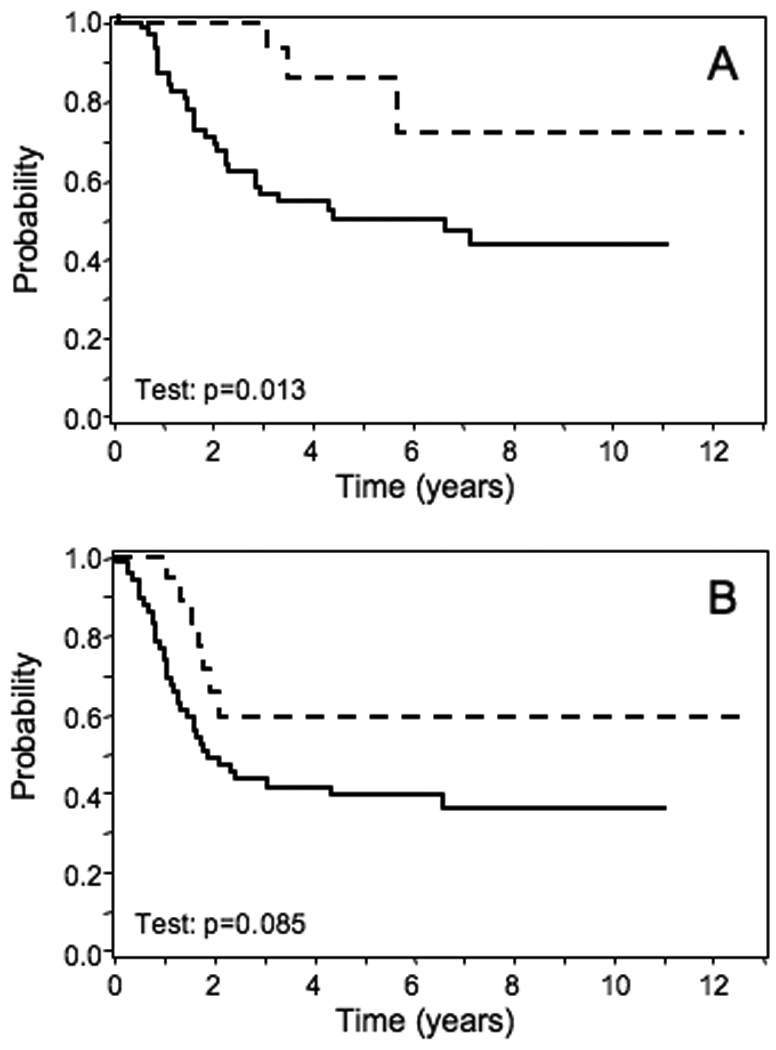
Comparison of overall (A) or failure-free (B) survival between all ARMS cases with and without 13q31 amplification. Amplified, n = 18; non-amplified, n = 68. The outcomes of amplified and non-amplified cases are indicated by dashed and solid lines, respectively.
Table 1.
Cox proportional hazards modeling to predict failure-free survival from clinical, pathologic and molecular predictors.
| Predictor | Level | Failure-Free Survival | Overall Survival | ||
|---|---|---|---|---|---|
| Hazard ratio (95% CI) |
P value | Hazard ratio (95% CI) |
P value | ||
| Age | (cont, in yr)* | 1.03 (0.96, 1.1) | 0.49 | 1.04 (0.97, 1.13) | 0.28 |
| Sex | Male | (RL)** | - | (RL) | - |
| Female | 0.47 (0.23, 0.95) | 0.034 | 0.66 (0.31, 1.4) | 0.28 | |
| Group | 1,2,3 | (RL) | - | (RL) | - |
| 4 | 3.03 (1.51, 6.08) | 0.0018 | 2.94 (1.36, 6.38) | 0.0063 | |
| Node status | 0 | (RL) | - | (RL) | - |
| 1 | 1 (0.52, 1.96) | 0.99 | 1.12 (0.53, 2.36) | 0.76 | |
| Primary site | 0 | (RL) | - | (RL) | - |
| 1 | 0.51 (0.25, 1.03) | 0.061 | 0.58 (0.26, 1.28) | 0.18 | |
| Tumor size | <=5 cm | (RL) | - | (RL) | - |
| >5 cm | 1.46 (0.7, 3.03) | 0.31 | 2.03 (0.83, 4.95) | 0.12 | |
| 13q31 | No | (RL) | - | (RL) | - |
| Amplification | Yes | 0.4 (0.16, 1.04) | 0.06 | 0.24 (0.07, 0.84) | 0.026 |
Continuous in years,
Reference level
We next analyzed the association of miRNA expression with outcome. In a panel of 79 ARMS cases with available RNA and clinical data, we used the Cox proportional hazards model to study the association of expression of each miRNA with outcome and did not find any significant associations. In the next step, we modeled the interaction effect of miRNA expression and amplification status in predicting outcomes (Table 2a). In this analysis, miR-19a was significantly interacting with 13q31 amplification status in predicting failure-free survival (but not overall survival) and three other miRNA’s (miR-17, miR-19b, and miR-92a) trended towards significance. These results indicate that there is a significant difference in failure-free survival between amplified and non-amplified cases associated with changes in expression of these miRNA’s. In addition, the hazard ratio for amplified cases was significantly greater than one for miR-17, miR-19a, miR-19b, miR-20a, and miR-92a and ranged from 3.5 for miR-92 up to 15.0 for miR-17. Therefore, in contrast to the improved outcome for amplification alone, there is a significantly worse outcome associated with high expression of these miRNA’s in amplified cases. In contrast, the hazard ratios for the non-amplified cases are close to one and are not statistically significant. This result suggests that high miR-17-92 expression is associated with a difference in outcome, but only in ARMS cases with 13q31 amplification.
Table 2.
Cox proportional hazards modeling to predict failure-free survival from miRNA expression.
| A. Before adjusting for the effects of clinical and pathologic factors (age and gender were the only confounders for which adjustments were made). | |||
|---|---|---|---|
| miRNA | Hazard ratio with 95% confidence intervals* | P value for interaction** | |
| Amplified | Non-amplified | ||
| miR-17a | 15.03 (1.62, 139.64) | 1.79 (0.59, 5.39) | 0.085 |
| miR-18a | 75.11 (0.08, 7.06 × 10⁴) | 0.62 (0.23, 1.68) | 0.18 |
| miR-19a | 5.89 (1.29, 26.88) | 0.97 (0.39, 2.4) | 0.047 |
| miR-19b | 4.84 (1.35, 17.35) | 1 (0.34, 2.93) | 0.067 |
| miR-20a | 3.9 (1.08, 14.02) | 1.18 (0.46, 3.04) | 0.15 |
| miR-92 | 3.52 (1.08, 11.4) | 0.87 (0.34, 2.23) | 0.078 |
| B. After adjusting for the effects of clinical and pathologic factors. | |||
|---|---|---|---|
| miRNA | Hazard ratio with 95% confidence interval* | P value for interaction** | |
| Amplified | Non-amplified | ||
| miR-17a | 10.24 (1.04, 100.97) | 0.6 (0.16, 2.21) | 0.029 |
| miR-18a | 131.26 (0.04, 4.21 × 10⁵) | 0.18 (0.06, 0.58) | 0.12 |
| miR-19a | 4.32 (0.83, 22.41) | 0.33 (0.12, 0.95) | 0.0097 |
| miR-19b | 3.88 (0.98, 15.41) | 0.36 (0.1, 1.26) | 0.014 |
| miR-20a | 3.77 (0.89, 16.02) | 0.39 (0.13, 1.17) | 0.018 |
| miR-92 | 2.97 (0.8, 11) | 0.38 (0.14, 1.08) | 0.019 |
hazard ratios stratified by the 13q31 amplification status.
p value for the difference of miRNA’s effects between amplified group and non-amplified group.
To determine if these parameters are independent of other standard prognostic predictors, the models were adjusted for age, sex, group, node status, primary site, and tumor size. After making these adjustments, the interaction between amplification and miRNA expression showed statistical significance for 5 of the 6 miRNA’s in the miR-17-92 cluster (miR-17, miR-19a, miR-19b, miR-20a, and miR-92) (Table 2b). The only miRNA that behaved differently in this analysis was miR-18a, which is consistent with the fact that it was not overexpressed by MIR17HG amplification. The hazard ratios in the 13q31-amplified cases were still high for these five miRNA’s, ranging from 3.0 to 10.2, and miR-17a still showed statistical evidence of a significantly increased hazard ratio (HR = 10.2, 95% CI: 1.04-100.97). A new finding in this multivariate analysis is a decreased hazard ratio for all six miRNA’s in the non-amplified cases. The hazard ratio ranged from 0.18 to 0.6 in these non-amplified cases, and for two miRNA’s, miR-18a and miR-19a, there was statistical evidence of a significantly decreased hazard ratio. This effect is a second contributor to the interaction between amplification and miRNA expression, and suggests that increased miR-17-92 expression in non-amplified cases may be associated with improved outcome in contrast to the situation in 13q31-amplified cases.
To further examine these issues, we focused on PAX7-FOXO1-positive cases, in which most MIR17HG amplification occurs. Of the 21 cases with available RNA and follow-up data, there were 11 cases that failed by 2 years (5 amplified and 6 non-amplified), 9 cases without failure after at least 2 years of follow-up (5 amplified and 4 non-amplified), and one case without a failure and follow-up less than 2 years that was excluded from the analysis. We first focused on miRNA expression in the 10 PAX7-FOXO1-positive cases with MIR17HG amplification. Using the t-test to compare miRNA expression between the failed and non-failed outcome groups, there was significantly higher expression for miR-17, miR-19a, miR-19b, miR-20a, and miR-92 in the failed compared to non-failed group (Fig. 4a). The increases in mean expression between these groups ranged from 1.96- to 2.53-fold for these five miRNA’s and the corresponding p values ranged from 0.011 to 0.0014. As found in the analyses described above, miR-18a was different from the other five miRNA’s with a smaller difference in expression between the two groups that was not statistically significant (p=0.33). These findings support the premise that higher expression of the miR-17-92 cluster is associated with poor outcome in 13q31-amplified cases.
Figure 4. Relationship of outcome to miR-17-92 expression and 13q31 amplification.
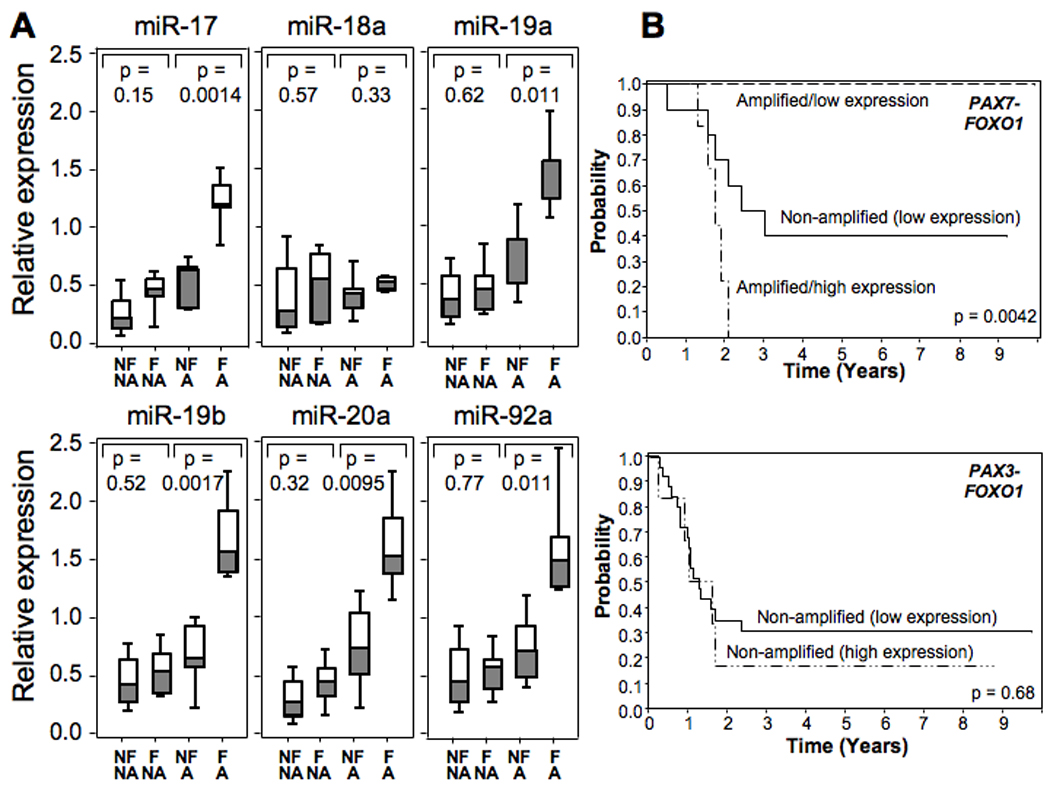
A. Comparison of miRNA expression with 13q31 amplification and outcome status. Cases were divided into those that failed within two years (F) and those that had no evidence of failure for at least two years (NF). One case without evidence of failure and follow-up less than 2 years was excluded from the analysis. In addition, cases were also divided into those with (Amp) and without (NA) evidence of 13q31 amplification. Expression of each miRNA was measured by qRT-PCR in the designated subsets and normalized for RNU48 expression. The t-test was used to compare expression between each pair of related subsets, and the corresponding p value is shown for each miRNA. B. Effect of miR-17-92 expression status and 13q31 amplification status on failure-free survival. Based on the data in part A, the miR-17a expression cut-off level between low and high expression was selected to be 0.8. PAX7-FOXO1-positive ARMS cases are divided into three subsets: 13q31-amplified and miR-17a high expression, n = 6; 13q31-amplified and miR-17a low expression, n = 5; and non-amplified and miR-17a low expression, n = 10. PAX3-FOXO1-positive ARMS cases are divided into two subsets: 13q31-amplified and miR-17a low expression, n = 6; and non-amplified and miR-17a low expression, n = 26.
We next considered the individual miRNA expression levels in the non-amplified PAX7-FKHR-positive cases. In an analysis of 10 non-amplified PAX7-FOXO1-positive cases, the failed group showed a small increase in mean miRNA expression, ranging from 1.10- to 1.73-fold, compared to the non-failed group for all six miRNA’s of the miR-17-92 cluster (Fig. 4a). In contrast to the amplified cases, these differences in miRNA expression did not reach statistical significance in the non-amplified cases for any of the six miRNA’s. However, it should be noted that miRNA expression in these non-amplified groups was lower than the expression level in the failed/amplified group for all miRNA’s except miR-18a. Similar to the findings in the non-amplified PAX7-FKHR cases, comparison of expression of the six miRNA’s in 28 non-amplified PAX3-FOXO1-positive cases with adequate follow-up data also did not show any significant differences between failed (n=21) and non-failed (n=7) subsets. These findings highlight that the poor outcome associated with high miR-17-92 expression is restricted to the 13q31-amplified cases. Furthermore, it should be noted that it is unlikely that we will see the improved outcome associated with increased miR-17-92 expression in non-amplified cases without controlling for multiple clinical parameters such as was done in the multivariate analysis. Actually, this result is consistent with our survival analysis in Table 2a (i.e., before adjusting for the effects of clinical and pathologic factors).
Finally, we used the information from this previous analysis to construct Kaplan-Meier curves (Fig. 4b). Based on our comparison of failed and non-failed 13q31-amplified PAX7-FOXO1-positive cases (Fig. 4a), we selected a miR-17a expression level of 0.8 as a cut-off for low and high expression groups. As a comparison group, the non-amplified PAX7-FOXO1-positive cases, which are all low expression, have an intermediate outcome. The occurrence of 13q31 amplification in PAX7-FOXO1-positive cases with low miR-17a expression is associated with a very good outcome. In contrast, when 13q31 amplified PAX7-FOXO1-positive cases have high miR-17a expression, the outcome is poor. In contrast to these findings in the PAX7-FOXO1-positive cases, there is no significant difference in outcome between the low and high expression subsets of the non-amplified PAX3-FOXO1-positive cases, and too few 13q31-amplified PAX3-FOXO1-positive cases for analysis. These findings therefore highlight the distinct outcomes associated with 13q31 amplification and miR-17-92 overexpression. Future studies are now needed to extend this analysis to independent and larger ARMS case sets.
Discussion
We investigated the amplification derived from the 13q31 chromosomal region in an extensive panel of ARMS tumors. Although a previous study of this amplicon implicated the GPC5 gene, which encodes a cell surface glycoprotein, as the consistent target of 13q31 amplification (13), we present data defining a minimal common region of amplification that excludes the GPC5 gene and consistently contains the MIR17HG gene, encoding the polycystronic miRNA cluster, miR-17-92. Our findings indicate that 13q31 amplification often elevates expression of the miR-17-92 cluster in primary ARMS tumors. We also provide evidence of miR-17-92 induction in a cohort of ARMS tumors lacking 13q31 amplification. These data indicate that multiple mechanisms, both MIR17HG copy number-dependent and copy number-independent, are involved in miR-17-92 overexpression in ARMS.
A model has emerged in which amplification or other gain-of-function change in some cancers involves a gene encoding a miRNA whose target is a tumor suppressor (16). This change leads to increased miRNA expression and a corresponding decreased expression of the tumor suppressor. A major example supporting this model is MIR17HG amplification, which was previously found in diffuse large B cell lymphoma and small cell lung carcinoma (11, 12), and now in ARMS. Similar to the findings in our study, these previous investigations also identified non-amplified cases with increased miR-17-92 expression, indicating other mechanisms for miR-17-92 overexpression. In addition, copy number-independent miR-17-92 overexpression occurs in numerous other tumors (17, 18). In accord with the general model, various tumor suppressors have been identified as miR-17-92 targets, including the proapoptotic protein Bim, the cyclin-dependent kinase inhibitor p21 and the RB-related cell cycle regulator p130 (15, 19).
Additional miR-17-92 targets function in feedback pathways regulating miR-17-92 expression. The E2F transcription factors are targets of miR-17 and miR-20a, and the resulting decrease in E2F expression leads to decreased MIR17HG transcription as well as decreased MYC transcription and further MIR17HG downregulation (20, 21). Recent studies also revealed that miR-17 and miR-20a target cyclin D1 in a second regulatory loop by which cyclin D1 regulates miR-17-92 expression (22). These feedback loops are relevant to this study by providing a potential explanation for the variable miR-17-92 expression following MIR17HG amplification. Other factors in these tumors may also affect the feedback regulation and further contribute to the wide expression range found in MIR17HG-amplified tumors.
As in our previous study of 12q13-q14 amplification, there is a strong association of 13q31 amplification and fusion status in ARMS. In particular, we uncovered a marked propensity for 13q31 amplification to occur in PAX7-FOXO1-positive tumors. One possible explanation is that the biology of these miRNA’s is compatible with that of the PAX7-FOXO1-positive ARMS tumor cell. However, we also note that there is also a very high incidence of amplification of another locus on chromosome 13, the FOXO1 portion of the PAX7-FOXO1 fusion gene (23). The FOXO1 locus at 13q14 and the MIR17HG locus at 13q31 are situated ~50 Mb apart on chromosome 13. We speculate that frequent rearrangement and amplification of the FOXO1 locus may result in strand breaks involving chromosome 13 and increase the probability of additional amplification events at separate loci on chromosome 13.
We noted a distinct expression feature of miR-18a in these 13q31-amplified ARMS tumors. While increased MIR17HG copy number resulted in overexpression of the other miRNA’s in the miR-17-92 cluster, there was no significant change in miR-18a expression compared to tumors without 13q31 amplification. This finding may be in part related to the requirement for the ribonucleoprotein hnRNP A1 in miR-18a biogenesis (24). Our findings thus suggest that hnRNP A1 levels may become limiting due to the 13q31 amplification, perhaps by binding of this protein to other high affinity sites in this chromosomal region.
A striking aspect of this study is the finding of poor clinical outcome in 13q31-amplified cases with high miR-17-92 expression and the contrasting findings of good clinical outcome in 13q31-amplified cases with low miR-17-92 expression and in non-amplified cases with high miR-17-92 expression. The first issue is to compare high miR-17-92 expression in 13q31-amplified cases to high miR-17-92 expression in cases without 13q31 amplification. A first important consideration is the absence of miR-18a overexpression in the 13q31-amplified cases. The absence of miR-18a upregulation in these amplified cases may be pro-oncogenic since KRAS is an established target of miR-18a, and thus expression of this oncoprotein will not be decreased by MIR17HG amplification (25). As a second possibility, we considered whether other nearby 13q31 genes may be co-amplified but did not find any consistently co-amplified genes in 13q13-amplified cases with high miR-17-92 expression. As a third consideration, we note that 13q31-amplified cases with high miR-17-92 expression are almost all cases with PAX7-FOXO1 co-amplification. As described above, these PAX7-FOXO1-positive cases generally have a good clinical outcome (2), and this outcome is related to PAX7-FOXO1 amplification (Barr et al., unpublished observations). We postulate that high PAX7-FOXO1 expression leads to expression of products that suppress some aspect of tumor behavior or promote therapeutic response, and thereby cause a good outcome. The poor outcome in 13q31-amplified cases with high miR-17-92 expression may be due to miRNA’s of the miR-17-92 cluster targeting these tumor suppressor or therapeutic response proteins, decreasing expression or reversing activity, and thus changing the prognosis of a subset of PAX7-FOXO1-positive ARMS cases.
Finally, we consider the molecular basis for improved outcome in the subset of 13q31-amplified cases with low miR-17-92 expression. With a focus primarily on PAX7-FOXO1-positive cases, we must explain the difference between 13q31-amplified and non-amplified cases with low-miR-17-92 expression. Since both categories usually have an amplified PAX7-FOXO1 fusion and comparable low levels of the miRNA’s of the miR-17-92 cluster (including miR-18a), we hypothesize that a 13q31 product other than the miR-17-92 cluster may be responsible for this phenotype. Since we localized the minimal common region of amplification to a 0.15 Mb region containing the MIR17HG gene and a pseudogene (LOC390419), one possibility to consider is that there are functional units in this minimal common region, such as genes encoding other small RNA’s. A second possibility is that the 13q31-amplified cases with low miR-17-92 expression may constitute a larger amplicon that contains additional genes besides MIR17HG. As more cases are accumulated, these possibilities can be explored by further genomic analyses. Finally, we must acknowledge that all of these clinical differences are based on relatively small numbers of cases and must be validated in independent case series to verify the reproducibility of these findings.
In summary, this study has identified different subsets of ARMS cases defined by the status of the MIR17HG gene and the associated miR-17-92 cluster. In one subset, which is mostly PAX7-FOXO1 cases, the MIR17HG gene is amplified and predicts for a poor outcome when the miRNA’s of the miR-17-92 cluster are expressed at high levels. In a second subset, which is mostly PAX3-FOXO1 cases, the miR-17-92 cluster is overexpressed by a copy-number independent process, and there is evidence from multivariate analysis of an improved outcome. In a third subset, which is mostly PAX7-FOXO1-positive cases, the MIR17HG gene and nearby 13q31 region is amplified and predicts for a good outcome when the miR-17-92 cluster is expressed at low levels. Future studies will determine the molecular basis of the poor and good prognosis associated with miR-17-92 expression and 13q31 amplification status, and will determine the potential utility of these miRNA’s as therapeutic targets in these ARMS subsets. These future studies are complicated by the lack of 13q31-amplified PAX7-FOXO1-positive ARMS cell lines for studies of downstream target genes and associated oncogenic phenotype. Therefore, engineered model systems must be developed and validated to further investigate functional issues in these amplified cases.
Statement of Translational Relevance.
This study establishes amplification of the MIR17HG locus and associated overexpression of the miR-17-92 cluster of microRNA’s as novel markers in the pediatric soft tissue cancer alveolar rhabdomyosarcoma (ARMS). This amplification event occurs in the majority of PAX7-FOXO1-positive cases but in only a small subset of PAX3-FOXO1-positive and fusion-negative ARMS cases. The finding of high or low level miR-17-92 expression in the setting of MIR17HG amplification is predictive of a poor or good outcome, respectively. Furthermore, miR-17-92 expression and MIR17HG amplification provide novel markers of prognosis within the PAX7-FOXO1-positive category and are independent of other prognostic markers. In the current treatment regimens, these markers will better allow assignment of these ARMS patients to intermediate and high-risk categories. In the future, the miR-17-92 cluster may indicate a novel target for treatment with agents that specifically antagonize expression and/or function of these microRNA’s.
Supplementary Material
Footnotes
Supported by: NIH grants R01 CA104896, U10 CA098543, U10 CA098413 and U24 CA114766; The Hartwell Foundation; Alex’s Lemonade Stand Foundation; and the Alveolar Rhabdomyosarcoma Research Fund. Tissue samples were provided by the Pediatric Division of the Cooperative Human Tissue Network, which is funded by NIH grant U01 CA054021.
References
- 1.Barr FG, Womer R. Rhabdomyosarcoma. In: Orkin SH, Fisher DE, Look AT, Lux SE, Ginsburg D, Nathan DG, editors. Oncology of Infancy and Childhood. Philadelphia: Saunders; 2009. pp. 743–828. [Google Scholar]
- 2.Sorensen PH, Lynch JC, Qualman SJ, et al. PAX3-FKHR and PAX7-FKHR gene fusions are prognostic indicators in alveolar rhabdomyosarcoma: a report from the children's oncology group. J Clin Oncol. 2002;20:2672–2679. doi: 10.1200/JCO.2002.03.137. [DOI] [PubMed] [Google Scholar]
- 3.Keller C, Arenkiel BR, Coffin CM, El-Bardeesy N, DePinho RA, Capecchi MR. Alveolar rhabdomyosarcomas in conditional Pax3:Fkhr mice: cooperativity of Ink4a/ARF and Trp53 loss of function. Genes Dev. 2004;18:2614–2626. doi: 10.1101/gad.1244004. [DOI] [PMC free article] [PubMed] [Google Scholar]
- 4.Pandita A, Zielenska M, Thorner P, et al. Application of comparative genomic hybridization, spectral karyotyping, and microarray analysis in the identification of subtype-specific patterns of genomic changes in rhabdomyosarcoma. Neoplasia. 1999;1:262–275. doi: 10.1038/sj.neo.7900036. [DOI] [PMC free article] [PubMed] [Google Scholar]
- 5.Bridge JA, Liu J, Qualman SJ, et al. Genomic gains and losses are similar in genetic and histologic subsets of rhabdomyosarcoma, whereas amplification predominates in embryonal with anaplasia and alveolar subtypes. Genes Chromosomes Cancer. 2002;33:310–321. doi: 10.1002/gcc.10026. [DOI] [PubMed] [Google Scholar]
- 6.Gordon AT, Brinkschmidt C, Anderson J, et al. A novel and consistent amplicon at 13q31 associated with alveolar rhabdomyosarcoma. Genes Chromosomes Cancer. 2000;28:220–226. [PubMed] [Google Scholar]
- 7.Barr FG, Duan F, Smith LM, et al. Genomic and clinical analyses of 2p24 and 12q13-q14 amplification in alveolar rhabdomyosarcoma: a report from the Children's Oncology Group. Genes Chromosomes Cancer. 2009;48:661–672. doi: 10.1002/gcc.20673. [DOI] [PMC free article] [PubMed] [Google Scholar]
- 8.Barr FG, Xiong QB, Kelly K. A consensus polymerase chain reaction-oligonucleotide hybridization approach for the detection of chromosomal translocations in pediatric bone and soft tissue sarcomas. Am J Clin Pathol. 1995;104:627–633. doi: 10.1093/ajcp/104.6.627. [DOI] [PubMed] [Google Scholar]
- 9.Barr FG, Smith LM, Lynch JC, et al. Examination of gene fusion status in archival samples of alveolar rhabdomyosarcoma entered on the Intergroup Rhabdomyosarcoma Study-III trial: a report from the Children's Oncology Group. J Mol Diagn. 2006;8:202–208. doi: 10.2353/jmoldx.2006.050124. [DOI] [PMC free article] [PubMed] [Google Scholar]
- 10.Mendell JT. miRiad roles for the miR-17-92 cluster in development and disease. Cell. 2008;133:217–222. doi: 10.1016/j.cell.2008.04.001. [DOI] [PMC free article] [PubMed] [Google Scholar]
- 11.Ota A, Tagawa H, Karnan S, et al. Identification and characterization of a novel gene, C13orf25, as a target for 13q31-q32 amplification in malignant lymphoma. Cancer Res. 2004;64:3087–3095. doi: 10.1158/0008-5472.can-03-3773. [DOI] [PubMed] [Google Scholar]
- 12.Hayashita Y, Osada H, Tatematsu Y, et al. A polycistronic microRNA cluster, miR-17-92, is overexpressed in human lung cancers and enhances cell proliferation. Cancer Res. 2005;65:9628–9632. doi: 10.1158/0008-5472.CAN-05-2352. [DOI] [PubMed] [Google Scholar]
- 13.Williamson D, Selfe J, Gordon T, et al. Role for amplification and expression of glypican-5 in rhabdomyosarcoma. Cancer Res. 2007;67:57–65. doi: 10.1158/0008-5472.CAN-06-1650. [DOI] [PubMed] [Google Scholar]
- 14.Wei JS, Johansson P, Chen QR, et al. microRNA profiling identifies cancer-specific and prognostic signatures in pediatric malignancies. Clin Cancer Res. 2009;15:5560–5568. doi: 10.1158/1078-0432.CCR-08-3287. [DOI] [PMC free article] [PubMed] [Google Scholar]
- 15.Fontana L, Fiori ME, Albini S, et al. Antagomir-17-5p abolishes the growth of therapy-resistant neuroblastoma through p21 and BIM. PLoS ONE. 2008;3:e2236. doi: 10.1371/journal.pone.0002236. [DOI] [PMC free article] [PubMed] [Google Scholar]
- 16.Esquela-Kerscher A, Slack FJ. Oncomirs - microRNAs with a role in cancer. Nat Rev Cancer. 2006;6:259–269. doi: 10.1038/nrc1840. [DOI] [PubMed] [Google Scholar]
- 17.Volinia S, Calin GA, Liu CG, et al. A microRNA expression signature of human solid tumors defines cancer gene targets. Proc Natl Acad Sci USA. 2006;103:2257–2261. doi: 10.1073/pnas.0510565103. [DOI] [PMC free article] [PubMed] [Google Scholar]
- 18.Weiler J, Hunziker J, Hall J. Anti-miRNA oligonucleotides (AMOs): ammunition to target miRNAs implicated in human disease? Gene Ther. 2006;13:496–502. doi: 10.1038/sj.gt.3302654. [DOI] [PubMed] [Google Scholar]
- 19.Lu Y, Thomson JM, Wong HY, Hammond SM, Hogan BL. Transgenic over-expression of the microRNA miR-17-92 cluster promotes proliferation and inhibits differentiation of lung epithelial progenitor cells. Dev Biol. 2007;310:442–453. doi: 10.1016/j.ydbio.2007.08.007. [DOI] [PMC free article] [PubMed] [Google Scholar]
- 20.O'Donnell KA, Wentzel EA, Zeller KI, Dang CV, Mendell JT. c-Myc-regulated microRNAs modulate E2F1 expression. Nature. 2005;435:839–843. doi: 10.1038/nature03677. [DOI] [PubMed] [Google Scholar]
- 21.Aguda BD, Kim Y, Piper-Hunter MG, Friedman A, Marsh CB. MicroRNA regulation of a cancer network: consequences of the feedback loops involving miR-17-92, E2F, and Myc. Proc Natl Acad Sci USA. 2008;105:19678–19683. doi: 10.1073/pnas.0811166106. [DOI] [PMC free article] [PubMed] [Google Scholar]
- 22.Yu Z, Wang C, Wang M, et al. A cyclin D1/microRNA 17/20 regulatory feedback loop in control of breast cancer cell proliferation. J Cell Biol. 2008;182:509–517. doi: 10.1083/jcb.200801079. [DOI] [PMC free article] [PubMed] [Google Scholar]
- 23.Barr FG, Nauta LE, Davis RJ, Schafer BW, Nycum LM, Biegel JA. In vivo amplification of the PAX3-FKHR and PAX7-FKHR fusion genes in alveolar rhabdomyosarcoma. Hum Mol Genet. 1996;5:15–21. doi: 10.1093/hmg/5.1.15. [DOI] [PubMed] [Google Scholar]
- 24.Guil S, Caceres JF. The multifunctional RNA-binding protein hnRNP A1 is required for processing of miR-18a. Nat Struct Mol Biol. 2007;14:591–596. doi: 10.1038/nsmb1250. [DOI] [PubMed] [Google Scholar]
- 25.Tsang WP, Kwok TT. The miR-18a* microRNA functions as a potential tumor suppressor by targeting on K-Ras. Carcinogenesis. 2009;30:953–959. doi: 10.1093/carcin/bgp094. [DOI] [PubMed] [Google Scholar]
Associated Data
This section collects any data citations, data availability statements, or supplementary materials included in this article.