

Abstract
HIV-specific NK (CD3-negative cells), CD4 and CD8 T cellular responses were determined in 79 HIV-1 infected women in response to HIV-1 peptide pools (Gag, Pol, Nef, Reg, Env) with use of a whole blood intracellular cytokine staining (ICS) assay that measures IFN-γ and/or IL-2. HIV-specific CD3-negative responses to any region (Env and Reg predominantly targeted) were associated with lower viral load (P=0.031) and higher CD4 T-cell count (P=0.015). Env-specific CD3-negative responses were stronger where women had both Gag CD4 and CD8 T-cell responses, in turn associated with lower viral loads (P=0.005). CD3-negative cell responders had significantly higher representation of CD4 T-cell responses to Env and Reg (P=0.012 and P=0.015, respectively) and higher magnitudes of CD4 T-cell responses (P=0.017 and P=0.037, respectively) than non-responders. Peptide-specific NK cells are associated with markers of less severe disease progression among HIV-1 infected women (lower viral load, higher CD4 count) and associate with stronger HIV-specific T-cell responses.
Keywords: HIV-specific NK cell responses, viral load, CD4 T-cell count, CD4 and CD8 T-cell responses
Introduction
Natural killer (NK) cells represent an important component of the innate immune response, classically attributed with functions of cytolytic killing and secretion of cytokines and chemokines that aid the subsequent adaptive immune response. These functions are mediated by various groups of NK receptors that include inhibitory, activating and accessory receptors [1-6]. Recent findings, however, contest the classical description of NK cells as possessing only innate immune capability and show these cells to have features ordinarily attributed to the adaptive immune response [7-9].
We have recently reported on the unexpected discovery of unusual NK cell (non-T /CD3-negative) cell responses to HIV-1 peptides whilst studying the role of HIV-specific T-cell responses and maternal-infant HIV-1 transmission [10]. Unlike T-cell responses which broadly respond to the various HIV-1 proteins, these responses that mainly targeted the Env and Reg peptide pools were associated with reduced maternal-infant HIV-1 transmission. Importantly, these responses were not detected in uninfected control mothers or their infants. Furthermore, these responses could only be detected in whole blood assays, requiring a non-specific soluble plasma factor for detection in our study [10] and HIV-specific IgG in another study [11]. Detection of these HIV-specific NK cell responses among HIV-1 exposed uninfected infants add further to the intriguing possibility that these cells possess “memory” of prior exposure to maternal HIV-1 [9, 10].
This paper describes the HIV-specific NK responses from the same cohort of HIV-1 infected women in relation to markers of disease severity (viral load and CD4 T-cell count) and in relation to their HIV-specific CD4 and CD8 T-cell responses. We reveal that these peptide-specific NK cells are associated with markers of less severe disease progression among HIV-1 infected women (lower viral load, higher CD4 count) and associate with stronger HIV-specific T-cell responses.
METHODS
Study participants
A total of 79 HIV-infected, post-partum women, recruited at prevention of mother-to-child HIV transmission (PMTCT) programs at Chris Hani Baragwanath Hospital in Soweto, and Coronation Hospital in Johannesburg, South Africa, were tested for CD4 and CD8 T-cell and CD3-negative cell responses to HIV-1 peptide pools [10]. An NK cell antibody against CD56 was included in assays of 50 of the 79 women. All women were recruited as part of a study of mother-to-child transmission [12], 25 women were drug-naïve, 51 had received single-dose nevirapine and 3 women received triple-drug antiretroviral treatment. The median viral load for the cohort was 4.07 log10 (2.6-5.69 log) (n=79), and the median CD4 T-cell count was 428 cells/μl (range 40-1655 cells/μl) (n=60). Intracellular cytokine staining (ICS) assays were conducted on heparinized whole blood samples soon after delivery or at 6-10 weeks post-delivery. A second sample was obtained from one HIV-1 infected controller (MP001) 3.5 years after the first sample was taken, allowing for comparison of the durability of the CD4 and CD8 T and NK cell responses; this patient was known to have been seropositive since 1998.
HIV-1 RNA levels (expressed as log10 units) were quantitated using the Roche Amplicor RNA Monitor assay (Roche Diagnostic Systems, Inc, New Jersey, USA) with a lower detection limit of 400 HIV-1 RNA copies/ml. CD4 T-cell counts were determined using the commercially available FACSCount System from Becton Dickinson (San Jose, CA).
This study was approved by the University of the Witwatersrand Committee for Research on Human Subjects, and the Columbia University Institutional Review Board and written informed consent was obtained from all women.
Intracellular cytokine staining and flow cytometry
An ICS assay measuring both IFN-γ and IL-2 production (cytokine antibodies labeled with the same fluorochrome for optimal detection of CD4 and CD8 T-cell responses) was performed as previously described [13, 14]. Whole blood samples were stimulated with pools of HIV-1 subtype C peptides (Gag, Pol, Nef, Reg, Env), 15- to 18-mers in length and overlapping by at least 10 amino acids (University of Tübingen, Tübingen, Germany). The Regulatory (Reg) region pool contained peptides for Tat, Rev, Vif, Vpu, and Vpr regions. For the second sample obtained for patient MP001, peptides corresponding to the particular mapped regions targeted by NK cells determined at the first time point (overlapping peptides 1-7 for Tat and 41-47 for gp160) were also included as smaller pools. In brief, 200 μl of whole blood was incubated with one μg of the costimulatory antibodies CD28 and CD49d (BD Biosciences, San Jose, CA, USA) and a final concentration of 1μg/ml of each peptide, together with the secretory inhibitor Brefeldin A (10 μg/ml; Sigma-Aldrich Corp., St. Louis, MI, USA) for 6h at 37°C (peptides added last). A negative control tube incubated with costimulatory antibodies and a positive control tube incubated with Staphylococcus enterotoxin B (final concentration 1 μg/ml) was included for each sample.
Specific fluorescent antibodies (BD Biosciences) used to define CD3-positive and CD3-negative subsets were: CD3-APC, CD8-PerCP, and IFN-(-PE and IL-2-PE and CD56-FITC. Stained samples were acquired on a FACScalibur flow cytometer (Becton Dickinson Immunocytometry Systems) and data were analyzed using FlowJo Software (Tree Star, San Carlos, Calif.). Within the lymphocyte gate CD4 T-cells were defined as CD3+CD8−, CD8 T-cells as CD3+CD8+ cells, CD3-negative cell subsets were defined as CD3neg, CD3−CD8−, CD3−CD8+, CD3−CD56+, CD3−CD56+CD8+, CD3−CD56+CD8−.
A positive peptide-induced CD3-negative cell response was defined as >3% of cells expressing cytokine at a level at least 2-fold above background (this stringent cut-off was used because of variable and, in some individuals, high background stimulation of CD3-negative cells). Note that magnitudes of backgrounds are dependent on the individual, whether HIV-infected or uninfected, and are significantly increased through the addition of costimulatory antibodies anti-CD28 and anti-CD49d (which are added for T cell responses but are not required for detection of HIV-1 peptide specific CD3-negative responses) and the presence of plasma (HIV-positive or negative). Significant T-cell (CD4 and CD8) IL-2 and/or IFN-γ production was defined as responses of ≥0.1% after subtracting the background staining in the absence of peptides.
Statistical analysis
Spearman’s rank correlation (notated as R in the results), Fisher’s Exact test, Wilcoxon matched-pairs and Mann-Whitney U tests were performed using SPSS version 15.0 software (SPSS Inc., Chicago, Illinois).
Results
HIV-specific CD3-negative/NK cell responses are associated with control of HIV-1 infection
Of 79 HIV-infected women, 39 (49.4%) had detectable responses induced among CD3-negative cells to HIV-1 peptide pools (Gag, Pol, Nef, Env, and Reg) with use of a whole blood ICS assay. Examples of representative flow cytometric plots showing the subset analyses and the sample numbers tested for each are shown in Figure 1. We have previously reported the data on these same participants and their infants showing that the CD3-negative peptide-responsive cells were NK cells [10]. Figure 2 shows individual patient data of the magnitude and breadth of detectable CD4 and CD8 T-cell responses, of the CD3−CD8+ subset (which showed the greatest sensitivity of detection of the CD3-negative cell subsets) and of the CD3−CD56+ subset (determined for 50 of the 79 individuals). Patients were grouped according to those with HIV-specific CD3-negative cell responses (Fig. 2a) and those without (Fig. 2b).
Figure 1.

Representative flow cytometric plots showing analyses of HIV-1 peptide stimulated responses in the various lymphocyte subsets. (a) Gating of lymphocytes according to side scatter (SSC) and forward scatter (FSC) characteristics and then SSC and CD3 positivity. (b) Gating of CD3-negative cells according to CD8 expression (y-axis), and of NK cells according to CD56 (on y-axis) and CD8 (x-axis) expression (c). Results for proportions of cells expressing IFN-γ (x-axis) for each of two CD3-negative and two CD56-positive quadrants (i, ii) are shown for the unstimulated control (US), Gag (No response), Env and Reg peptide pools (positive responses). Note that the IFN-γ-expressing cells that are CD56+ NK cells (quadrants i and ii) are CD56dim cells, the CD56bright cells are not among the NK cells producing IFN-γ. (d) Gating of CD3-positive cells as CD8+ (y-axis) and CD8− (CD4) with representative plots below of IFN-γ and/or IL-2 responses for the various stimuli (indicated at left of figure).
Figure 2.
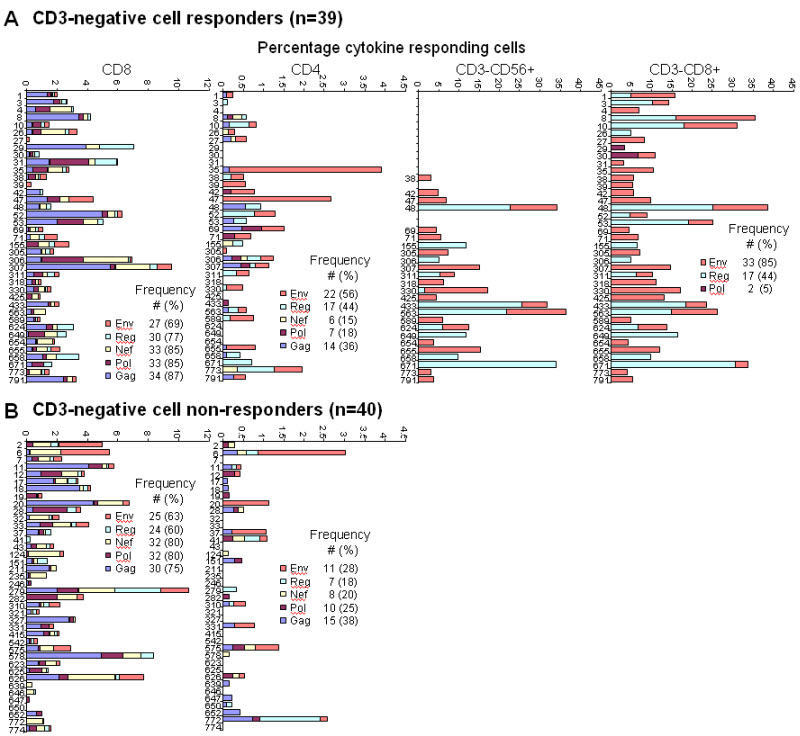
Percentages of cytokine-positive cells induced by HIV-1 peptide pools representing Gag, Pol, Nef, Reg and Env for CD4 and CD8 T-cells, and for CD3-negative/NK cells (examples are for CD3−CD56+ and CD3−CD8+ subsets) of the 79 HIV-1 infected women. Women were stratified as (a) CD3-negative cell responders and (b) CD3-negative cell non-responders, and the frequency of individuals positive for a specific pool response (indicated as different color blocks in the key) within these categories are shown (number with percentage in parentheses).
CD3-negative cell responses were to only select HIV-1 peptide pools (33 responded to Env, 17 to Reg and 2 to Pol). This was in contrast to CD4 and CD8 T-cells which broadly targeted the protein regions (Fig. 2). Of the 50 women where we could analyze the CD3−CD56+ subset, 25 had responses with 23 of these concordant for specificities of response when compared to the CD3−CD8+ subset shown (Fig. 2). In instances of discordance, Env and Reg responses were detected in one subset, with Reg only in the other (patient 330 and 671).
To address questions of associations between HIV-specific CD3-negative cell responses and markers of the severity of HIV disease, including viral load and CD4 counts, cross-sectional comparisons were conducted on 76 of the 79 HIV-1 infected women (Fig. 3). Three women were excluded because they received triple-drug antiretroviral treatment. The presence of any CD3-negative cell response to any HIV-1 protein region was associated with significantly lower viral loads and higher CD4 T-cell counts compared to non-responders (Fig. 3a). The association was strongest if CD3-negative cell response to any HIV-1 protein region were of higher magnitude (>5%) (Fig. 3b). The association was also stronger if CD3-negative responses were broader i.e. targeted both Env and Reg (Fig. 3c).
Figure 3.

HIV-specific CD3-negative cell responses associate with markers of the severity of HIV-1 disease in HIV-1 infected women. (a) Distribution of viral load and CD4 T cell count of HIV-infected women with or without a CD3-negative cell response to any HIV-1 protein region (b) Distribution of viral load and CD4 T-cell count in women with high (>5%), low (3-5%) or undetectable HIV-specific CD3-negative cell responses. (c) Distribution of viral load and CD4 T-cell count in women with CD3-negative cell responses that target both Env and Reg, Env or Reg alone (includes one responder to Pol) and non-responders. CD4 T-cell counts were only available for 57 of the 76 women. (d) Distribution of viral load and the magnitude of CD3−CD8− responses to Env in women with a Gag-specific CD8 T-cell response alone or with both CD4 and CD8 T-cell responses to Gag. Boxes indicate the upper and lower quartile with the median shown as the center line of the box. Whiskers extend from the top 90% to the bottom 10% with outliers shown as dots.
We have previously shown in a subset of this cohort, that the co-occurrence of gag-specific CD4 T-cell responses with CD8 T-cell responses are a robust marker of good immune integrity and viral control [14]. In keeping with these findings, viral loads were significantly lower (P=0.005) in women with both CD4 and CD8 T-cell responses to Gag compared to those with only CD8 T-cell responses to Gag (Fig. 3d first panel). In addition, the magnitudes of the CD3-negative cell responses to Env (CD3neg P=0.041 and CD3−CD8− P=0.02, trend in CD3−CD8+ P=0.057; Reg not significant) were significantly higher among those with CD4-supported CD8 T-cell responses to Gag than among those with Gag-specific CD8 T-cell responses only. Since Gag-specific CD8 T-cell responses were common, only 12 are excluded in this comparison.
Considered on a semi-quantitative scale, the magnitudes of the HIV-specific CD3-negative cell subset responses to Env and Reg correlated negatively with viral load (R=−0.315, P=0.006 and R=−0.233, P=0.043) and positively with CD4 T-cell count (R=0.328, P=0.013 and R=0.384, P=0.003). Magnitudes of CD8 and CD4 T-cell responses to Gag, on the other hand, correlated significantly only with viral load (R=−0.378, P=0.001 and R=−0.324, P=0.004) but not with CD4 T-cell count. Unstimulated control values, which reflects extent of activation of NK cells in vivo and within the assay, did not correlate with either CD4 T-cell count or viral load (data not shown).
HIV-specific CD4 and CD8 T-cell responses among CD3-negative cell responders and non-responders
There were no differences between HIV-specific CD3-negative cell responders and non-responders in the frequencies of women with HIV-specific CD8 T-cell responses (Fig. 2) or in the magnitudes of the responses (Fig. 4a) to any of the peptide pools (P>0.05). Therefore, CD8 T-cell responses could not account for why CD3-negative cell responses associated with better control of HIV-1 infection.
Figure 4.

Magnitudes of HIV-specific T-cell responses stratified according to the presence or absence of CD3-negative cell responses. (a) CD8 and (b) CD4 T-cell response magnitudes (y-axis: percentage cytokine-positive cells) are shown as the Total (summation of magnitudes of all peptide pool responses for each patient), and individual Gag, Pol, Nef, Reg and Env peptide pools, stratified by CD3-negative cell responsiveness (x-axis: Responders and Non-responders). Individual values are shown as solid circles; the solid lines indicate the median values. Significant differences between groups are shown (P<0.05).
However, individuals with CD4 T-cell responses to Env and Reg had significantly greater representation within the CD3-negative cell responder group compared to the non-responders (56% vs 28%; P=0.012; and 44% vs 18%; P=0.015, respectively) (Fig. 2), and magnitudes of these CD4 T-cell responses (Fig. 4b) were significantly elevated in CD3-negative cell responders (P=0.017 and P=0.037, respectively). Within the responder group, magnitudes of CD4 Reg responses correlated significantly with magnitudes of CD3-negative (CD3−CD8+) cell responses (R=0.556, P<0.001). In turn, a CD4 Reg response was associated with significantly lower viral load (P=0.026). These relationships did not hold for CD4 T-cell responses to Env. Of the 39 CD3-negative cell responders, 20 (51.3%) shared a CD4 and CD3-negative response to Env, and 13 (33.3%) had a CD3-negative response only, whereas for Reg it was 12 (30.8%), and 5 (12.8%), respectively (data not shown). Both CD3-negative and CD4+CD8 Gag responses were significantly associated with viral load in multivariate analysis (P=0.05 and P=0.02, respectively). The other factors investigated (CD4 Env, CD4 Reg) were not significantly associated with viral load and were excluded from final models.
Durability of NK cell responses in an HIV-1 controller
In order to gain more insight into HIV-specific responses within the HIV-1 proteins targeted by NK cells, we had previously mapped individual peptide responses for each of the cell types across the HIV-1 genome using a whole blood assay that uses a pool and matrix design allowing identification of each overlapping peptide response [13]. The data highlighted that (i) HIV-specific NK cell responses can be mapped in a similar way to T-cell responses, and (ii) often, but not always, could be mapped to similar regions on the same HIV-1 proteins (gp160, Vpu, Tat) [10]. Of the 6 patients mapped one patient, MP001, was infected for at least 10 years and with undetectable viral load. She was again tested 3.5 years later, for NK cell responsiveness to the peptide pools and to the specific peptide regions of Env and Tat previously targeted (Fig. 5a). Similar specificities and robustness of responses were encountered, but with loss of CD4 T-cell responses and most of the CD8 T-cell responses (Fig. 5b), again highlighting that NK responses can occur in the absence of T-cell responses to the same peptide pool ex vivo. Optimal epitope mapping will in future help identify how specific recognition differs between cell types in regions of similarity.
Figure 5.

(a) Whole genome peptide mapping: Comparison of amino acid regions targeted on gp160 and Tat by CD4 and CD8 T-cells, and CD3−CD56+ cells of HIV-infected individual MP001. Lengths (in amino acids) of the HIV-1 subtype C proteins are indicated at the carboxyl end (COOH). NH2: N-terminal end of protein. NTD: N-terminal domain, CD: cytoplasmic domain. An example of the amino acid regions spanned and domains targeted by NK+ cells are shown in grey shaded boxes. Amino acid coordinates at the start and end of each region were determined according to their positions on Du179 Env and Du422 Tat (Genbank accession numbers AY043174 and AY043175, respectively; Los Alamos http://www.hiv.lanl.gov). (b) Durability of the NK cell response in patient MP001. NK cell and CD4 and CD8 T-cell responses were determined at two time points (i and ii), 3.5 years apart. Percentage of IFN-γ expressing cells (y-axis) shown for CD4 and CD8 T-cells (top panel) and for NK+(CD3−CD56+)CD8+ and NK+CD8−; HIV-1 peptide pools (x-axis). Tat peptides 1-7 and Env peptides 41-47 constitute additional pools (7 overlapping peptides in each; same peptides as in large peptide pools) tested that correspond to the amino acid regions determined positive for CD3-negative cell responses at the first time point (Fig. 5a). CD4 count was 678 cells/μl and 1074 cells/μl for samples i and ii, respectively; viral load was <400 RNA copies/ml for both.
Discussion
This study describes the relationships between the recently-discovered unusual NK responses to HIV-1 peptides [10] and markers of disease severity and HIV-specific CD4 and CD8 T-cell responses among HIV-1 infected women. The NK responses were mainly to Reg (Vpu and Tat) and Env protein regions, contrasting with T-cells that more broadly targeted all HIV-1 proteins. There have been many studies and much discussion around the characteristics of HIV-specific T-cell responses (specificity, breadth, magnitude, polyfunctionality, phenotype) that may underlie good control of viral replication in HIV-1 infected individuals (for review see [15]). There is also increasing awareness of the likely role of other players, particularly the innate immune response, in control of HIV.
HIV-specific NK responses among women were associated with lower viral loads and higher CD4 T-cell counts. Broader responses (i.e. to both Reg and Env) and responses of higher magnitude had the strongest association with better control of HIV-1 infection. Although magnitudes of CD4 and CD8 T-cell responses to Gag correlated significantly with viral load (not CD4 T-cell counts) as shown previously [14], representation or magnitude of either of these responses were not responsible for why NK responders had better control of infection than NK non-responders. However, when looking at individuals with CD4-supported CD8 T-cell response to Gag (who had lower viral loads) compared to CD8 T-cell responses to Gag alone, these individuals had higher magnitude CD3-negative cell responses to Env (but not Reg). We previously suggested that these CD4 T-cell responses to Gag may indicate more functionally effective Gag-specific CD8 T-cell responses [14]; these may be comparable to CD8 T-cell responses of greater quality by measure of the presence of multiple functions simultaneously by polychromatic flow cytometry [16, 17]. These findings can be interpreted in a number of ways: (i) in vivo CD4 Gag responses may provide help for HIV-specific NK cells, (ii) HIV-specific NK cells provide help to maintain and preserve CD4 T-cell responses or (iii) NK-CD4 T-cell responses help each other in a bidirectional fashion. All these possibilities may in turn also lead to better quality CD8 T-cell responses. Immune response interactions, particularly in the context of existing HIV-1 infection with its accompanied immune dysregulation, are enormously complex and control of HIV-1 infection is unlikely to be explained by just one type of immune response.
A significantly higher representation and magnitude of CD4 T-cell responses to Reg and Env was found among NK responders compared to non-responders, further suggesting a relationship between these two responding cell types. Although most often Env- or Reg-specific CD4 and NK cell responses occurred together, NK cell responses occurred alone more frequently than did CD4 T-cell responses (at least for Env). These results suggest that the peptide specificity measured in the NK cells is not indirectly due to T-cell responsiveness to the same peptide pool in the ICS assay, as these responses can be detected in the absence of T-cell responses. This conclusion is further supported by (i) the detection of similar responses in a proportion of infants, all of whom had no detectable T-cell responses to any peptide pools [10], (ii) NK responses were rarely detected to regions other than Env and Reg, which are broadly targeted by T-cells, (iii) finer mapping of response specificity across the HIV-1 genome revealed some similarity in amino acid regions recognized by T-cells and NK cells on Env in some but not all patients [10], and (iv) maintenance of Reg and Env NK responses in our one HIV-1 controller over several years while the same Reg- and Env-specific T-cell responses (and other specificities) were lost.
Of interest, the magnitude of the Reg responses, but not the Env responses, were strongly positively correlated among CD4 T-cells and NK cells, suggesting that either response may influence the magnitude of the other within the ICS assay itself (ex vivo effect), or in vivo there is a strong relationship between the co-occurrence and magnitudes of these specific responses, perhaps through good quality of both responses and similarity in protein targeting. In the ICS assay, newly synthesized cytokines are trapped within cells by brefeldin A from the start of the assay (added before peptides); however preformed chemokines (CCL3, CCL4, CCL5 and IL-8) are secreted in the peptide-stimulated whole blood cultures of NK cell responders but not non-responders (D. Schramm, unpublished data), all chemokines known to enhance CD4 T-helper cell responses [18-20] and also activate NK cells [21], and could explain the relationship between CD4 T-cell and NK cell magnitudes of response. A commonly described mechanism whereby IFN-γ production is upregulated in NK cells is in a bystander fashion through antigen-specific T-cell activation and production of IL-2 [22, 23]. However, cytokines such as IL-2, IL-12, IL-15 were not secreted, so CD4 T-cell responses to Reg were unlikely to in turn affect NK cell responsiveness through a mechanism reliant on secretion of newly produced cytokines (D. Schramm, unpublished data).
Recent data supports that NK cells are responsible for a large proportion of peptide-responsive (Gag/Nef) IFN-γ-positive cells in ELISPOT assays, this was dependent on T-cells as their depletion abrogated this response [24]. In these assays cells were stimulated for 24h with brefeldin A added for the final 6h of the assay, presumably allowing unabated release of cytokines that in bystander fashion activate IFN-γ production in NK cells. Together, these data highlight the importance of the choice of assay used to measure T-cell responses to peptides, and defining what the output measures in fact mean. Another example of how different the outcomes can be, is based on a study by Stratov et al [11], where in a similar assay to ours, and in contrast to our findings showing the need for an as yet undefined non-specific plasma factor [10], they determined similar responses among NK cells to be mediated by HIV-specific IgG (ADCC antibodies). It is therefore likely that, for various reasons, different mechanisms may be demonstrated in different patients or different population groups or even at different stages of infection.
Host genetic studies have revealed associations that suggest an important role for NK cells in control of HIV-1 infection via recognition by KIR receptors of specific HLA class I molecules [25-27]. A model has been proposed [28] to explain these findings, one that suggests effective NK cells would recognize infected cells either through ligation of activating NK cell receptors and/or loss of ligands for inhibitory receptors, so favouring activation of NK cells resulting in lysis of infected cells [28]. In vitro functional data supports that NK cells kill their HIV-infected target cells in a receptor-ligand-specific manner [29]. NK cells are under strict control with inhibitory signals dominating under normal conditions, a mechanism that ensures that normal cells are not destroyed. HIV-1 infection results in substantial dysregulation of NK cell phenotype and function [30-40]. There is an alteration in NK receptor ligand expression [41], and upregulation of inhibitory receptors [34, 42] and reduced expression of activating receptors [34, 36, 43] in viremic versus aviremic patients. The balance therefore appears to tip in favour of inhibition of NK cell responses in viremic patients.
We propose, in keeping with the model described, that the NK cells of individuals responsive to specific HIV-1 peptides overcome the inhibitory signals sufficiently to become activated, presumably through ligation of NK activating receptors and peptide-loaded HLA class I ligands. Given the variation in representation and expression of KIR genes in different individuals, together with host variation of HLA class I molecules, it can be anticipated that different molecules or combinations of molecules may account for activation of NK cells in response to peptides in different individuals. Whether other activating NK receptors are involved can also not be excluded.
More detailed evaluation of mechanisms involved, of the immunophenotypes of peptide-responsive NK cells, and the cells with which NK cells engage will provide much-needed insight into the nature of these responses. As discussed previously [10], lack of detection in uninfected individuals but detection of these responses in particular in exposed uninfected infants suggests that these may be recall responses to HIV-1. Overall, these findings provide promise of a new measure of an immune response that plays an important role in control of HIV-1 infection.
ACKNOWLEDGEMENTS
We wish to thank the study coordinator, Sarita Lalsab, and staff of the Perinatal HIV Research Unit, Chris Hani Baragwanath and Coronation Hospitals, for their valuable contribution. Thanks also to Busani Mathebula and Fiona Anthony for technical help.
This study was supported in part by the South African AIDS Vaccine Initiative (SAAVI) and by grants from NICHD 42402 and the Wellcome Trust. CTT is a Wellcome Trust International Senior Research Fellow (076352/Z/05/Z).
Footnotes
COMPETING INTERESTS STATEMENT: The authors declare that they have no competing financial interests.
References
- 1.Moretta A, Bottino C, Vitale M, et al. Receptors for HLA class-I molecules in human natural killer cells. Annu Rev Immunol. 1996;14:619–48. doi: 10.1146/annurev.immunol.14.1.619. [DOI] [PubMed] [Google Scholar]
- 2.Long EO. Regulation of immune responses through inhibitory receptors. Annu Rev Immunol. 1999;17:875–904. doi: 10.1146/annurev.immunol.17.1.875. [DOI] [PubMed] [Google Scholar]
- 3.Biassoni R, Cantoni C, Pende D, et al. Human natural killer cell receptors and coreceptors. Immunol Rev. 2001;181:203–14. doi: 10.1034/j.1600-065x.2001.1810117.x. [DOI] [PubMed] [Google Scholar]
- 4.Moretta A, Bottino C, Vitale M, et al. Activating receptors and coreceptors involved in human natural killer cell-mediated cytolysis. Annu Rev Immunol. 2001;19:197–223. doi: 10.1146/annurev.immunol.19.1.197. [DOI] [PubMed] [Google Scholar]
- 5.Raulet DH. Interplay of natural killer cells and their receptors with the adaptive immune response. Nat Immunol. 2004;5:996–1002. doi: 10.1038/ni1114. [DOI] [PubMed] [Google Scholar]
- 6.Lanier LL. NK cell recognition. Annu Rev Immunol. 2005;23:225–74. doi: 10.1146/annurev.immunol.23.021704.115526. [DOI] [PubMed] [Google Scholar]
- 7.O’Leary JG, Goodarzi M, Drayton DL, von Andrian UH. T cell- and B cell-independent adaptive immunity mediated by natural killer cells. Nat Immunol. 2006;7:507–16. doi: 10.1038/ni1332. [DOI] [PubMed] [Google Scholar]
- 8.Sun JC, Beilke JN, Lanier LL. Adaptive immune features of natural killer cells. Nature. 2009;457:557–61. doi: 10.1038/nature07665. [DOI] [PMC free article] [PubMed] [Google Scholar]
- 9.Sun JC, Lanier LL. Natural killer cells remember: an evolutionary bridge between innate and adaptive immunity? Eur J Immunol. 2009;39:2059–64. doi: 10.1002/eji.200939435. [DOI] [PMC free article] [PubMed] [Google Scholar]
- 10.Tiemessen CT, Shalekoff S, Meddows-Taylor S, et al. Cutting Edge: Unusual NK cell responses to HIV-1 peptides are associated with protection against maternal-infant transmission of HIV-1. J Immunol. 2009;182:5914–8. doi: 10.4049/jimmunol.0900419. [DOI] [PMC free article] [PubMed] [Google Scholar]
- 11.Stratov I, Chung A, Kent SJ. Robust NK cell-mediated human immunodeficiency virus (HIV)-specific antibody-dependent responses in HIV-infected subjects. J Virol. 2008;82:5450–9. doi: 10.1128/JVI.01952-07. [DOI] [PMC free article] [PubMed] [Google Scholar]
- 12.Kuhn L, Schramm DB, Donninger S, et al. African infants’ CCL3 gene copies influence perinatal HIV transmission in the absence of maternal nevirapine. Aids. 2007;21:1753–61. doi: 10.1097/QAD.0b013e3282ba553a. [DOI] [PMC free article] [PubMed] [Google Scholar]
- 13.Meddows-Taylor S, Shalekoff S, Kuhn L, Gray GE, Tiemessen CT. Development of a whole blood intracellular cytokine staining assay for mapping CD4(+) and CD8(+) T-cell responses across the HIV-1 genome. J Virol Methods. 2007;144:115–21. doi: 10.1016/j.jviromet.2007.04.004. [DOI] [PMC free article] [PubMed] [Google Scholar]
- 14.Shalekoff S, Meddows-Taylor S, Schramm DB, et al. Host CCL3L1 gene copy number in relation to HIV-1-specific CD4+ and CD8+ T-cell responses and viral load in South African women. J Acquir Immune Defic Syndr. 2008;48:245–54. doi: 10.1097/QAI.0b013e31816fdc77. [DOI] [PMC free article] [PubMed] [Google Scholar]
- 15.Betts MR, Gray CM, Cox JH, Ferrari G. Antigen-specific T-cell-mediated immunity after HIV-1 infection: implications for vaccine control of HIV development. Expert Rev Vaccines. 2006;5:505–16. doi: 10.1586/14760584.5.4.505. [DOI] [PubMed] [Google Scholar]
- 16.Betts MR, Nason MC, West SM, et al. HIV nonprogressors preferentially maintain highly functional HIV-specific CD8+ T cells. Blood. 2006;107:4781–9. doi: 10.1182/blood-2005-12-4818. [DOI] [PMC free article] [PubMed] [Google Scholar]
- 17.Duvall MG, Precopio ML, Ambrozak DA, et al. Polyfunctional T cell responses are a hallmark of HIV-2 infection. Eur J Immunol. 2008;38:350–63. doi: 10.1002/eji.200737768. [DOI] [PMC free article] [PubMed] [Google Scholar]
- 18.Taub DD, Turcovski-Corrales SM, Key ML, Longo DL, Murphy WJ. Chemokines and T lymphocyte activation: I. Beta chemokines costimulate human T lymphocyte activation in vitro. J Immunol. 1996;156:2095–2103. [PubMed] [Google Scholar]
- 19.Sin J, Kim JJ, Pachuk C, Satishchandran C, Weiner DB. DNA vaccines encoding interleukin-8 and RANTES enhance antigen-specific Th1-type CD4(+) T-cell-mediated protective immunity against herpes simplex virus type 2 in vivo. J Virol. 2000;74:11173–80. doi: 10.1128/jvi.74.23.11173-11180.2000. [DOI] [PMC free article] [PubMed] [Google Scholar]
- 20.Kim JJ, Yang JS, Dentchev T, Dang K, Weiner DB. Chemokine gene adjuvants can modulate immune responses induced by DNA vaccines. J Interferon Cytokine Res. 2000;20:487–98. doi: 10.1089/10799900050023906. [DOI] [PubMed] [Google Scholar]
- 21.Maghazachi AA, Al-Aoukaty A. Chemokines activate natural killer cells through heterotrimeric G-proteins: implications for the treatment of AIDS and cancer. Faseb J. 1998;12:913–24. doi: 10.1096/fasebj.12.11.913. [DOI] [PubMed] [Google Scholar]
- 22.He XS, Draghi M, Mahmood K, et al. T cell-dependent production of IFN-gamma by NK cells in response to influenza A virus. J Clin Invest. 2004;114:1812–9. doi: 10.1172/JCI22797. [DOI] [PMC free article] [PubMed] [Google Scholar]
- 23.Fehniger TA, Cooper MA, Nuovo GJ, et al. CD56bright natural killer cells are present in human lymph nodes and are activated by T cell-derived IL-2: a potential new link between adaptive and innate immunity. Blood. 2003;101:3052–7. doi: 10.1182/blood-2002-09-2876. [DOI] [PubMed] [Google Scholar]
- 24.Loo CP, Long BR, Hecht FM, Nixon DF, Michaelsson J. HIV-1-specific T Cell-dependent natural killer (NK) cell activation: major contribution by NK cells to interferon-gamma production in response to HIV-1 antigens. AIDS Res Hum Retroviruses. 2009;25:603–5. doi: 10.1089/aid.2008.0165. [DOI] [PMC free article] [PubMed] [Google Scholar]
- 25.Gaudieri S, DeSantis D, McKinnon E, et al. Killer immunoglobulin-like receptors and HLA act both independently and synergistically to modify HIV disease progression. Genes Immun. 2005;6:683–90. doi: 10.1038/sj.gene.6364256. [DOI] [PubMed] [Google Scholar]
- 26.Martin MP, Gao X, Lee JH, et al. Epistatic interaction between KIR3DS1 and HLA-B delays the progression to AIDS. Nat Genet. 2002;31:429–34. doi: 10.1038/ng934. [DOI] [PubMed] [Google Scholar]
- 27.Martin MP, Qi Y, Gao X, et al. Innate partnership of HLA-B and KIR3DL1 subtypes against HIV-1. Nat Genet. 2007;39:733–40. doi: 10.1038/ng2035. [DOI] [PMC free article] [PubMed] [Google Scholar]
- 28.Altfeld M, Goulder P. ‘Unleashed’ natural killers hinder HIV. Nat Genet. 2007;39:708–10. doi: 10.1038/ng0607-708. [DOI] [PubMed] [Google Scholar]
- 29.Alter G, Martin MP, Teigen N, et al. Differential natural killer cell-mediated inhibition of HIV-1 replication based on distinct KIR/HLA subtypes. J Exp Med. 2007;204:3027–36. doi: 10.1084/jem.20070695. [DOI] [PMC free article] [PubMed] [Google Scholar]
- 30.Hu PF, Hultin LE, Hultin P, et al. Natural killer cell immunodeficiency in HIV disease is manifest by profoundly decreased numbers of CD16+CD56+ cells and expansion of a population of CD16dimCD56− cells with low lytic activity. J Acquir Immune Defic Syndr Hum Retrovirol. 1995;10:331–40. [PubMed] [Google Scholar]
- 31.Lucia B, Jennings C, Cauda R, Ortona L, Landay AL. Evidence of a selective depletion of a CD16+ CD56+ CD8+ natural killer cell subset during HIV infection. Cytometry. 1995;22:10–5. doi: 10.1002/cyto.990220103. [DOI] [PubMed] [Google Scholar]
- 32.Azzoni L, Papasavvas E, Chehimi J, et al. Sustained impairment of IFN-gamma secretion in suppressed HIV-infected patients despite mature NK cell recovery: evidence for a defective reconstitution of innate immunity. J Immunol. 2002;168:5764–70. doi: 10.4049/jimmunol.168.11.5764. [DOI] [PubMed] [Google Scholar]
- 33.Tarazona R, Casado JG, Delarosa O, et al. Selective depletion of CD56(dim) NK cell subsets and maintenance of CD56(bright) NK cells in treatment-naive HIV-1-seropositive individuals. J Clin Immunol. 2002;22:176–83. doi: 10.1023/a:1015476114409. [DOI] [PubMed] [Google Scholar]
- 34.De Maria A, Fogli M, Costa P, et al. The impaired NK cell cytolytic function in viremic HIV-1 infection is associated with a reduced surface expression of natural cytotoxicity receptors (NKp46, NKp30 and NKp44) Eur J Immunol. 2003;33:2410–8. doi: 10.1002/eji.200324141. [DOI] [PubMed] [Google Scholar]
- 35.Kottilil S, Chun TW, Moir S, et al. Innate immunity in human immunodeficiency virus infection: effect of viremia on natural killer cell function. J Infect Dis. 2003;187:1038–45. doi: 10.1086/368222. [DOI] [PubMed] [Google Scholar]
- 36.Mavilio D, Benjamin J, Daucher M, et al. Natural killer cells in HIV-1 infection: dichotomous effects of viremia on inhibitory and activating receptors and their functional correlates. Proc Natl Acad Sci U S A. 2003;100:15011–6. doi: 10.1073/pnas.2336091100. [DOI] [PMC free article] [PubMed] [Google Scholar]
- 37.Kottilil S, Shin K, Planta M, et al. Expression of chemokine and inhibitory receptors on natural killer cells: effect of immune activation and HIV viremia. J Infect Dis. 2004;189:1193–8. doi: 10.1086/382090. [DOI] [PubMed] [Google Scholar]
- 38.Alter G, Teigen N, Davis BT, et al. Sequential deregulation of NK cell subset distribution and function starting in acute HIV-1 infection. Blood. 2005;106:3366–9. doi: 10.1182/blood-2005-03-1100. [DOI] [PubMed] [Google Scholar]
- 39.Fauci AS, Mavilio D, Kottilil S. NK cells in HIV infection: paradigm for protection or targets for ambush. Nat Rev Immunol. 2005;5:835–43. doi: 10.1038/nri1711. [DOI] [PubMed] [Google Scholar]
- 40.Mavilio D, Lombardo G, Benjamin J, et al. Characterization of CD56−/CD16+ natural killer (NK) cells: a highly dysfunctional NK subset expanded in HIV-infected viremic individuals. Proc Natl Acad Sci U S A. 2005;102:2886–91. doi: 10.1073/pnas.0409872102. [DOI] [PMC free article] [PubMed] [Google Scholar]
- 41.Bonaparte MI, Barker E. Killing of human immunodeficiency virus-infected primary T-cell blasts by autologous natural killer cells is dependent on the ability of the virus to alter the expression of major histocompatibility complex class I molecules. Blood. 2004;104:2087–94. doi: 10.1182/blood-2004-02-0696. [DOI] [PubMed] [Google Scholar]
- 42.Sirianni MC, Ensoli F, Alario C, et al. Distribution of the natural killer-related receptor for HLA-C during highly active antiretroviral therapy for human immunodeficiency virus infection. Hum Immunol. 2001;62:1328–34. doi: 10.1016/s0198-8859(01)00355-x. [DOI] [PubMed] [Google Scholar]
- 43.Fogli M, Costa P, Murdaca G, et al. Significant NK cell activation associated with decreased cytolytic function in peripheral blood of HIV-1-infected patients. Eur J Immunol. 2004;34:2313–21. doi: 10.1002/eji.200425251. [DOI] [PubMed] [Google Scholar]