

Abstract
In developing cells of the mouse dorsal lateral geniculate nucleus (dLGN), synaptic responses evoked by optic tract (OT) stimulation give rise to long-lasting, high-amplitude depolarizations known as plateau potentials. These events are mediated by L-type Ca2+ channels and occur during early postnatal life, a time when retinogeniculate connections are remodelling. To better understand the relationship between L-type activity and dLGN development we used an in vitro thalamic slice preparation which preserves the retinal connections and intrinsic circuitry in dLGN and examined how synaptic responses evoked by OT stimulation lead to the activation of plateau potentials. By varying the strength and temporal frequency of OT stimulation we identified at least three factors that contribute to the developmental regulation of plateau activity: the degree of retinal convergence, the temporal pattern of retinal stimulation and the emergence of feed-forward inhibition. Before natural eye opening (postnatal day 14), the excitatory synaptic responses of relay cells receiving multiple retinal inputs summated in both the spatial and temporal domains to produce depolarizations sufficient to activate L-type activity. After eye opening, when inhibitory responses are fully developed, plateau activity was rarely evoked even with high temporal rates of OT stimulation. When the bulk of this inhibition was blocked by bath application of bicuculline, the incidence of plateau activity increased significantly. We also made use of a transgenic mouse that lacks the β3 subunit of the L-type Ca2+ channel. These mutants have far fewer membrane-bound Ca2+ channels and attenuated L-type activity. In β3 nulls, L-type plateau activity was rarely observed even at young ages when plateau activity prevails. Thus, in addition to the changing patterns of synaptic connectivity and retinal activity, the expression of L-type Ca2+ channels is a requisite component in the manifestation of plateau activity.
Non-technical summary
In the developing visual system, spontaneous retinal activity plays an important role in the refinement of retinal ganglion cell projections to the dorsal lateral geniculate nucleus (dLGN) of thalamus. How such changes are implemented remains unknown. Recordings of post-synaptic dLGN cell activity suggest that plateau-like, L-type Ca2+ channel-mediated depolarizations figure prominently in remodelling. Plateaus are developmentally regulated and their incidence is controlled by the changing patterns of excitatory and inhibitory connections onto dLGN cells. At early ages there is a high degree of retinal convergence, and excitatory post-synaptic events summate to produce depolarizations sufficient to activate plateaus. As these excitatory inputs are pruned and inhibitory connections emerge, the net excitatory drive is reduced and plateaus wane. Additionally, L-type channels are highly expressed at young ages, and subunit disruptions resulting in decreased expression also affect the incidence of plateaus. These studies help elucidate the mechanisms underlying activity-dependent refinement of sensory connections.
Introduction
Ca2+ signalling through L-type Ca2+ channels is a prominent feature of many developing neurons and has been implicated in a number of important events including cell survival, axonal and dendritic growth, synaptogenesis and plasticity, as well as intracellular signalling and gene expression (Cohen & Greenburg, 2008; Greer & Greenburg, 2008). L-type channel activation can give rise to diverse patterns of activity, ranging from small spikes, spontaneous membrane oscillations and prolonged firing rates, to large plateau-like depolarizations (Rekling & Feldman, 1997; Morisset & Nagy, 1999; Lilelund et al. 2000; Singer et al. 2001; Lo & Erzurumlu, 2002; Corlew et al. 2004; Crepel et al. 2007).
In developing neurons of the rodent dorsal lateral geniculate nucleus (dLGN), the excitatory postsynaptic responses evoked by strong or repetitive stimulation of retinal ganglion cell axons are of sufficient strength to activate high-threshold L-type Ca2+ channels (Lo et al. 2002; Jaubert-Miazza et al. 2005; Liu & Chen, 2008). This activation gives rise to sustained (∼500 ms), high-amplitude (35–60 mV) depolarizations known as plateau potentials. These events are encountered frequently at early postnatal ages but decline with age, so that after natural eye opening (postnatal day (P) 14) plateau activity is rarely observed (Lo et al. 2002; Jaubert-Miazza et al. 2005). Such timing coincides with a number of important developmental events occurring in the dLGN, including the establishment of segregated retinal projections into eye-specific domains, the pruning of retinal inputs onto dLGN relay cells and the emergence of feed-forward inhibitory connections (Guido, 2008). Some aspects of this remodelling (e.g. eye-specific segregation) have been attributed to the wave-like patterns of spontaneous retinal activity (Torborg & Feller, 2005; Torborg et al. 2005; Huberman et al. 2008). However, the cellular mechanisms underlying the implementation of these activity-dependent changes remain largely unknown. Synaptically evoked plateau activity could figure prominently in the remodelling process. L-type Ca2+ channel activity has been implicated in long-term changes in synaptic strength of dLGN cells (Ziburkus et al. 2009), as well as intracellular signalling cascades involved in the refinement of retinogeniculate projections (Pham et al. 2001).
To elucidate the role of plateau potentials, it is important to gain insight into the mechanisms underlying their developmental regulation. The transient nature of these events remains somewhat puzzling. At the time when their incidence is high, individual retinal synaptic events are relatively weak (Chen & Regher, 2000; Hooks & Chen, 2006; Liu & Chen, 2008) and not capable of reaching or sustaining the requisite levels of membrane depolarization necessary to activate L-type channels (Hernandez-Cruz & Pape, 1989; Kammermeier & Jones, 1997, 1998). Moreover, by the time that plateau activity wanes, retinal synapses have matured (Bickford et al. 2010) and their currents are 7- to 10−fold larger (Chen & Regehr, 2000; Hooks & Chen, 2006), making them, in principle, sufficient to activate L-type activity. Thus, resolving this issue requires one to examine other aspects of dLGN development. One such element is the changing patterns of synaptic connectivity. Initially, dLGN cells are binocularly innervated, receiving excitatory input from as many as a dozen retinal ganglion cells (Chen & Regehr, 2000; Lo et al. 2002; Jaubert-Miazza et al. 2005; Hooks & Chen, 2006; Ziburkus & Guido, 2006). Indeed, their coordinated activation by periodic bursts of spontaneous retinal activity can lead to significant levels of membrane depolarization (Mooney et al. 1996). In contrast, by P14 many of these inputs have been eliminated, spontaneous retinal waves subside (Demas et al. 2003) and the net excitatory drive onto dLGN cells is greatly reduced (Lo et al. 2002; Liu & Chen, 2008). In addition to the pruning of excitatory connections, inhibitory circuits that involve GABAeric interneurons of the dLGN emerge, further limiting the degree of postsynaptic membrane depolarization (Ziburkus et al. 2003; Bickford et al. 2010). Another important element to consider is the expression of L-type Ca2+ channels in the developing dLGN. Based on immunostaining in dLGN, it appears that these channels are heavily expressed at early postnatal ages (Jaubert-Miazza et al. 2005) and thus may offer a greater opportunity for the activation of L-type activity at young ages. However, it remains to be tested whether such age-related modulation in channel density can affect the incidence of plateau potentials.
To consider how patterns of retinal stimulation as well as the underlying synaptic connectivity of the dLGN contribute to the activation of plateau potentials, we recorded the synaptic responses of developing relay cells in an acute thalamic slice preparation designed to preserve both retinal and intrinsic inhibitory feed-forward connections (Chen & Regher, 2000; Bickford et al. 2010). To assess whether L-type Ca2+ channel expression is a contributing factor, we made use of a transgenic mouse that lacks the β3 subunit of the L-type Ca2+ channel. These mutants have greatly attenuated L-type activity brought about by improper channel trafficking and kinetics (Birnbaumer et al. 1998; Namkung et al. 1998; Murakami et al. 2002; Shiraiwa et al. 2007). Finally, since many of the elements suspected to contribute to the activation of plateau potentials change around the time of natural eye opening (P14), we compared the incidence of plateau activity in dLGN cells before and after P14.
Methods
Ethical approval
All procedures were performed in compliance with the Institutional Animal Care and Use Committee at Virginia Commonwealth University. These experiments also comply with The Journal of Physiology policy and UK regulations on animal experimentation (Drummond, 2009). Sixty-three wild-type C57/BL6 mice and 37 mice of a transgenic strain bred on a C57/BL6 background that lacks the β3 subunit of the L-type Ca2+ channel (Namkung et al. 1998) were used. The mice were bred and housed in resident colonies and ranged in age from P7 to 22.
Slice preparation and in vitro electrophysiology
To examine the synaptic responses evoked by optic tract (OT) stimulation, an acute thalamic slice preparation which preserves retinal and intrinsic inhibitory connections in dLGN was adopted (Chen & Regehr, 2000; Bickford et al. 2010). Mice were deeply anaesthetized with isoflurane vapors (2–4%) in a closed chamber and decapitated. The brain was removed from the skull and immersed into an oxygenated (95% O2–5% CO2) 4°C sucrose solution (in mm: 28 NaHCO3, 23 sucrose, 11 MgSO4, 0.11 glucose, 2.75 KCl, 1.4 NaH2PO4, 0.5 CaCl2). The two hemispheres were then separated by cutting along the midline at an angle of 10–20 deg. The medial aspect of the brain was glued onto a tilted (20 deg) stage of a vibratome (Leica VT1000S) and 300 μm sections were cut in the parasagittal plane. Prior to recording, slices were incubated in a holding chamber containing an oxygenated artificial cerebral spinal fluid (ACSF) solution (in mm: 126 NaCl, 26 NaHCO3, 10 glucose, 2.5 KCl, 2 MgCl2, 2 CaCl2, 1.25 NaH2PO4) for 30 min at 35°C and then brought to room temperature. Individual slices containing the dLGN and a large segment of the optic tract were then transferred to a recording chamber maintained at 32°C, and perfused continuously at a rate of 2.0 ml min−1 with oxygenated ACSF.
In vitro recordings were done in a whole cell configuration with the aid of a fixed-stage microscope (Nikon E600FN) equipped with differential interference contrast optics and a water-immersion objective to view individual neurons within the slice. Patch electrodes were pulled vertically in two stages from borosilicate glass and filled with a solution (for current clamp recordings (in mm): 140 potassium gluconate, 10 Hepes, 2 MgATP, 0.3 NaCl, 0.1 NaGTP, pH 7.25, 260 mosmol l−1; for voltage clamp recordings: 130 caesium methanesulfonate, 10 Hepes, 10 QX-314, 5 KCl, 5 EGTA, 2 MgCl2, 0.1 CaCl2, 2 MgATP, 0.1 NaGTP, pH 7.25, 260 mosmol l−1). The final tip resistance of filled electrodes was 3–7 MΩ. Whole cell recordings were done using an Axoclamp 2B (current clamp) or AM Systems 2400 (voltage clamp) amplifier. Pipette capacitance, series resistance and whole cell capacitance were carefully monitored and compensated electronically during the recording. Neuronal activity was displayed on an oscilloscope (Hitachi VC-6025A), digitized 10–20 kHz through an interface unit (National Instruments BNC-2090) and stored directly on a computer. Data acquisition and analysis was accomplished by using free software (Strathclyde Electrophysiology Software, Whole Cell Analysis Program V3.8.2.). During some recordings, the GABA antagonists bicuculline (25 μm, Tocris 0131) and CGP (10 μm, Tocris 1248) were bath applied to block inhibitory activity. Nimodipine (30 μm, Tocris 0600) was also bath applied to block L-type Ca2+ channel activity.
To evoke synaptic activity in dLGN, square-wave pulses (0.1–0.3 ms, 1–1000 μA) were delivered at variable rates of (0.2–100 Hz) through a pair of thin-gauge tungsten wires (0.5 MΩ) positioned in the optic tract. The stimulating electrodes were connected to a stimulus isolation unit (World Precision Instruments Stimulus Isolator A360) that received input from a computer-controlled, multichannel pulse generator (World Precision Instruments PulseMaster A300) programmed to elicit specific conditioning protocols.
Estimates of retinal convergence were accomplished by generating EPSP amplitude by stimulus intensity plots (Fig. 2; see also Lo et al. 2002; Jaubert-Miazza et al. 2005; Ziburkus & Guido, 2006). These were constructed by first determining the minimum stimulus intensity needed to evoke a postsynaptic response. Once the single fibre response was determined, current intensity was increased in small increments (0.5 to 1.0 μA) until a response of maximal amplitude was consistently reached. A minimum of five responses was recorded at each stimulus intensity. A change in amplitude that was equal to or exceeded a value that corresponded to the cell's single fibre response was used to distinguish one input from another. For example, if the single fibre response was 1 mV, a value of at least 2 mV was needed to delineate the next input; for the subsequent step a value of 3 mV was needed. The estimates of retinal convergence obtained in the present study were in accord with those reported previously (Chen & Regehr, 2000; Lo et al. 2002; Jaubert-Miazza et al. 2005; Hooks & Chen, 2006; Ziburkus & Guido, 2006; Stevens et al. 2007).
Figure 2. Factors that regulate the incidence of plateau potentials in developing dLGN cells: retinal convergence and spatial summation.

A, examples of synaptic responses evoked by progressive increases in the stimulus intensity of OT stimulation at P11 (left) and P22 (right) dLGN cells. Single fibre responses are magnified below for clarity. Beneath each group of responses is the corresponding amplitude–stimulus intensity plot. At P11, a systematic increase in stimulus intensity (superimposed traces) leads to graded increases in EPSP amplitude. High levels of OT stimulation lead to the spatial summation of multiple inputs and the generation of a plateau potential (top most trace). At P22, the same stimulus protocol evokes a step-like increase in EPSP amplitude that gives rise to an EPSP with a Na+ spike riding its peak. For EPSP amplitude–stimulus intensity plots, each point depicts the peak amplitude of a single response. A minimum of five responses are recorded at each stimulus intensity. The horizontal lines reflect the calculated threshold between separate retinal inputs (see Methods). Estimated number of inputs at P11 is 8 and 2 at P22. Responses recorded at –60 mV in normal ACSF. B, plot showing the incidence of plateau potentials evoked with a single OT pulse encountered before and after P14. The incidence of plateaus was higher before P14 when developing dLGN cells tend to receive multiple retinal inputs.
Immunocytochemistry
To examine the labelling pattern in dLGN for L-type Ca2+ channels, slices were processed with either a standard Nissl protocol or incubated with one of two polyclonal rabbit antibodies: one directed toward the pore-forming α1C subunit of the CaV1.2 L-type Ca2+ channel, and the other toward the accessory β3 subunit (1:1000, Alomone Labs ACC-003, ACC-008). For tissue preparation, mice were deeply anaesthetized with isoflurane inhalation and transcardially perfused with phosphate buffered saline (PBS: 0.01 mm NaH2PO4, 0.9% NaCl, pH 7.4) and 4% paraformaldehyde in 0.1 m phosphate buffer. Tissue was post-fixed overnight and sectioned (70 μm) in the coronal plane. Sections containing the dLGN were pretreated (30 min) in 10% normal goat serum (NGS) in PBS and then incubated in their primary antibody solutions diluted in 1% NGS–PBS overnight at 4°C. The next day, tissue was rinsed in PBS and incubated at room temperature (1 h) in 1% NGS–PBS solution containing a biotinylated goat anti-rabbit (1:400, Sigma B8895) secondary antibody. Following a series of buffer rinses, tissue was incubated (1 h) in an avidin and biotinylated horseradish peroxidase (1:100, Vector Labs B-2004) 1% NGS–PBS solution. Sections were then reacted with a nickel-intensified diaminobenzidine (DAB) solution (1–2 min), washed in sodium acetate, mounted on slides, dehydrated, and cover slipped for light microscopy. Digital images of labelled cells were acquired with a Kodak CD 290 camera mounted on the head of a Nikon Labophot light microscope. Cell density measurements were carried out as reported previously (Jaubert-Miazza et al. 2005). Labelled cells were included if their nucleus or a continuous cell membrane was readily discerned in a given focal plane. Cell density measurements were computed by counting labelled cells in a 100 μm2 area within the centre of dLGN in two sections of five separate mice. These sections were also used to obtain maximal length and width measurements of dLGN.
Western blots
To examine protein expression of L-type Ca2+ channels, mice were deeply anaesthetized with isoflurane inhalation and decapitated. The brain was removed from the skull and immersed into an oxygenated 4°C saline solution (in mm: 126 NaCl, 10 glucose, 2.5 KCl, 2 MgCl2, 2CaCl2, 1.25 NaH2PO4). The dLGN from both hemispheres was dissected from 400-μm-thick coronal sections. Tissue was placed in a sucrose buffer (320 mm with 2% Complete Protease Inhibitor, Roche Diagnostics 11836153001) and stored at –80°C. Each sample contained dLGNs from four mice. Tissue was defrosted on ice, homogenized in sucrose buffer and the total protein concentration was determined using the Quick Start Bradford protein assay kit (Bio-Rad 500-0207). Protein from each sample (30 μg) was loaded onto a Criterion 10% or gradient 4–20% Tris-HCl polyacrylamide gel (Bio-Rad 345-0009 and -0032, respectively). The protein was transferred overnight at 4°C to a nitrocellulose membrane (Bio-Rad 162-0115). Membranes were blocked with 5% powdered milk in Tris-buffered saline with Tween 20 (TBST, 1 h), then incubated (1.5 h) with antibodies directed towards various subunits of the L-type Ca2+ channel: α1C, α1D, β3 (1:200, Alomone Labs AAC-003, -005 and -008, respectively), β1b, β2 and β4 (1:250, a generous gift from Kevin Campbell) in 5% BSA in TBST. GAPDH (1:100,000; Cell Signalling 2118) was used as a loading control. The membranes were washed with Tris-buffered saline and treated with the secondary antibody, peroxidase goat anti-rabbit (1:10,000, Jackson ImmunoResearch 111-035-003), in TBST (1.5 h) at room temperature. SuperSignal West Pico chemiluminescent detection reagent (Pierce 34077) was used to visualize immunoreactivity. Analysis was performed using Kodak 1D Image Analysis software.
Results
We studied the synaptic responses evoked by OT stimulation for 243 dLGN cells in mice that were 7–22 days old. Of these, 121 were recorded from wild-type (WT) and 122 from transgenic mice lacking the β3 subunit of the L-type Ca2+ channel (Namkung et al. 1998). For Figs 2–6, 9 and Table 1, cells are divided into two age groups: before P14 (P7–13) and after P14 (P14–22). All cells had resting membrane levels between –56 and –68 mV, overshooting action potentials and an input resistance of ≥200 MΩ. Measurements of time constants for cells recorded before and after P14 were similar (Table 1). However, as previously reported, input resistance decreases with postnatal age (Table 1; MacLeod et al. 1997).
Figure 6. Western blot analysis of developmental changes in L-type Ca2+ channel subunit expression in WT mice.

Western blots of dLGN tissue before and after P14 using antibodies directed to the pore-forming α1C and α1D subunits as well as the β3 accessory subunit, using GAPDH as a loading control (left). Right, a plot of the change in density measurements of each subunit with age, expressed as percentage of before P14. There was a decrease (35–40%) in the expression of all three subunits after P14.
Figure 9. Electrophysiological composition of dLGN in WT and β3 null mice.
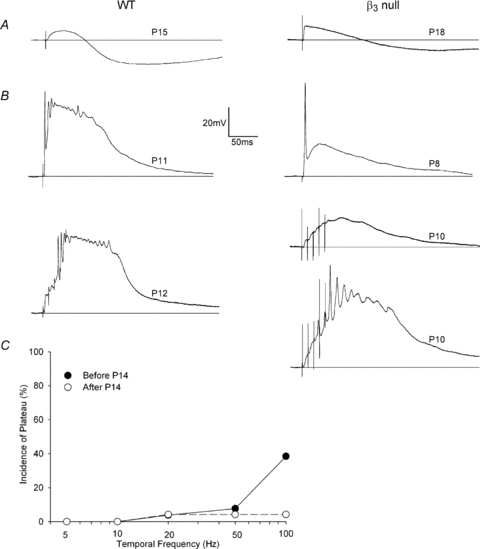
A and B, examples of synaptic responses evoked by OT stimulation at different postnatal ages for WT and β3 null dLGN cells. A, single pulse OT stimulation (WT P15, β3 null P18) evokes an EPSP followed by IPSP activity. B, at early postnatal ages (WT P11 and P12, β3 nulls P8 and two P10s), a single pulse (top) or a train of 5 at 100 Hz (bottom) readily evokes plateau activity in WT (left). In β3 nulls (right), plateau activity is rare. Responses in A and B recorded at –60 mV in normal ACSF. C, plot showing the percentage of cells that exhibited a plateau potential as a function of temporal frequency, before (filled circles) and after P14 (open circles) for cells recorded in β3 null mice. Overall, the incidence of plateau activity was rare even before P14 and when high rates of stimulation were used.
Table 1.
Intrinsic membrane properties
| Property | WT | β3 null |
|---|---|---|
| Time constant (ms)* | ||
| Before P14 | 47.5 ± 2.5 (24) | 50.5 ± 3.4 (24) |
| After P14 | 43.1 ± 3.0 (28) | 43.7 ± 3.3 (25) |
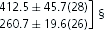
| Input resistance (MΩ) | ||
| Before P14After P14 |  |
 |
| Low-threshold Ca2+ spike | ||
| Before P14 | 94.3% (33) | 95.8% (27) |
| After P14 | 100.0% (26) | 100.0% (36) |
| Low-threshold Ca2+ burst | ||
| Before P14 | 35.7% (28) | 31.8% (24) |
| After P14 | 46.7% (30) | 48.0% (25) |
| Mixed cation conductance | ||
| Before P14 | 78.1% (32) | 84.0% (25) |
| After P14 | 88.0% (25) | 93.9% (33) |
| A-type K+ conductance | ||
| Before P14 | 93.7% (32) | 84.3% (24) |
| After P14 | 86.7% (23) | 94.7% (19) |
The mean ±s.e.m. or per cent incidence for each property are shown, with number of cells in parentheses. Statistical analysis of the means for each property was calculated using a Student's t test and significant differences are indicated by § (P < 0.01). Statistical analysis of the percent incidence for each property was calculated using a χ2 test. None of the values are statistically different.
We were able to fit 90% to a single exponential curve.
Figure 1 illustrates the basic features of synaptically evoked plateau potentials in dLGN (see also Lo et al. 2002; Jaubert-Miazza et al. 2005). These events, which prevail at early postnatal ages, are defined as long-lasting (100–500 ms), high-amplitude (35–60 mV), slow-decaying depolarizations. Riding the crest of this response is a train of action potentials of variable amplitude and duration. Plateau potentials can be activated when the OT is stimulated with single (Fig. 1A, left) or repetitive pulses (Fig. 1B–D, left). They are mediated by the voltage-dependent activation of high-threshold L-type Ca2+ channels. Bath application (n= 7 cells) of L-type Ca2+ channel antagonists such as nimodipine (Fig. 1A and B, right) block the activation of plateau potentials while leaving the underlying synaptic events intact. Moreover, plateau potentials persist and remain relatively unaltered after the application of the antagonist APV (n= 6 cells), indicating that NMDA-mediated activity does not contribute to these events (Fig. 1C). At resting levels (e.g. −60 mV Fig. 1D, left), EPSP activity provides an adequate amount of depolarization to activate plateau activity; however, when hyperpolarized (e.g. −95 mV, Fig. 1D, right top) by DC current injection, these events are no longer sufficient for L-type activation. In fact, when nimodipine is applied at these hyperpolarized levels (Fig. 1D, right bottom), postsynaptic activity remains unaffected. Finally, in some instances at young postnatal ages, nimodipine-sensitive plateau-like depolarizations could be evoked by depolarizing current injection (5 of 35 cells, 14%; Fig. 1E; also see MacLeod et al. 1997).
Figure 1. Features of synaptically evoked plateau potentials in developing dLGN cells: pharmacology, spatial and temporal summation, and voltage dependency.
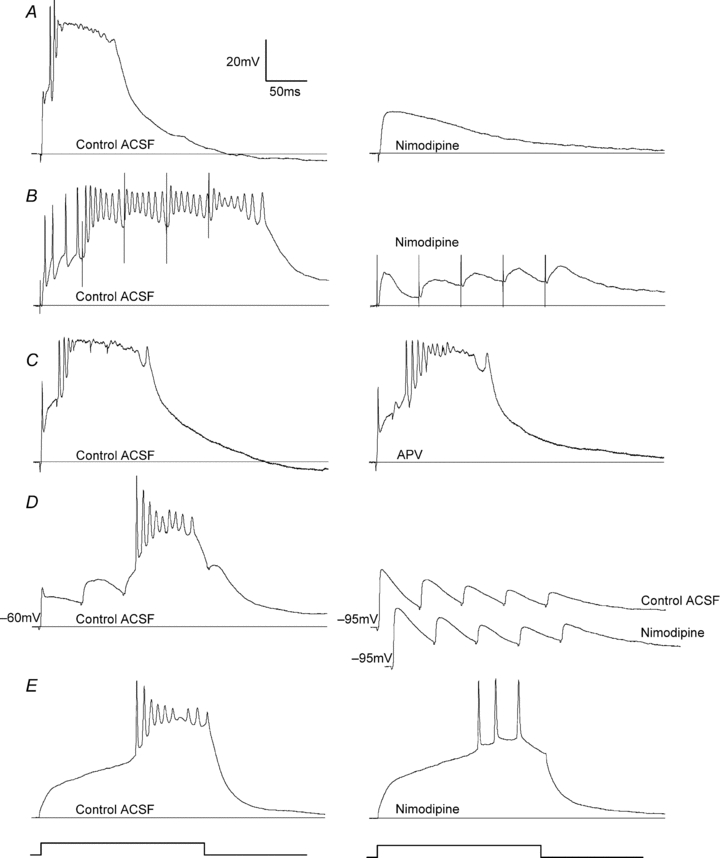
A, synaptic responses of a P12 dLGN cell triggered by a single electrical pulse (300 μA) delivered to the optic tract (OT) in normal ACSF (left) and after bath application of the L-type Ca2+ channel antagonist nimodipine (right). In normal ACSF, OT stimulation evokes a plateau potential, characterized as a fast-rising, high-amplitude (≥35 mV) sustained depolarization (∼500 ms) that has a burst of inactivating sodium spikes riding its crest. Bath perfusion of nimodipine blocks the plateau potential but leaves the underlying EPSP intact. B, synaptic responses at P14 evoked by repetitive stimulation (5 pulses at 20 Hz), before (left) and after bath-applied nimodipine (right). In normal ACSF, repetitive stimulation evokes a large and sustained plateau potential. Bath perfusion of nimodipine blocks the plateau potential, leaving the summating EPSPs intact. C, responses at P14 evoked by repetitive stimulation (5 pulses at 50 Hz), before (left) and after bath application of the NMDAR antagonist APV (right). The plateau potential remains in the presence of APV. Responses in A–C recorded at –60 mV. D, synaptic responses at P9 evoked by repetitive OT stimulation (5 pulses at 20 Hz) at –60 mV (left) and –95 mV (top right), and in the presence of nimodipine (bottom right). Membrane levels were controlled by injecting DC current through the recording electrode. At the relatively depolarized level of –60 mV, the temporal summation of EPSPs gives rise to a plateau potential. At the more hyperpolarized level of –95 mV, the same form of stimulation produces a large postsynaptic response but fails to activate L-type channels and evoke a plateau potential. Application of nimodipine has no effect on the underlying EPSP activity. E, injection of 0.1 nA current step for 200 ms (depicted below traces) evokes a plateau potential at P9 (left). Application of nimodipine reduces the amplitude of the depolarization and gives rise to a train of Na+ spikes (right).
Figs 2 and 3 highlight how the sustained depolarization associated with the spatial and temporal summation of retinally evoked EPSPs leads to the activation of plateau potentials. To illustrate the effects of spatial summation, responses to a single shock of varying stimulus intensity were used (Fig. 2). At young ages (P11, Fig. 2A, left), a progressive increase in stimulus intensity led to graded increases in EPSP amplitude that eventually gave rise to a plateau potential. By contrast, at late ages (P22, Fig. 2A, right) this protocol produced a few step-like changes in EPSP amplitude, but, rather than a plateau potential, a single Na+ spike emerged. Whether graded or step-like, these increases in EPSP amplitude brought about by increasing stimulus intensity are taken to reflect the recruitment of multiple retinal inputs converging onto a single dLGN cell (Chen & Regehr, 2000; Jaubert-Miazza et al. 2005; Hooks & Chen, 2006). The corresponding EPSP amplitude by stimulus intensity plots can then be used to obtain estimates of retinal convergence (see Methods for details). The plots in Fig. 2 reveal that a cell recorded at P11 had at least eight retinal inputs whereas in a P22 cell only two were observed. As dLGN cells tend to receive far more retinal inputs prior to eye opening (Chen & Regehr, 2000; Jaubert-Miazza et al. 2005; Hooks & Chen, 2006), their summation and resulting depolarization should increase the likelihood of generating a plateau potential. In fact, as shown in Fig. 2B, before the time of natural eye opening (before P14), a single high-intensity stimulus evoked a plateau in 18 of 38 cells (47%). However, after P14, none of the 24 cells tested exhibited plateau activity (χ2 test: P < 0.0001).
Figure 3. Factors that regulate the incidence of plateau potentials in developing dLGN cells: temporal summation.
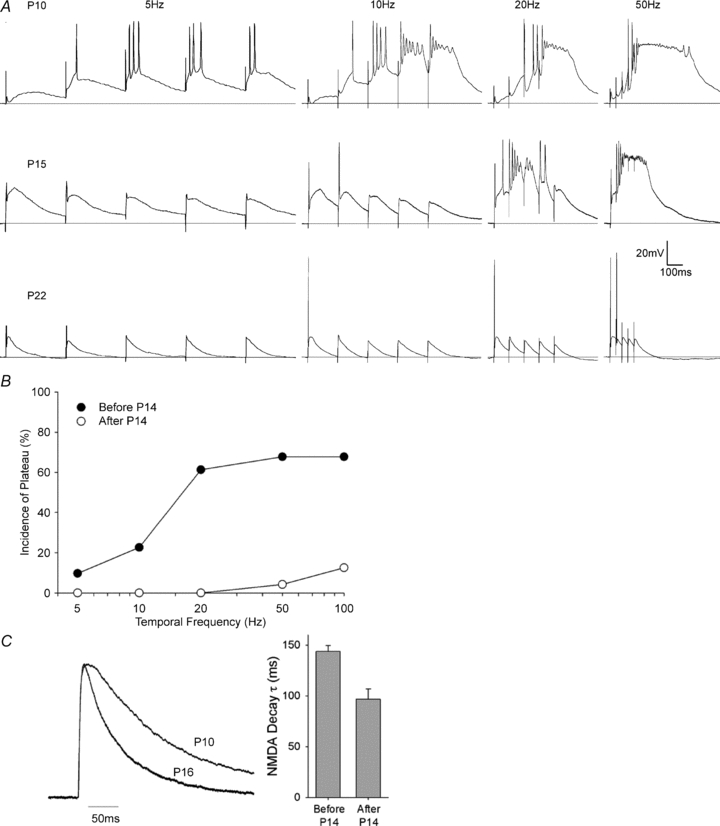
A, examples of synaptic responses evoked by 5 pulses of repetitive (5, 10, 20 and 50 Hz) OT stimulation at three different postnatal ages (P10, P15, P22). At P10, plateau potentials are evoked when stimuli as low as 10 Hz are used, whereas at P15, 20 Hz is needed, and at P22 even a 50 Hz train could not activate a plateau potential. Responses recorded at –60 mV in normal ACSF. B, plot showing the percentage of cells that exhibited a plateau potential as a function of temporal frequency, before (filled circles) and after P14 (open circles). Each cell was tested at 5, 10, 20, 50 and 100 Hz. Before P14, the incidence of plateau potentials was higher at all temporal frequencies. C, representative NMDAR current traces at P10 and P16 (right). Traces are normalized to peak current to highlight changes in decay time. τ values were determined with a single exponential fit (0 to 500 ms) while holding cells at +40 mV (Hooks & Chen, 2006). Plot showing mean and s.e.m. decay τ values (ms) before and after P14 (left). Decay times are slower before P14.
A similar age-related pattern emerged when EPSPs summate in the temporal domain. To illustrate the effects of temporal summation, responses to repetitive stimuli varying in temporal frequency (5, 10, 20, 50 and 100 Hz) were used (Fig. 3A). For these recordings, stimulus intensity was held constant at a value that yielded an EPSP of half-maximal amplitude. At all ages, increasing temporal frequency led to an increase in the incidence of plateau potentials. However, at young ages (P10, top), plateau potentials could be evoked even at relatively low temporal frequencies (e.g. 10 Hz). By contrast, at older ages (P15, centre) higher temporal frequencies were needed to evoke plateaus, and for many cells (P22, bottom) they became difficult to evoke even at the highest temporal frequency tested (100 Hz). These effects are summarized in Fig. 3B, which plots the incidence of plateau potentials as a function of temporal frequency. The incidence of plateau potentials evoked by repetitive stimulation was significantly higher before (21 of 31 cells, 68%) than after P14 (3 of 24 cells, 13%; χ2 test: P < 0.0001). Moreover, before P14, within single cells, the incidence of plateau potentials increased as a function of temporal frequency, from 10% at 5 Hz to over 60% at 20, 50 and 100 Hz. Conversely, after P14, repetitive stimulation failed to evoke plateau potentials at frequencies up to 20 Hz and, even at 100 Hz, plateaus were rarely observed (13%). Such efficacy with low rates of stimulation at early ages can in part be attributed to the long decay time of the NMDA-mediated component of the EPSP (Scharfman et al. 1990; Lo et al. 2002), which is best illustrated in the responses evoked using 5 Hz stimulus (Fig. 3A). In order to fully consider these effects, we conducted voltage clamp recordings at +40 mV to observe the outward currents of NMDA receptors (NMDARs). Consistent with previous reports, relay cells recorded before P14 showed significantly slower decay times (Fig. 3C; 144.0 ± 5.6 ms) compared to cells recorded after P14 (96.7 ± 10.1 ms, one-way ANOVA: P < 0.0001). As a result, the depolarization from EPSPs recorded at younger ages is prolonged, thereby increasing the likelihood that subsequent stimuli will more readily lead to L-type activation.
Taken together, these results suggest that the spatial and temporal summation of EPSPs contribute to the activation of plateau potentials, and that these events are far more likely to occur at early postnatal ages when dLGN cells exhibit a high degree of retinal convergence. When this relationship was assessed directly for a group of 30 cells (Fig. 4), those with five or more retinal inputs, 87% (13 of 15 cells) exhibited a plateau potential, all of which were from young postnatal mice (before P14). By contrast, 80% (12 of 15) of cells with one to four inputs failed to display a plateau potential, nine of which were from late postnatal mice (after P14). It should be noted that our quantification of retinal inputs is an estimate, and that the relationship between the degree of retinal convergence and the likelihood of plateau potential activation simply indicates that plateau potentials are more common in immature cells, that is, dLGN cells that receive several retinal inputs and have graded stimulus intensity by amplitude plots (as in Fig. 2A, left).
Figure 4. Relationship between postnatal age, degree of retinal convergence, and incidence of plateau potentials.

Cumulative frequency plot showing the estimated number of inputs for a given dLGN cell. Each point represents a single cell. Large circles and the dashed line delineate cells that exhibited plateau potentials (PP) with single or repetitive stimulation, whereas small circles and the continuous line depict cells in which plateau activity was absent. Filled and open symbols specify cells that were recorded before and after P14, respectively. Plateau potentials tended to occur before P14 and in cells that receive more than 4 inputs.
It is important to note that the present results were obtained in current clamp mode. Thus, the estimates of retinal convergence derived from the stimulus intensity by amplitude plots (Fig. 2A) may be influenced by non-synaptic factors such as changes in ionic driving force and/or contributions from the activation of voltage-gated channels. Indeed, such non-linearities could potentially affect EPSP amplitude. Nonetheless, the impact of these potential effects would be similar for cells recorded before and after P14 (see Table 1; MacLeod et al. 1997). Furthermore, while we acknowledge that there are a number of ways to assess retinal convergence, the developmental changes in the estimates reported here are in full accord with others obtained previously either in current clamp (Lo et al. 2002; Jaubert-Miazza et al. 2005; Ziburkus & Guido, 2006) or voltage clamp mode (Chen & Regehr, 2000; Hooks & Chen, 2006; Stevens et al. 2007).
Another factor that can regulate the degree of postsynaptic depolarization is the inhibitory activity arising from feed-forward connections between intrinsic interneurons and relay cells (Crunelli et al. 1988; Ziburkus et al. 2003; Blitz & Regehr, 2005). At late postnatal ages (after P14), OT stimulation often evokes an EPSP followed by IPSP activity (Bickford et al. 2010). As shown in Fig. 5A, inhibitory responses typically contain two hyperpolarizing components, an early, short-duration IPSP that is blocked by the GABAA antagonist bicuculline and a slower, long-duration IPSP that is blocked by the GABAB antagonist CGP. Here, we studied how the emergence of the predominant form of inhibition, the GABAA-mediated IPSP, affects the activation of plateau potentials. After P14, OT stimulation with either a single (Fig. 5B, left) or repetitive (Fig. 5C, left) pulses evoked IPSP activity. The inhibitory response limits the amplitude and duration of the preceding EPSP and the cell fails to activate plateau activity. However, when bicuculline is applied and GABAA inhibition eliminated, the same form of stimulation led to a plateau potential (Fig. 5B and C, right; n= 7). These effects are summarized in Fig. 5D and E which plot the incidence of plateau potentials recorded in the presence of bicuculline at ages before and after P14. Before P14, the incidence of plateau potentials evoked by single (13 of 26 cells, 50%) or repetitive stimulation (21 of 26 cells, 81%) was similar to those recorded in control ACSF (Fig. 2B, single pulse 47%; Fig. 3B, repetitive pulses 68%). However after P14, bicuculline application led to a significant increase in the incidence of plateau potentials for both single (Fig. 5D; bicuculline 2 of 20 cells, 10%vs.Fig. 2B, control ACSF 0%; χ2 test: P < 0.01) and repetitive (Fig. 5E; bicuculline 8 of 23 cells, 35%; vs.Fig. 3B, control ACSF 13%; χ2 test: P < 0.001) forms of stimulation. However, this increase observed at older ages did not approach levels recorded before P14 (χ2 tests: single and repetitive pulses: P < 0.0001).
Figure 5. Factors that regulate the incidence of plateau potentials in developing dLGN cells: feed forward inhibition.

A, example of synaptic response recorded at P13 before (control ACSF, left) and after the bath application of the GABAA antagonist bicuculline (centre), and the GABAB antagonist CGP (right). In control ACSF, the synaptic response contains an EPSP followed by IPSP activity that has two components: an early fast one (GABAA) followed by a slower, longer one (GABAB). Bicuculline blocks the early IPSP and increases the size and duration of the preceding EPSP. CGP eliminates the late IPSP and further increases the amplitude and duration of the EPSP. B, example of synaptic responses recorded at P14 before (control ACSF, left) and after bath application of bicuculline (25 μm, right). In control ACSF, a single electrical pulse applied to OT generates a postsynaptic response that has a Na+ spike riding the peak of the EPSP–IPSP pair. With the addition of bicuculline, OT stimulation leads to a plateau potential. C, example of another cell's response at P14 before (control ACSF, left) and after the bath application of bicuculline (25 μm, right). A train of 3 pulses delivered at 20 Hz evokes a complex response that contains a Na+ spike and EPSP and IPSP activity. Again, the addition of bicuculline gives rise to a plateau potential. Responses in A–C recorded at –60 mV. D, plot showing the incidence of plateau activity evoked by single OT stimulation in the presence of bicuculline, before and after P14. E, similar plot showing plateau activity evoked by repetitive OT stimulation in bicuculline (Bic), before (filled circles) and after (open circles) P14. For comparison, the incidence of plateau potentials in control ACSF is plotted in grey (Ctr, as in Fig. 3B). After P14, bicuculline led to an increase in the incidence of plateau activity.
To examine the age-related decrease in the expression of the L-type Ca2+ channel reported by others (Jaubert-Miazza et al. 2005), we performed Western blot analysis in homogenized dLGN using antibodies directed to two pore-forming subunits, α1C (240 kDa), α1D (255 kDa) and the ancillary β3 (55kDa) of the L-type Ca2+ channel (Fig. 6). After P14 (n= 6) the protein expression level of these subunits fall to about 35–40% compared to values obtained before P14 (n= 6). Whether this age-related decrease has a direct impact on the incidence of plateau potentials has not been explored. To address this, we made use of a mutant mouse in which the structural and functional features of L-type Ca2+ channels are disrupted, leading to greatly reduced L-type currents (Namkung et al. 1998). This was accomplished by the targeted deletion of the β3 accessory subunit, an element that is critical for proper channel kinetics, assembly and membrane insertion (Dolphin, 2003). In order to assess L-type Ca2+ channel expression in β3 null mice, we performed immunocytochemistry and Western blot analysis in dLGN (Fig. 7). In WT mice, both β3 and α1C labelling was evenly distributed throughout dLGN. High-power views of dLGN labelled cells also confirmed that staining was confined largely to the somata and proximal dendrites. To best illustrate the stark contrast in β3 staining between WT and β3 null mice, Fig. 7A presents the labelling pattern in a P28 WT, which has a relatively low density of staining compared to younger WT mice, to that of a P7 β3 null. As expected in β3 null mice, β3 labelling was completely absent. In addition, the staining for α1C was severely reduced in the β3 null (Fig. 7B). At P7 there was a 60% reduction in the density of labelled dLGN cells compared to age-matched WT mice (Fig. 7C, n= 5 WT, mean = 25 cells 100 μm−2vs. n= 5 β3 null, mean = 10 cells 100 μm−2; Student's t test: P < 0.0001). Western blots (Fig. 7D) of dLGN from WT (n= 4) and β3 null (n= 5) mice at P10 showed a similar pattern. WT tissue exhibited strong expression of α1C, α1D and β3 whereas in β3 nulls, the expression of α1C and α1D was greatly reduced and β3 was absent. When α1C protein levels were quantified against a GAPDH loading control, β3 nulls exhibited a 64% reduction compared to WT (Fig. 7E). Furthermore, when the rest of the β subunits (β1b (57.9 kDa), β2 (68.2 kDa) and β4 (58.0 kDa)) were analysed, the protein levels were similar to those in WT (Fig. 7D), indicating that they do not show any form of compensation in response to the loss of β3.
Figure 7. Immunocytochemistry and Western blot analysis of L-type Ca2+ channel subunits in the dLGN of WT and β3 null mice.

A and B, representative coronal sections in dLGN (outlined with dashed line) showing the cellular labelling pattern obtained with antibodies directed toward the ancillary β3 (A; P28 WT, P7 β3 null) or the pore-forming α1C subunit (B; P7 WT and β3 null) in WT and β3 null mice. Note that at P7, cells are much smaller (40–60 μm2vs. 80–100 μm2 in the adult), and that the staining encompasses both soma and proximal dendrites. In the adult WT (A, left) the labelling forms a ring around the soma and proximal dendrites (Jaubert-Miazza et al. 2005). To ensure there was no β3 staining in the β3 null (A, right), the DAB reaction time was extended. Note the dense staining of non-specific immunoreactivity in the optic tract and surrounding neuropil. Mean and s.e.m. of density of cells labelled for α1C at P7 in WT (n= 5) and β3 null (n= 5) mice are shown in C. β3 nulls show an absence of β3 labelling and a 60% reduction in the density of cellular labelling for α1C. High-power images from sections shown above, images acquired with same exposure times. Scale bar: low power, 100 μm; high power, 10 μm. D, Western blots of P10 dLGN tissue using the same antibodies in addition to ones for the pore-forming α1D subunit and the alternative β subunits (β1b, β2 and β4). An antibody directed toward GAPDH was used as a loading control. E, plot showing density measurements of L-type Ca2+ channel subunit protein levels, expressed as a percentage of WT. In β3 nulls, α1C showed a 70% reduction and α1D a 40% reduction when compared with WT, β3 expression was absent, and the expression of the other β subunits was similar to WT.
While β3 null mice show a highly reduced expression of L-type Ca2+ channels, the structural composition of dLGN was indistinguishable from WT. For example, as shown in Fig. 8A, Nissl stains did not reveal any gross abnormalities in the cytoarchitecture of dLGN and adjacent thalamic nuclei. In addition, cell density measurements and the overall size of dLGN were similar in WT (n= 5 mice) and β3 nulls (n= 5 mice, Fig. 8B). Thus, these observations are consistent with other reports showing that the structural and functional composition of a number of identified central structures, including the retina, are largely similar to WT (Ball et al. 2002; Shiraiwa et al. 2007; Jeon et al. 2008).
Figure 8. Cytoarchitecture of dLGN and surrounding nuclei in WT and β3 null mice.

A, representative coronal sections through dLGN showing Nissl stained cells in WT (left) and β3 null mice (right). Magnified images (100 μm2) taken from indicated area inset. Outlines indicate borders of dLGN and ventral lateral geniculate nucleus. Cytoarchitecture of β3 null dLGN is similar to WT. Scale bar: low power, 100 μm; high power, 25 μm. B, plots showing cell counts (left) and measurements of dLGN length and width (right) revealed no abnormalities in β3 nulls (grey) as compared to WT (black).
The reduced expression of the α1C subunit in β3 null mice had a direct consequence on the incidence of plateau activity. Synaptically evoked plateau potentials in β3 nulls were rarely observed (Fig. 9B and C). A single shock delivered to OT was never able to evoke plateau activity even at early ages or when high levels of stimulation were used (before P14, 0 of 26 cells; after P14, 0 of 24 cells). When repetitive stimulation was used, the encounter rate of plateau activity for 26 cells recorded before P14 was only 8% for 50 Hz and 38% for 100 Hz stimuli compared to values of 68% for WT (Fig. 3B, χ2 tests: 50 and 100 Hz: P < 0.0001). For cells recorded after P14, the incidence of plateau potentials evoked by maximal repetitive stimulation was only 4%. These losses are not likely to be due to any functional abnormalities since dLGN cells from β3 nulls possess many of the membrane properties and synaptic responses found in WT (Table 1, Fig. 10). The voltage responses to intracellular current injection revealed similar patterns of rectification. Additionally, β3 null cells possessed a mixed cation conductance (H) that gave rise to strong inward rectification and depolarizing sag, rebound low-threshold Ca2+ spikes (LT) and burst firing (B), an outward rectification that resulted in a delay in spike firing (A) and spike frequency accommodation (afterhyperpolarization, AHP). Synaptic responses evoked by OT stimulation were also similar to WT and were comprised of EPSPs followed by IPSP activity (Fig. 9A). The decay times of NMDARs in β3 nulls were similar to age-matched WTs (τ: before P14: 145.5 ± 3.6, n= 37 cells; after P14: 87.4 ± 4.9, n= 35 cells; see Fig. 3C for WTs), as was the incidence of IPSP activity (P7–11: 16%; P12–15: 48%; P16–20: 79%; P20+: 94%; total n= 109 cells; see Bickford et al. 2010 for WTs).
Figure 10. Membrane properties of WT and β3 null relay cells.
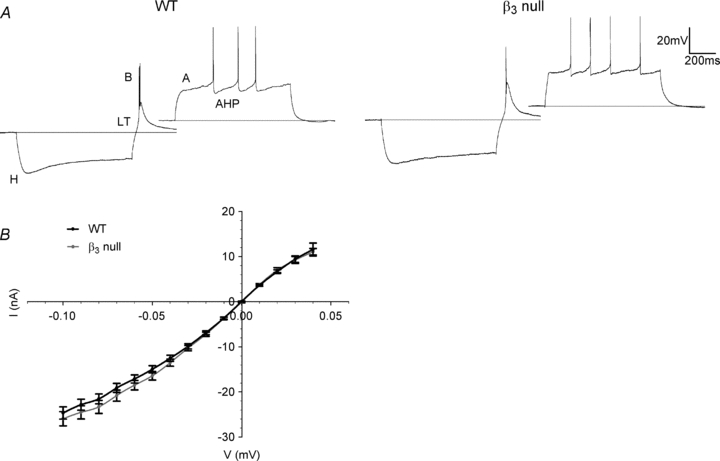
A, examples of voltage responses to current pulse injections from dLGN cells recorded in WT and β3 null mice. In both strains, a number of active membrane properties were present. Membrane hyperpolarization (–0.1 nA) activates a mixed cation conductance (H) and produces an inward rectification. Termination of the hyperpolarizing current pulse leads to the activation of low-threshold Ca2+ conductance (LT) and burst response (B). Membrane depolarization (0.1 nA) activates a number of K+ conductances (A, AHP) which lead to an outward rectification and causes a delay in action potential firing. B, plot of averaged voltage responses to 900-ms-long current step injections (step size, 0.01 nA) for WT (black, n= 52) and β3 null (grey, n= 47) cells at ≥P8. Both curves showed a similar amount of membrane rectification.
Discussion
We have shown that a number of converging events contribute to the developmental regulation of plateau potentials. These include the degree of retinal convergence, the pattern of retinal stimulation, the maturation of inhibition and the density of functional L-type Ca2+ channels. Indeed, these elements undergo dramatic changes around the time of natural eye opening (Guido, 2008), thereby restricting the prevalence of plateau activity to the first 2 weeks of postnatal life. In the ensuing discussion we address each of these factors separately and then how the interplay between them regulates the generation of plateau potentials.
Excitatory synaptic connections undergo substantial pruning during the first few weeks of postnatal life such that the number of retinal inputs onto single dLGN cells is greatly reduced (Guido, 2008). At early ages (before P14), when the degree of retinal convergence is high, plateau potentials were readily evoked. Experiments in which the stimulus intensity and temporal frequency of OT stimulation were varied revealed that the summation of these convergent inputs was sufficient to activate plateau activity. In fact, at early ages, the summation of responses for cells with five or more inputs almost always led to plateau activity. Although each individual excitatory response is weak at this age (Chen & Regher, 2000), when summation occurs it leads to large, long-lasting depolarizations (Lo et al. 2002; Jaubert-Miazza et al. 2005; Liu & Chen, 2008) that seem to favour the voltage- and time-dependent requirements for L-type Ca2+ channel activation (Kammermeier & Jones, 1997). Indeed, the underlying composition of these glutamatergic events are dominated by NMDA receptors that possess a subunit composition promoting a relaxed voltage dependency, slower decay kinetics and increased synaptic charge transfer (Liu & Chen, 2008). In fact, the long decay times of NMDA receptor currents seem to augment summation, especially at low temporal rates, leading to high levels of depolarization and plateau activation. By the second postnatal week, when dLGN cells receive far fewer retinal inputs, plateau activity was rarely observed. Despite the reduced convergence, individual retinal inputs are relatively strong and, in most cases, the peak amplitude of their synaptic current exceeds that of developing dLGN cells (Hooks & Chen, 2006). However, unlike the responses of early postnatal cells, those at older ages are dominated by fast, short-duration AMPA receptor activation that has reduced charge transfer (Liu & Chen, 2008).
The pruning of retinal inputs is also accompanied by the maturation of intrinsic inhibitory circuits. Both ultrastructrual and electrophysiological observations reveal that few, if any inhibitory synapses are present at young ages (Ziburkus et al. 2003; Bickford et al. 2010). However, by eye opening (P14), a feed-forward circuit involving retinal axons that innervate both intrinsic interneurons and relay cells is present. When this circuit is activated by OT stimulation, relay cells exhibit EPSPs that are followed by robust inhibitory responses (Crunelli et al. 1988; Lo et al. 2002; Ziburkus et al. 2003; Blitz & Regehr, 2005; Bickford et al. 2010). Our pharmacological experiments reveal that blocking the GABAA component of this inhibition increases the duration and amplitude of retinally evoked EPSPs. For cells recorded at older ages (after P14), this heightened depolarization can lead to a modest increase in the incidence of plateau activity; however, it still remains significantly lower than the incidence recorded at early ages. Thus, the emergence of inhibition per se cannot fully account for the age-related decrease in plateau activity.
Finally, we examined the expression of the L-type Ca2+ channels as a contributing factor by utilizing a transgenic mouse in which the ancillary β3 subunit of the L-type Ca2+ channel has been deleted. Previous studies indicate that β subunits play an important role in channel kinetics (Birnbaumer et al. 1998) and membrane insertion of L-type Ca2+ channels (Bichet et al. 2000), and that the targeted deletion of the β3 subunit results in a significant reduction in the L-type current. Estimates obtained in isolated dorsal root ganglion cell preparations reveal about a 60% reduction in the peak amplitude of the L-type Ca2+ current (Namkung et al. 1998). Although we did not measure L-type current directly in the dLGN of β3 nulls, we found that protein expression levels of the pore-forming α subunits to be reduced by 70% (α1C) and 40% (α1D) compared to age-matched WTs. Moreover, synaptically evoked plateau potentials were rarely observed in these mutants even at early ages or when repetitive stimulation was used. Thus, these experiments reveal that overall channel density and functional expression affect plateau activity. Interestingly, a similar scenario may occur during development. Both Western blot analysis and immunostaining reveal that the density of L-type channels is highest at early ages, but then declines with age (see also Jaubert-Miazza et al. 2005).
While all of these events are contributing factors, it is difficult to assess how each, by itself, regulates the generation of plateau potentials. Nonetheless, it is our belief that no one single variable is solely responsible. Clearly, overall L-type Ca2+ channel expression is an overriding factor. However, we still are able to modulate the incidence of plateau activity during conditions of both high and low channel expression. For instance, during the peak of L-type expression (before P14), the incidence of plateau activity can be altered by summating post-synaptic events either in the spatial or temporal domain thus underscoring the importance of excitatory retinal convergence. Moreover, at a time when L-type expression is relatively low (after P14), the removal of inhibition leads to a substantial increase in incidence of plateau activity, suggesting that inhibition curtails the degree of depolarization needed to activate these events. Perhaps the latter is not surprising since even mature thalamic relay cells possess robust L-type Ca2+ currents (Hernandez-Cruz & Pape, 1989; Kammermeier & Jones, 1997; Zhou et al. 1997; Budde et al. 1998). The relationship between overall channel expression and the maturation of retinogeniculate circuitry is further underscored when one considers the incidence of plateau potentials in β3 nulls. First, plateaus in β3 nulls are rare, but clearly more prevalent at young ages when factors such as retinal convergence and the lack of inhibition seem to have their greatest impact. Indeed, at late ages, when inhibition is peaking, far fewer plateau potentials are evoked in these mutants. Second, although L-type expression is lower in young postnatal β3 nulls than in late postnatal WTs, the incidence of plateau potentials is actually higher in the mutants. This suggests that despite the low levels of channel expression, the functional state of early geniculate circuitry can still promote plateau activity.
In the adult dLGN, L-type activity has been reported to play a role in signal transmission by regulating cellular excitability during tonic firing modes (Zhou et al. 1997; Budde et al. 1998, 2002; Pape et al. 2004). However, the developmental regulation of plateau potentials suggests that L-type activity may also be associated with the activity-dependent refinement of developing retinogeniculate connections. L-type Ca2+ channels are located primarily on the somata and proximal regions of dendrites (Zhou et al. 1997; Budde et al. 1998). Thus, their close proximity to retinal synapses (Rafols & Valverde, 1973; Sherman & Guillery, 2002; Bickford et al. 2010) allows for L-type activation to be coincident with retinally evoked postsynaptic events. In fact, the driving force behind their concerted activation could arise from spontaneous retinal waves. In vitro recordings of retinal waves in a preparation that preserves the eyes and retinal connections to dLGN reveal that groups of retinal ganglion cells firing in synchrony generate long epochs of high-frequency activity and large sustained depolarizations in dLGN cells (Mooney et al. 1996). Although the underlying pharmacology of these responses was not investigated, their profile largely resembles synaptically evoked plateau activity generated by high-frequency stimulation of OT (Lo et al. 2002; Butts et al. 2007). Thus, it would seem that the high incidence of plateau activity coincides with a time during development when retinal waves prevail. In fact, plateau activity and its associated Ca2+ influx may represent the means by which retinal waves mediate the activity-dependent refinement of retinogeniculate connections (Torborg & Feller, 2005).
In fact, the activity-dependent influx of Ca2+ associated with L-type channel activation has been implicated in several forms of synaptic plasticity (Magee & Johnston, 1997; Lo & Mize, 2000; Guido et al. 2001) as well as signalling cascades involved in the structural remodelling of synaptic connections (Greer & Greenberg, 2008). Studies in developing dLGN show that L-type activation is needed for the induction of long-term changes in synaptic strength (Ziburkus et al. 2009) and seems to favour the Ca2+-dependent cAMP response element binding protein (CREB) signalling cascade (Mermelstein et al. 2000; Dolmetsch et al. 2001; Kornhauser et al. 2002) known to be important for retinogeniculate axon segregation (Pham et al. 2001). While a direct link between the activity-dependent refinement of retinogeniculate connections and L-type-mediated plateau activity is presently lacking, the future utilization of the β3 null mouse may offer an opportunity to directly assess this relationship.
Acknowledgments
The authors thank Jeremy Mills, Erick Green and Kim Bui for their assistance with the immunocytochemistry, Tania A. Seabrook for her help with the Western blots, and Dr Thomas E. Krahe for his help with the slice physiology and critical reading of the manuscript. This work was supported by A National Eye Institute NIH grant EY012716 (W.G.).
Glossary
Abbreviations
- AHP
afterhyperpolarization
- DAB
diaminobenzidine
- dLGN
dorsal lateral geniculate nucleus
- NGS
normal goat serum
- NMDAR
NMDA receptors
- OT
optic tract
- P
postnatal day
- PP
plateau potential
- WT
wild type
Author contributions
All experiments were performed in the lab of W.G. E.K.D. and W.G. were involved in all aspects of the experiments. H.-S.S. provided the β3 null mouse and contributed to the conception and critical reading of the manuscript. All authors approved the final version of the manuscript.
References
- Ball SL, Powers PA, Shin HS, Morgans CW, Peachey NS, Gregg RG. Role of the β2 subunit of voltage-dependent calcium channels in the retinal outer plexiform layer. Invest Ophthalmol Vis Sci. 2002;43:1595–1603. [PubMed] [Google Scholar]
- Bichet D, Cornet V, Geib S, Carlier E, Volsen S, Hoshi T, et al. The I-II loop of the Ca2+ channel α1 subunit contains an endoplasmic reticulum retention signal antagonized by the β subunit. Neuron. 2000;25:177–190. doi: 10.1016/s0896-6273(00)80881-8. [DOI] [PubMed] [Google Scholar]
- Bickford ME, Slusarczyk A, Dilger EK, Krahe TE, Kucuk C, Guido W. Synaptic development of the mouse dorsal lateral geniculate nucleus. J Comp Neurol. 2010;518:622–635. doi: 10.1002/cne.22223. [DOI] [PMC free article] [PubMed] [Google Scholar]
- Birnbaumer L, Qin N, Olcese R, Tareilus E, Platano D, Costantin J, Stefani E. Structures and functions of calcium channel β subunits. J Bioenerg Biomembr. 1998;30:357–375. doi: 10.1023/a:1021989622656. [DOI] [PubMed] [Google Scholar]
- Blitz DM, Regehr WG. Timing and specificity of feed-forward inhibition within the LGN. Neuron. 2005;45:917–928. doi: 10.1016/j.neuron.2005.01.033. [DOI] [PubMed] [Google Scholar]
- Budde T, Meuth S, Pape HC. Calcium-dependent inactivation of neuronal calcium channels. Nat Rev Neurosci. 2002;3:873–883. doi: 10.1038/nrn959. [DOI] [PubMed] [Google Scholar]
- Budde T, Munsch T, Pape HC. Distribution of L-type calcium channels in rat thalamic neurones. Eur J Neurosci. 1998;10:586–597. doi: 10.1046/j.1460-9568.1998.00067.x. [DOI] [PubMed] [Google Scholar]
- Butts DA, Kanold PO, Shatz CJ. A burst-based ‘Hebbian’ learning rule at retinogeniculate synapses links retinal waves to activity-dependent refinement. PLoS Biol. 2007;5:e61. doi: 10.1371/journal.pbio.0050061. [DOI] [PMC free article] [PubMed] [Google Scholar]
- Chen C, Regehr WG. Developmental remodeling of the retinogeniculate synapse. Neuron. 2000;28:955–966. doi: 10.1016/s0896-6273(00)00166-5. [DOI] [PubMed] [Google Scholar]
- Cohen S, Greenberg ME. Communication between the synapse and the nucleus in neuronal development, plasticity, and disease. Annu Rev Cell Dev Biol. 2008;24:183–209. doi: 10.1146/annurev.cellbio.24.110707.175235. [DOI] [PMC free article] [PubMed] [Google Scholar]
- Corlew R, Bosma MM, Moody WJ. Spontaneous, synchronous electrical activity in neonatal mouse cortical neurones. J Physiol. 2004;560:377–390. doi: 10.1113/jphysiol.2004.071621. [DOI] [PMC free article] [PubMed] [Google Scholar]
- Crepel V, Aronov D, Jorquera I, Represa A, Ben-Ari Y, Cossart R. A parturition-associated nonsynaptic coherent activity pattern in the developing hippocampus. Neuron. 2007;54:105–120. doi: 10.1016/j.neuron.2007.03.007. [DOI] [PubMed] [Google Scholar]
- Crunelli V, Haby M, Jassik-Gerschenfeld D, Leresche N, Pirchio M. Cl−- and K+-dependent inhibitory postsynaptic potentials evoked by interneurones of the rat lateral geniculate nucleus. J Physiol. 1988;399:153–176. doi: 10.1113/jphysiol.1988.sp017073. [DOI] [PMC free article] [PubMed] [Google Scholar]
- Demas J, Eglen SJ, Wong RO. Developmental loss of synchronous spontaneous activity in the mouse retina is independent of visual experience. J Neurosci. 2003;23:2851–2860. doi: 10.1523/JNEUROSCI.23-07-02851.2003. [DOI] [PMC free article] [PubMed] [Google Scholar]
- Dolmetsch RE, Pajvani U, Fife K, Spotts JM, Greenberg ME. Signaling to the nucleus by an L-type calcium channel-calmodulin complex through the MAP kinase pathway. Science. 2001;294:333–339. doi: 10.1126/science.1063395. [DOI] [PubMed] [Google Scholar]
- Dolphin AC. β Subunits of voltage-gated calcium channels. J Bioenerg Biomembr. 2003;35:599–620. doi: 10.1023/b:jobb.0000008026.37790.5a. [DOI] [PubMed] [Google Scholar]
- Drummond GB. Reporting ethical matters in The Journal of Physiology: standards and advice. J Physiol. 2009;587:713–719. doi: 10.1113/jphysiol.2008.167387. [DOI] [PMC free article] [PubMed] [Google Scholar]
- Greer PL, Greenberg ME. From synapse to nucleus: calcium-dependent gene transcription in the control of synapse development and function. Neuron. 2008;59:846–860. doi: 10.1016/j.neuron.2008.09.002. [DOI] [PubMed] [Google Scholar]
- Guido W. Refinement of the retinogeniculate pathway. J Physiol. 2008;586:4357–4362. doi: 10.1113/jphysiol.2008.157115. [DOI] [PMC free article] [PubMed] [Google Scholar]
- Guido W, Lo FS, Erzurumlu RS. Synaptic plasticity in the trigeminal principal nucleus during the period of barrelette formation and consolidation. Brain Res Dev Brain Res. 2001;132:97–102. doi: 10.1016/s0165-3806(01)00283-8. [DOI] [PMC free article] [PubMed] [Google Scholar]
- Hernandez-Cruz A, Pape HC. Identification of two calcium currents in acutely dissociated neurons from the rat lateral geniculate nucleus. J Neurophysiol. 1989;61:1270–1283. doi: 10.1152/jn.1989.61.6.1270. [DOI] [PubMed] [Google Scholar]
- Hooks BM, Chen C. Distinct roles for spontaneous and visual activity in remodeling of the retinogeniculate synapse. Neuron. 2006;52:281–291. doi: 10.1016/j.neuron.2006.07.007. [DOI] [PubMed] [Google Scholar]
- Huberman AD, Feller MB, Chapman B. Mechanisms underlying development of visual maps and receptive fields. Annu Rev Neurosci. 2008;31:479–509. doi: 10.1146/annurev.neuro.31.060407.125533. [DOI] [PMC free article] [PubMed] [Google Scholar]
- Jaubert-Miazza L, Green E, Lo FS, Bui K, Mills J, Guido W. Structural and functional composition of the developing retinogeniculate pathway in the mouse. Vis Neurosci. 2005;22:661–676. doi: 10.1017/S0952523805225154. [DOI] [PubMed] [Google Scholar]
- Jeon D, Song I, Guido W, Kim K, Kim E, Oh U, Shin HS. Ablation of Ca2+ channel β3 subunit leads to enhanced N-methyl-D-aspartate receptor-dependent long term potentiation and improved long term memory. J Biol Chem. 2008;283:12093–12101. doi: 10.1074/jbc.M800816200. [DOI] [PMC free article] [PubMed] [Google Scholar]
- Kammermeier PJ, Jones SW. High-voltage-activated calcium currents in neurons acutely isolated from the ventrobasal nucleus of the rat thalamus. J Neurophysiol. 1997;77:465–475. doi: 10.1152/jn.1997.77.1.465. [DOI] [PubMed] [Google Scholar]
- Kammermeier PJ, Jones SW. Facilitation of L-type calcium current in thalamic neurons. J Neurophysiol. 1998;79:410–417. doi: 10.1152/jn.1998.79.1.410. [DOI] [PubMed] [Google Scholar]
- Kornhauser JM, Cowan CW, Shaywitz AJ, Dolmetsch RE, Griffith EC, Hu LS, et al. CREB transcriptional activity in neurons is regulated by multiple, calcium-specific phosphorylation events. Neuron. 2002;34:221–233. doi: 10.1016/s0896-6273(02)00655-4. [DOI] [PubMed] [Google Scholar]
- Liljelund P, Netzeband JG, Gruol DL. L-Type calcium channels mediate calcium oscillations in early postnatal Purkinje neurons. J Neurosci. 2000;20:7394–7403. doi: 10.1523/JNEUROSCI.20-19-07394.2000. [DOI] [PMC free article] [PubMed] [Google Scholar]
- Liu X, Chen C. Different roles for AMPA and NMDA receptors in transmission at the immature retinogeniculate synapse. J Neurophysiol. 2008;99:629–643. doi: 10.1152/jn.01171.2007. [DOI] [PubMed] [Google Scholar]
- Lo FS, Erzurumlu RS. L-type calcium channel-mediated plateau potentials in barrelette cells during structural plasticity. J Neurophysiol. 2002;88:794–801. doi: 10.1152/jn.2002.88.2.794. [DOI] [PMC free article] [PubMed] [Google Scholar]
- Lo FS, Mize RR. Synaptic regulation of L-type Ca2+ channel activity and long-term depression during refinement of the retinocollicular pathway in developing rodent superior colliculus. J Neurosci. 2000;20:RC58. doi: 10.1523/JNEUROSCI.20-03-j0003.2000. [DOI] [PMC free article] [PubMed] [Google Scholar]
- Lo FS, Ziburkus J, Guido W. Synaptic mechanisms regulating the activation of a Ca2+-mediated plateau potential in developing relay cells of the LGN. J Neurophysiol. 2002;87:1175–1185. doi: 10.1152/jn.00715.1999. [DOI] [PubMed] [Google Scholar]
- MacLeod N, Turner C, Edgar J. Properties of developing lateral geniculate neurones in the mouse. Int J Dev Neurosci. 1997;15:205–224. doi: 10.1016/s0736-5748(96)00088-3. [DOI] [PubMed] [Google Scholar]
- Magee JC, Johnston D. A synaptically controlled, associative signal for Hebbian plasticity in hippocampal neurons. Science. 1997;275:209–213. doi: 10.1126/science.275.5297.209. [DOI] [PubMed] [Google Scholar]
- Mermelstein PG, Bito H, Deisseroth K, Tsien RW. Critical dependence of cAMP response element-binding protein phosphorylation on L-type calcium channels supports a selective response to EPSPs in preference to action potentials. J Neurosci. 2000;20:266–273. doi: 10.1523/JNEUROSCI.20-01-00266.2000. [DOI] [PMC free article] [PubMed] [Google Scholar]
- Mooney R, Penn AA, Gallego R, Shatz CJ. Thalamic relay of spontaneous retinal activity prior to vision. Neuron. 1996;17:863–874. doi: 10.1016/s0896-6273(00)80218-4. [DOI] [PubMed] [Google Scholar]
- Morisset V, Nagy F. Ionic basis for plateau potentials in deep dorsal horn neurons of the rat spinal cord. J Neurosci. 1999;19:7309–7316. doi: 10.1523/JNEUROSCI.19-17-07309.1999. [DOI] [PMC free article] [PubMed] [Google Scholar]
- Murakami M, Fleischmann B, De Felipe C, Freichel M, Trost C, Ludwig A, et al. Pain perception in mice lacking the β3 subunit of voltage-activated calcium channels. J Biol Chem. 2002;277:40342–40351. doi: 10.1074/jbc.M203425200. [DOI] [PubMed] [Google Scholar]
- Namkung Y, Smith SM, Lee SB, Skrypnyk NV, Kim HL, Chin H, et al. Targeted disruption of the Ca2+ channel β3 subunit reduces N- and L-type Ca2+ channel activity and alters the voltage-dependent activation of P/Q-type Ca2+ channels in neurons. Proc Natl Acad Sci U S A. 1998;95:12010–12015. doi: 10.1073/pnas.95.20.12010. [DOI] [PMC free article] [PubMed] [Google Scholar]
- Pape HC, Munsch T, Budde T. Novel vistas of calcium-mediated signalling in the thalamus. Pflugers Arch. 2004;448:131–138. doi: 10.1007/s00424-003-1234-5. [DOI] [PubMed] [Google Scholar]
- Pham TA, Rubenstein JL, Silva AJ, Storm DR, Stryker MP. The CRE/CREB pathway is transiently expressed in thalamic circuit development and contributes to refinement of retinogeniculate axons. Neuron. 2001;31:409–420. doi: 10.1016/s0896-6273(01)00381-6. [DOI] [PubMed] [Google Scholar]
- Rafols JA, Valverde F. The structure of the dorsal lateral geniculate nucleus in the mouse. A Golgi and electron microscopic study. J Comp Neurol. 1973;150:303–332. doi: 10.1002/cne.901500305. [DOI] [PubMed] [Google Scholar]
- Rekling JC, Feldman JL. Calcium-dependent plateau potentials in rostral ambiguus neurons in the newborn mouse brain stem in vitro. J Neurophysiol. 1997;78:2483–2492. doi: 10.1152/jn.1997.78.5.2483. [DOI] [PubMed] [Google Scholar]
- Scharfman HE, Lu SM, Guido W, Adams PR, Sherman SM. N-methyl-D-aspartate receptors contribute to excitatory postsynaptic potentials of cat lateral geniculate neurons recorded in thalamic slices. Proc Natl Acad Sci U S A. 1990;87:4548–4552. doi: 10.1073/pnas.87.12.4548. [DOI] [PMC free article] [PubMed] [Google Scholar]
- Sherman SM, Guillery RW. The role of the thalamus in the flow of information to the cortex. Philos Trans R Soc Lond B Biol Sci. 2002;357:1695–1708. doi: 10.1098/rstb.2002.1161. [DOI] [PMC free article] [PubMed] [Google Scholar]
- Shiraiwa T, Kashiwayanagi M, Iijima T, Murakami M. Involvement of the calcium channel β3 subunit in olfactory signal transduction. Biochem Biophys Res Commun. 2007;355:1019–1024. doi: 10.1016/j.bbrc.2007.02.063. [DOI] [PubMed] [Google Scholar]
- Singer JH, Mirotznik RR, Feller MB. Potentiation of L-type calcium channels reveals nonsynaptic mechanisms that correlate spontaneous activity in the developing mammalian retina. J Neurosci. 2001;21:8514–8522. doi: 10.1523/JNEUROSCI.21-21-08514.2001. [DOI] [PMC free article] [PubMed] [Google Scholar]
- Stevens B, Allen NJ, Vazquez LE, Howell GR, Christopherson KS, Nouri N, et al. The classical complement cascade mediates CNS synapse elimination. Cell. 2007;131:1164–1178. doi: 10.1016/j.cell.2007.10.036. [DOI] [PubMed] [Google Scholar]
- Torborg CL, Feller MB. Spontaneous patterned retinal activity and the refinement of retinal projections. Prog Neurobiol. 2005;76:213–235. doi: 10.1016/j.pneurobio.2005.09.002. [DOI] [PubMed] [Google Scholar]
- Torborg CL, Hansen KA, Feller MB. High frequency, synchronized bursting drives eye-specific segregation of retinogeniculate projections. Nat Neurosci. 2005;8:72–78. doi: 10.1038/nn1376. [DOI] [PMC free article] [PubMed] [Google Scholar]
- Zhou Q, Godwin DW, O’Malley DM, Adams PR. Visualization of calcium influx through channels that shape the burst and tonic firing modes of thalamic relay cells. J Neurophysiol. 1997;77:2816–2825. doi: 10.1152/jn.1997.77.5.2816. [DOI] [PubMed] [Google Scholar]
- Ziburkus J, Dilger EK, Lo FS, Guido W. LTD and LTP at the developing retinogeniculate synapse. J Neurophysiol. 2009;102:3082–3090. doi: 10.1152/jn.90618.2008. [DOI] [PMC free article] [PubMed] [Google Scholar]
- Ziburkus J, Guido W. Loss of binocular responses and reduced retinal convergence during the period of retinogeniculate axon segregation. J Neurophysiol. 2006;96:2775–2784. doi: 10.1152/jn.01321.2004. [DOI] [PubMed] [Google Scholar]
- Ziburkus J, Lo FS, Guido W. Nature of inhibitory postsynaptic activity in developing relay cells of the lateral geniculate nucleus. J Neurophysiol. 2003;90:1063–1070. doi: 10.1152/jn.00178.2003. [DOI] [PubMed] [Google Scholar]