

Abstract
Pancreatic islet dysfunction is a key element in the development of type 2 diabetes. Determining possible early warning signs of dysfunction is thus important to determining the underlying causes of diabetes. We describe an improved fluorescent imaging approach to detect potential islet dysfunction. Using Cell Tracker Red (CTR, a mildly thiol-reactive fluorescent probe) to positively label particular islets, we measured intracellular free calcium with fura-2 AM in both CTR-labeled and unlabeled sets of pancreatic islets simultaneously in vitro. This approach enhances sensitivity by controlling for differences in background fluorescence, temperature and perifusion dynamics. We confirmed that 200 nM CTR produced no spectral overlap with fura-2 and no significant physiological effects in selective tests of islet function. To demonstrate the utility of dual-labeling, we compared untreated islets with islets pretreated with low-dose proinflammatory cytokines (IL-6 + IL-1B) to induce mild dysfunction. We alternated CTR-labeling between control and test islets and identified consistent reductions in the amplitude and trajectory of glucose-stimulated calcium responses (GSCa) among cytokine-treated islets that were independent of labeling. Observations were verified using a MATLAB program specifically designed to identify key features in the GSCa. Our findings thus demonstrate the utility of CTR-labeling in identifying islet dysfunction and propose that this technique can be adapted for other cells and tissues.
Key words: Islets of Langerhans, CellTracker Red, Fura-2, Interleukin-6, Interleukin-1beta, cytokines, calcium
Introduction
Under normal healthy conditions, pancreatic islets respond to glucose stimulation with a complex series of intracellular processes that leads to a triphasic change in intracellular free calcium ([Ca2+]i)1,2 and subsequent insulin release. [Ca2+]i imaging thus provides a good approximation of the dynamics of glucose-stimulated insulin secretion and an indication of overall islet health and function. Deficiencies in the latency, amplitude or slope of this response potentially can be used to determine the mechanism(s) of islet dysfunction. Identifying early warning signs of islet dysfunction is important to better understanding the potential underlying causes of islet failure in both type 1 and type 2 diabetes.3,4
To aid in phenotyping islet dysfunction, we developed a fluorescent imaging technique to assess [Ca2+]i handling in islets from both control and test groups simultaneously. By pre-labeling one set of islets with a mildly thiol-reactive probe called CellTracker Red CMTPX (CTR, Invitrogen, C34552), both control and experimental test groups can be compared directly with a high degree of temporal precision. This improves sensitivity and also eliminates potential confounding variables such as background fluorescence, temperature and perifusion dynamics. We demonstrate that CTR does not overlap with the emission spectrum used to measure [Ca2+]i with fura-2 acetoxymethyl ester (fura-2) and has no adverse effects on the normal physiological function of islets when CTR is used at appropriate doses.
We applied this technique to identify defects among islets treated with proinflammatory cytokines. In conditions of obesity and T2D, certain cytokine are mildly elevated in the blood stream due to inflammation occurring in fat and other tissues.5,6 This low-grade systemic inflammation may contribute to the risk of T2D by promoting dysfunction and eventual destruction of pancreatic islets.6–8 We thus used a combination of proinflammatory cytokines related to T2D at physiological concentrations to assess the impact on murine islet [Ca2+]i handling to demonstrate the utility of our technique.
Results
CTR fluorescence does not interfere with fura-2 measurements.
The goal of this study was to improve existing methods for assessing the physiological function of islets as measured by GSCa. We first established that CTR labeling does not interfere with fura-2 detection. CTR was tested at concentrations from 100 nM to 5 µM and was found to be reliably visible in concentrations of 200 nM or greater. Islets were loaded for 30 min with 1 µM fura-2 or with 1 µM fura-2 + CTR, and then islets were imaged. As shown in Figure 1, unlabeled islets and islets labeled with 200 nM CTR were all observed in monochrome visible light (Fig. 1A), however, CTR-labeled islets alone were observed using a TRITC (red) filter (535 nm excitation and 610 nm emission), as shown in Figure 1B. For fura-2 imaging, emitted light at 510 nm from the two excitation wavelengths, 340 and 380 nm, were similar for unlabeled and CTR-labeled islets (Fig. 1C). In addition, CTR-labeled islets did not produce any fluorescence emission using the fura-2 settings as compared to islets that were not loaded with any fluorescent probe of any kind (data not shown). These data establish that CTR does not interfere with fura-2 fluorescence.
Figure 1.
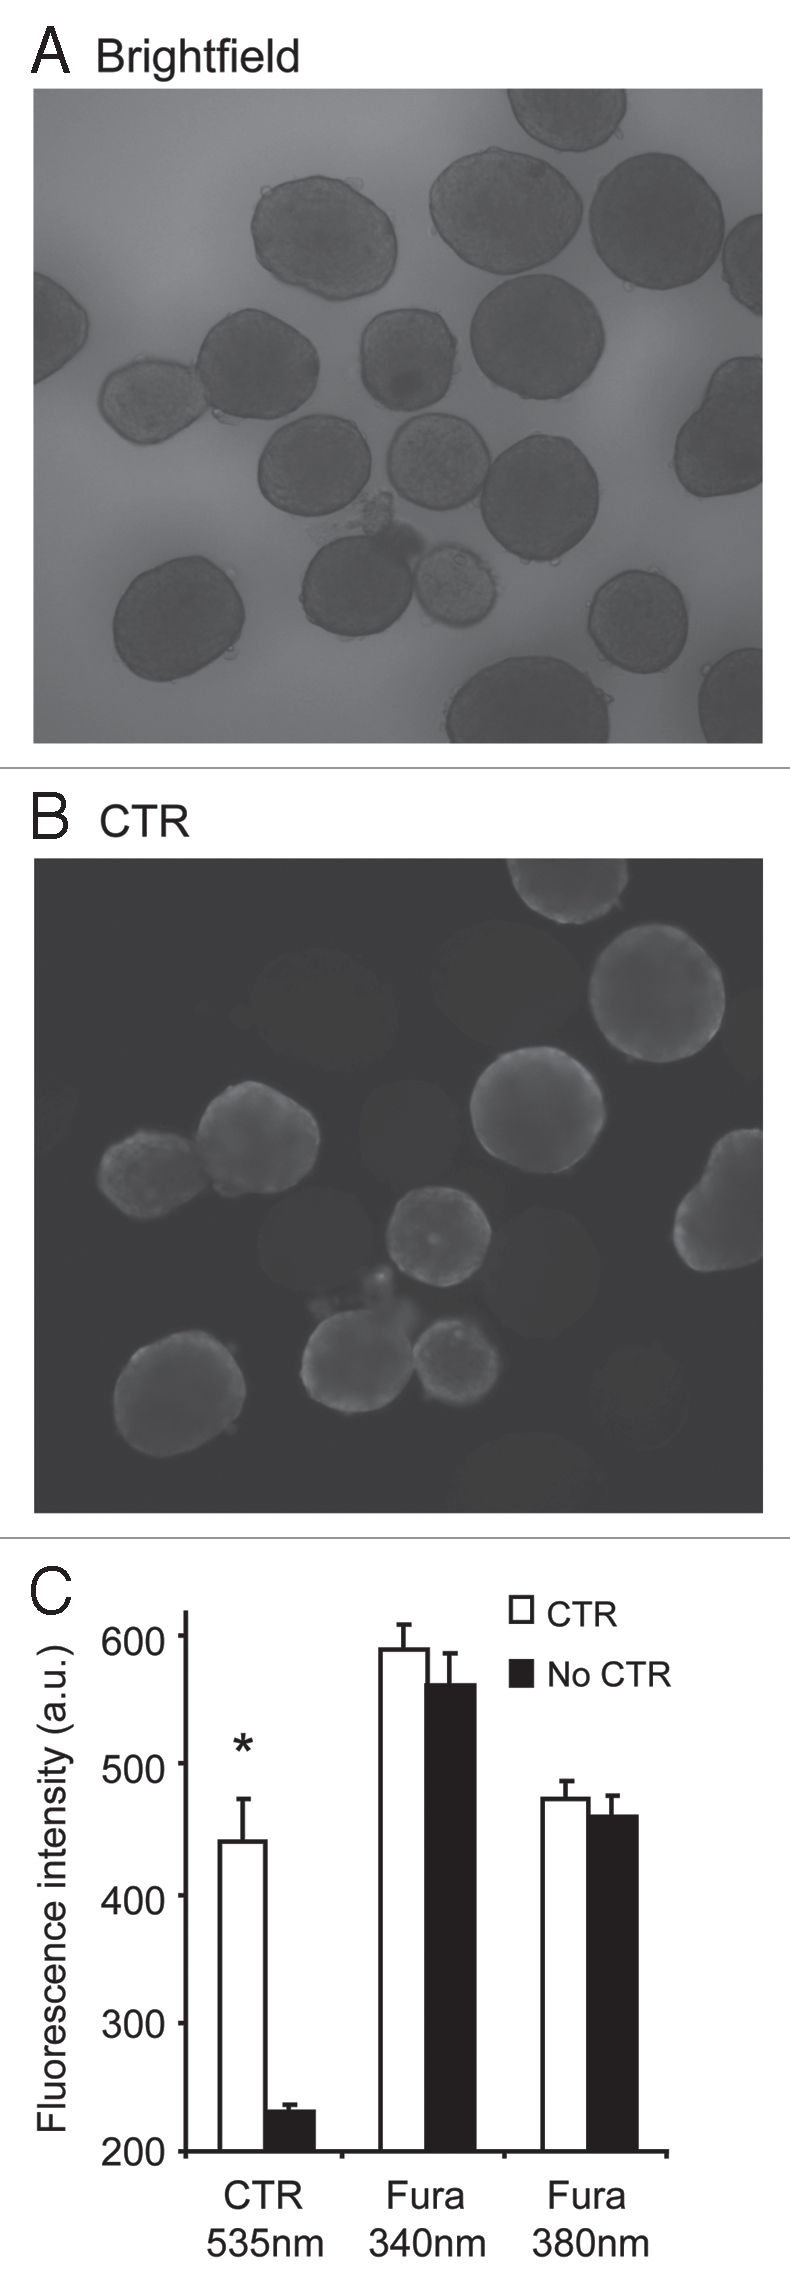
CTR-labeling does not overlap with fura-2 signals. (A and B) Islets labeled with either CTR + fura-2 (n = 10) or fura-2 alone (n = 10) as shown in visible light (A) and ‘red’ settings (535 nm excitation and 610 nm emission) to view CTR labeling (B). Note that CTR-labeled islets are easily distinguishable by eye from islets labeled with fura-2 alone. (C) Mean fluorescence intensity values (a.u. = arbitrary units) for the islets in (A and B) stimulated at 535 nm excitation to observe CTR-labeled cells and 340 or 380 nm to observe fura-2 fluorescence. *indicates p < 0.05.
Testing of CTR effects on islet calcium handling.
We next tested CTR for possible interference with islet physiology. We measured the three phases of the GSCa response. Phase 0 is represented by a small dip in [Ca2+]i followed by a spike in calcium influx (phase 1) that leads to a sustained plateau (phase 2). For a detailed description of this response, please see references.1,2,9 As shown in Figure 2A and B, islets loaded with 200 nM CTR + 1 µM fura-2 (Fig. 2A) or 1 µM fura-2 alone (Fig. 2B) showed a similar [Ca2+]i response to 11 mM glucose stimulation. The 6sixtraces shown in Figure 2A and the six traces shown in Figure 2B were all recorded simultaneously under identical conditions and represent 1 of 4 separate trials. As summarized in Figure 2C, mean GSCa values did not differ significantly between CTR-labeled and non-labeled islets among the four trials. There were also no differences in the coefficient of variation. These findings suggest that CTR does not interfere with normal islet function.
Figure 2.

CTR does not appear to interfere with islet calcium handling during glucose stimulation. (A and B) Examples of GSCa responses for CTR-labeled islets (A) and unlabeled islets (B, ‘No CTR’). (C) Summary of the mean amplitude of the change in [Ca2+]i from basal during phase 0, 1 and 2, as an indicator of overall islet [Ca2+]i handling in response to glucose stimulation. CTR-labeled islets (n = 36) and unlabeled islets (No CTR, n = 42) did not differ significantly in any phase of their calcium response among four independent trials.
We also examined two other markers of islet function: (a) endogenous [Ca2+]i oscillations10,11 and (b) responses to depolarization by 20 mM KCl. Neither marker was affected by labeling islets with 200 nM CTR (data not shown). Note that we published previously that CTR had no effect on glucose-stimulated insulin secretion at concentrations of CTR as high as 5 µM,9 which is 25 times greater than the 200 nM concentration used in the present study. These experiments collectively demonstrate the effectiveness of CTR-labeling to discriminate between sets of islets without disrupting normal islet function.
It should be noted that thiol-reactive fluorescent probes like CTR can enter the intracellular space of cells and potentially interact with organelles and/or act as a calcium buffer. Although we did not observe any CTR-related interference with [Ca2+]i measurements using 200 nM CTR concentrations, at considerably higher doses (>1 µM), CTR labeling may interfere with the measurement of fura-2 ratios. We observed that 2 µM CTR was still undetectable using the settings for measuring fura-2 (340/380 nm excitation and 510 emission), however, GSCas were consistently attenuated, displaying a mild elevation of basal calcium and a reduced first phase as shown in Figure 3A. Figure 3B shows three combined trials using 2 µM CTR and a significant attenuation of first phase stimulation (p-value < 0.001). Phases 0 and 2 exhibited no significant differences, but basal [Ca2+]i was also slightly elevated by 2 µM CTR treatment (data not shown). This suggests a possible biological effect of CTR on islet [Ca2+]i handling. To avoid this issue, CTR concentrations of 200 nM were used for all studies, and experiments were always repeated with the control islets used once as the CTR-labeled group and once as the unlabeled group. This ensures that any potential bias of the CTR-labeling is removed.
Figure 3.

CTR at higher concentrations alters the calcium response to glucose stimulation. (A) The averaged traces from one trial shows a slight attenuation of the calcium responses to glucose stimulation when a concentration of 2 mM CTR was used (n = 10 islets for fura-2, n = 12 for CTR). (B) Mean values from three independent trials show a significant attenuation in the first phase of the stimulation (p value < 0.001) using 2 uM CTR (n = 31 islets for fura-2, n = 33 for CTR). No significant differences were noted in phase 0 or 2.
As an alternative label, we also tested the fluorescein-based, non-ratiometric dye fluo-4 AM in conjunction with CTR. Although fluo-4 emission was found to overlap slightly with the CTR emission spectrum, CTR-labeled islets were still easily distinguishable from non-labeled islets. The CTR did not produce any fluorescence emissions in the fluo-4 spectrum (data not shown). This suggests that fluo-4 may be a reasonable alternative to using fura-2, but further testing of effects on islet physiology is recommended.
Using CTR labeling to assess effects of low-dose cytokine treatments on islets.
We next used the CTR-labeling system to compare two groups of islets: (A) untreated (control) islets vs. (B) cytokine-treated islets. Proinflammatory cytokines are secreted during the immune response and are known to play a key role in the destruction of islets in T1D,12–14 but cytokines may or may not play a role in T2D as well.15,16 A recent clinical study showed that the combination of interleukin-6 (IL-6) and interleukin-1beta (IL-1B) was associated with a significantly increased risk of developing T2D, as compared with either cytokine alone.17 We thus examined the effects of overnight treatment with IL-6 + IL-1B on islet function.
Representative examples of untreated (solid line) and cytokine-treated (dashed line) islets are shown in Figure 4A. Cytokine-treated islets displayed an elevation in basal [Ca2+]i and an attenuated response to glucose stimulation. Cytokines also reduced the number of islets displaying oscillations during the phase 2 response observed by eye (1 of 18 cytokine-treated islets vs. 9 of 15 untreated islets). This observation supports our previous findings regarding the importance of oscillations to normal islet health,8,10 however, it should be noted that ideally oscillations should be recorded in steady-state glucose to prevent transient states in their oscillatory periods.18,19 Two separate trials were conducted, one with untreated islets labeled with CTR and another with cytokine-treated islets labeled with CTR. In each trial, the cytokine-treated islets showed a substantially reduced GSCa regardless of labeling. The combined data set from both trials shows a cytokine-induced reduction in phase 0, 1 and 2 of the GSCa (Fig. 4B).
Figure 4.

Effects of overnight cytokine treatment on islet [Ca2+]i handling. (A) Representative examples of GSCa (from 3–11 mM glucose) among islets that were either untreated (solid) or treated overnight with 20 pg/mL IL-1B + 40 pg/mL IL-6 (dashed). (B) Mean values for the amplitude of GSCa responses during phase 0, 1 and 2 among untreated (black bars, n = 15) and cytokine-treated (white bars, n = 21) islets. * indicates p < 0.05 and *** p < 0.001.
To further quantify these effects, we created a program to detect amplitude, latency, slope and area under the curve for each of the three phases of GSCa. The program identifies the peak of phase 1, which is then used to find appropriate points of inflection that indicate phases 0 and 2 in the GSCa trace. We tested the program using cytokines at even lower doses (5 pg/mL IL-1B + 10 pg/mL IL-6) consistent with circulating serum levels in obese humans.17 As shown in Figure 5, representative examples of untreated (Fig. 5A) and cytokine-treated (Fig. 5B) islets show that cytokines at these concentrations have a less pronounced, but still significant, effect on GSCa. As shown in Figure 5C and D, phase 0 (red), 1 (green) and 2 (blue) are shaded based on the program's analysis of the original traces from Figure 5A and B. These experiments were repeated with similar cytokine effects observed in each of the two trials. The mean values for phase 0, 1 and 2 are shown in Table 1, along with an additional 15 parameters calculated by the program. The most notable effects of cytokines were on the trajectory (slope), amplitude and area of the phase 1 response. These effects could be due to the rate at which glucose is metabolized, changes in the ion-channel functions, disruptions in ER calcium handling or a loss of coordinated activity within the islet, among other possibilities. The cytokine-treated islets also displayed a higher calcium concentration in basal glucose conditions. As we have previously reported, this difference in basal calcium is due, in part, to a combination of increased calcium influx and depletion of ER calcium among cytokine-treated islets.8
Figure 5.

Detailed analysis of low-dose cytokine treatment on islet calcium handling. (A and B) Representative examples of GSCa (from 3–11 mM glucose) among islets that were either untreated (A) or treated overnight with 5 pg/ml IL-1B + 10 pg/ml IL-6 (B). (C and D) Results of analysis by a specially designed program used to identify features in GSCa responses for phases 0 (red), 1 (green) and 2 (blue). Analysis results of (A) are displayed in (C) and analysis results of (B) are displayed in (D).
Table 1.
GSCa parameters measured by MATLAB program
| GSCa parameter | untreated | cytokine-treated | p-value |
| basal calcium | 0.804 ± 0.009 | 0.841 ± 0.007 | 0.00185 |
| minimum in phase 0 | 0.765 ± 0.012 | 0.815 ± 0.009 | 0.00196 |
| peak value in phase 1 | 1.307 ± 0.03 | 1.129 ± 0.021 | 0.00007 |
| mean in phase 2 | 1.015 ± 0.027 | 0.975 ± 0.016 | 0.28736 |
| amplitude of phase 0 | 0.039 ± 0.005 | 0.026 ± 0.003 | 0.04981 |
| amplitude of phase 1 | 0.503 ± 0.031 | 0.288 ± 0.022 | 0.00001 |
| amplitude of phase 2 | 0.211 ± 0.028 | 0.134 ± 0.015 | 0.03115 |
| start of phase 0 | 171.5 ± 5 | 156.2 ± 6.9 | 0.19765 |
| start of phase 1 | 281.9 ± 7.7 | 313.8 ± 11.8 | 0.0461 |
| start of phase 2 | 532.4 ± 20.5 | 563.5 ± 24.8 | 0.53491 |
| time of phase 1 peak | 345.3 ± 6.8 | 417.1 ± 15.7 | 0.00063 |
| upslope of phase 1 | 0.008 ± 0.001 | 0.003 ± 0.001 | 0.00005 |
| downslope of phase 1 | −0.002 ± 0 | −0.001 − 0 | 0.01972 |
| duration of phase 0 | 110.4 ± 11.4 | 157.6 ± 16 | 0.04883 |
| duration of phase 1 | 250.5 ± 19.2 | 249.7 ± 16.9 | 0.74504 |
| area of phase 0 | 0.374 ± 0.06 | 0.378 ± 0.066 | 0.99183 |
| area of phase 1 | 16.9 ± 1.3 | 9.8 ± 0.9 | 0.00015 |
| area of phase 2 | 16.4 ± 2.6 | 9.6 ± 1.8 | 0.05902 |
Discussion
Our data and analysis show that CTR-labeling can be used to detect differences in islet calcium handling with enhanced sensitivity. The advantages of this approach include (a) increased throughput for recording many islets at once, (b) high sensitivity for identifying different latencies, trajectories, etc., in response to stimulation and (c) an internal control to eliminate differences in the chamber environment such as temperature, flow rate, background fluorescence, etc. In addition, we designed an analysis program to identify the salient features of the islet calcium response to glucose stimulation to begin to determine what factors can alter the normal GSCa in islets.
The MATLAB program estimates the phase transitions by first smoothing the data with a moving average filter to remove noise and high-frequency oscillations. Finite difference approximations to the derivatives of the smoothed data are used to estimate the locations of data features corresponding to the phase transitions. The phase transition estimates are then mapped back to time indices in the original data using heuristic algorithms. Specifically, the phase 1 peak is first estimated by detecting the phase 1 region of the original data and then determining the index of the maximum data value. The phase 1 peak index is then used as a reference point to scan forward in the smoothed data to estimate the phase 2 transition index or scan backward to estimate the phase 1 and 0 transitions, by determining where the derivatives of the smoothed data change sign or approach zero within some user-defined threshold. For example, an estimate of the transition from phase 1 to 2 is derived by determining where the derivatives of the smoothed data (past the phase 1 peak) change sign from negative to positive values, indicating the trend of the smoothed data has transitioned from decreasing to increasing, and indicative of the beginning of phase 2. Some simple heuristic rules are then used to determine the location (index) of the phase 2 transition in the original (unsmoothed) data.
We used this program to show that proinflammatory cytokines at low doses can negatively impact islet function, particularly the phase 1 response to glucose stimulation. Specifically, the program determined that the amplitude and the trajectory (slope) of the phase 1 calcium response were most affected by cytokines. Since calcium plays a well established role in exocytosis, this observation suggests a possible decrease in first phase insulin release, which is a hallmark of the early stages of diabetes.20 The cytokine data also provide proof-of-principle that islet function can be affected by small amounts of cytokines at concentrations circulating in the blood of obese and diabetic individuals, as suggested previously in references 6–8. Although these low levels may not result in immediate cell death, chronic exposure to these cytokines may be a contributing factor in islet dysfunction and eventual failure among people who are obese and prone to diabetes. By providing detailed information on these parameters, this program may aid in identifying the causes of specific changes in the islet response to glucose stimulation.
We note that CTR labeling limits the type of experiments that can be performed. The primary limitation of our approach is that we cannot apply acute treatments to some islets and not others, since all islets are exposed to the same solutions within the recording chamber. Although this limits use in screening direct acute drug effects, our technique is potentially very valuable for comparing untreated vs. drug pre-treated islets (reviewed in ref. 9) or for comparing islets from wild-type vs. transgenic mice. It is also difficult to use CTR-labeling on fixed cells or cell lines. However, CTR-labeling can be maintained for up to 48 hours, so it may be possible to plate both CTR-labeled and unlabeled cells together and then test the cells within the 48-hour window.
In conclusion, our use of CTR to discriminate between populations of islets permits simultaneous measurements of both control and test islet populations to make direct head-to-head comparisons. In principle, this approach can be extended to measure other aspects of islet function with fluorescence-based measurements including mitochondrial membrane potential, redox state, NAD(P)H flux and perhaps even insulin secretion by choosing appropriate non-interfering labels. Further, our approach can be adapted to examine other tissues, micro-organs and cell culture systems beyond our use of pancreatic islets in this study.
Materials and Methods
Islet isolation and treatments.
Male CD-1 mice (Charles River Laboratories Inc., strain 022) were used for this study. Mice were typically 8–12 weeks of age and housed in a pathogen-free facility at the University of Virginia (UVA). Mice were euthanized according to a protocol approved by the UVA Animal Care and Use Committee, and their pancreatic islets were injected with collagenase through the common bile duct. Islets were isolated by centrifugation using a Histopaque gradient as previously described in reference 21. Following isolation, islets were transferred to a Petri dish containing RPMI 1640 (Invitrogen, 11875-093) with 10% fetal bovine serum (Invitrogen 16000-044) and 1% penicillin-streptomycin (Invitrogen, 15140-122). All islets were incubated overnight to allow sufficient recovery time from collagenase digestion before any experiments were performed. For some studies, islets were treated overnight with mouse cytokines purchased from R&D Systems Inc., (Minneapolis, MN) as described in the Results. Note that all chemicals and reagent were purchased from Sigma-Aldrich (St. Louis, MO) unless otherwise indicated.
Cell tracker red labeling for measuring islet [Ca2+]i.
One 50 µg aliquot of CTR (Invitrogen, C34552) and one 50 µg aliquot of fura-2 (Invitrogen, F1221) were allowed to come to room temperature in a dark place. 36 µL of dimethol sulfoxide (DMSO, Thermo Fisher, D128-500) was added to the CTR to produce a 2 mM stock and 45 µL of DMSO + 5 µL of a 20% w/v solution of pluronic-127 (Invitrogen, P6867) were added to the fura-2 to produce a 1 mM stock. The fura-2 was then aliquoted into 5 µL units to avoid freeze/thaw cycles. Both dyes were stored in an opaque container at −20°C until needed. To label islets with CTR and fura-2, fura-2 was diluted 1:1,000 in 2 ml of 3 mM glucose solution, mixed and then divided between two wells of a 12-well plate. CTR stock was diluted 1:10 in 3 mM glucose solution, and then 1 µL of diluted CTR was added to one well of the fura-2 dilution for a final concentration of 200 nM. Approximately 15 islets were added to each well, and then the plate was covered with aluminum foil to prevent bleaching of the dyes and placed in a 5% CO2 incubator at 37°C for 30 minutes. [Ca2+]i was then measured in islets using the ratiometric [Ca2+]i indicator fura-2 using previously described methods.10 Note that glucose stimulation is marked in all Figures at the time that the tubing in the perifusion system is switched between solutions. We estimate that an additional 1–2 minutes are needed to reach the intended concentration in the recording chamber, depending on the location of the islets and flow dynamics within the chamber.
Analysis and statistics.
To quantify differences in GSCa between untreated and cytokine-treated islets, [Ca2+]i traces from each islet were detrended by linear-regression to account for drift in baseline during the recording due to dye loss, photobleaching, etc., as discussed previously in reference 22 and 23. The amplitude of [Ca2+]i changes from basal levels was then measured at GSCa phases 0, 1 and 2 (see Results for additional details). We also used a specially designed program written in MATLAB (The MathWorks) to identify other GSCa parameters such as latency and area under the curve. The program reads in the fluorescence data from an Excel file and estimates the time points corresponding to the transitions to phase 0, 1 and 2, as well as the peak of phase 1 and negative peak of phase 0. Area under the curve for each phase is calculated and averaged across multiple data sets. The computed data and statistics are written to another Excel file. A two-tailed t-test with unequal variance was used for comparisons of the program parameters between the two treatment groups for each set of experiments.
Acknowledgements
This work was funded by NIH grant 1K01 DK081621, Mouse Metabolic Phenotyping Center (MMPC) Pilot and Feasibility grant 07-MCG-22 and MMPC MicroMouse grant 09-MCG-55 to C.S.N. Mouse islets were acquired through the Cell and Islet Isolation Core facility at the UVA DERC (DK063609). A special thanks to Stacey Dula, Anthony Trace and Jeff Carter for assisting with the validation of this technique.
Disclosure Statement
A description on the use of this technique was published previously without the inclusion of any technical details. (W.S. Crim et al. 2010; PMID: 20211684).
References
- 1.Martin F, Soria B. Glucose-induced [Ca2+]i oscillations in single human pancreatic islets. Cell Calcium. 1996;20:409–414. doi: 10.1016/s0143-4160(96)90003-2. [DOI] [PubMed] [Google Scholar]
- 2.Roe MW, Mertz RJ, Lancaster ME, Worley JF, 3rd, Dukes ID. Thapsigargin inhibits the glucose-induced decrease of intracellular Ca2+ in mouse islets of langerhans. Am J Physiol. 1994;266:852–862. doi: 10.1152/ajpendo.1994.266.6.E852. [DOI] [PubMed] [Google Scholar]
- 3.Weir GC, Bonner-Weir S. Five stages of evolving beta-cell dysfunction during progression to diabetes. Diabetes. 2004;53:16–21. doi: 10.2337/diabetes.53.suppl_3.s16. [DOI] [PubMed] [Google Scholar]
- 4.Thomas HE, McKenzie MD, Angstetra E, Campbell PD, Kay TW. Beta cell apoptosis in diabetes. Apoptosis. 2009;14:1389–1404. doi: 10.1007/s10495-009-0339-5. [DOI] [PubMed] [Google Scholar]
- 5.Hotamisligil GS. Inflammation and metabolic disorders. Nature. 2006;444:860–867. doi: 10.1038/nature05485. [DOI] [PubMed] [Google Scholar]
- 6.Greenberg AS, McDaniel ML. Identifying the links between obesity, insulin resistance and beta-cell function: potential role of adipocyte-derived cytokines in the pathogenesis of type 2 diabetes. Eur J Clin Invest. 2002;32:24–34. doi: 10.1046/j.1365-2362.32.s3.4.x. [DOI] [PubMed] [Google Scholar]
- 7.Donath MY, Schumann DM, Faulenbach M, Ellingsgaard H, Perren A, Ehses JA. Islet inflammation in type 2 diabetes: from metabolic stress to therapy. Diabetes Care. 2008;31:161–164. doi: 10.2337/dc08-s243. [DOI] [PubMed] [Google Scholar]
- 8.Dula SB, Jecmenica M, Wu R, Jahanshahi P, Verrilli GM, Carter JD, et al. Evidence that low-grade systemic inflammation can induce islet dysfunction as measured by impaired calcium handling. Cell Calcium. 2010;48:133–142. doi: 10.1016/j.ceca.2010.07.007. [DOI] [PMC free article] [PubMed] [Google Scholar]
- 9.Crim WS, Wu R, Carter JD, Cole BK, Trace AP, Mirmira RG, et al. AGI-1067, a novel antioxidant and anti-inflammatory agent, enhances insulin release and protects mouse islets. Mol Cell Endocrinol. 2010;323:246–255. doi: 10.1016/j.mce.2010.02.041. [DOI] [PMC free article] [PubMed] [Google Scholar]
- 10.Jahanshahi P, Wu R, Carter JD, Nunemaker CS. Evidence of diminished glucose stimulation and endoplasmic reticulum function in nonoscillatory pancreatic islets. Endocrinology. 2009;150:607–615. doi: 10.1210/en.2008-0773. [DOI] [PMC free article] [PubMed] [Google Scholar]
- 11.Porksen N. Early changes in beta-cell function and insulin pulsatility as predictors for type 2 diabetes. Diabetes Nutr Metab. 2002;15:9–14. [PubMed] [Google Scholar]
- 12.McDaniel ML, Kwon G, Hill JR, Marshall CA, Corbett JA. Cytokines and nitric oxide in islet inflammation and diabetes. Proc Soc Exp Biol Med. 1996;211:24–32. doi: 10.3181/00379727-211-43950d. [DOI] [PubMed] [Google Scholar]
- 13.Donath MY, Storling J, Berchtold LA, Billestrup N, Mandrup-Poulsen T. Cytokines and beta-cell biology: from concept to clinical translation. Endocr Rev. 2008;29:334–350. doi: 10.1210/er.2007-0033. [DOI] [PubMed] [Google Scholar]
- 14.Eizirik DL, Colli ML, Ortis F. The role of inflammation in insulitis and beta-cell loss in type 1 diabetes. Nat Rev Endocrinol. 2009;5:219–226. doi: 10.1038/nrendo.2009.21. [DOI] [PubMed] [Google Scholar]
- 15.Donath MY, Storling J, Maedler K, Mandrup-Poulsen T. Inflammatory mediators and islet beta-cell failure: a link between type 1 and type 2 diabetes. J Mol Med. 2003;81:455–470. doi: 10.1007/s00109-003-0450-y. [DOI] [PubMed] [Google Scholar]
- 16.Cnop M, Welsh N, Jonas JC, Jorns A, Lenzen S, Eizirik DL. Mechanisms of pancreatic beta-cell death in type 1 and type 2 diabetes: many differences, few similarities. Diabetes. 2005;54:97–107. doi: 10.2337/diabetes.54.suppl_2.s97. [DOI] [PubMed] [Google Scholar]
- 17.Spranger J, Kroke A, Mohlig M, Hoffmann K, Bergmann MM, Ristow M, et al. Inflammatory cytokines and the risk to develop type 2 diabetes: results of the prospective population-based european prospective investigation into cancer and nutrition (EPIC)-potsdam study. Diabetes. 2003;52:812–817. doi: 10.2337/diabetes.52.3.812. [DOI] [PubMed] [Google Scholar]
- 18.Bertram R, Satin L, Zhang M, Smolen P, Sherman A. Calcium and glycolysis mediate multiple bursting modes in pancreatic islets. Biophys J. 2004;87:3074–3087. doi: 10.1529/biophysj.104.049262. [DOI] [PMC free article] [PubMed] [Google Scholar]
- 19.Nunemaker CS, Zhang M, Wasserman DH, McGuinness OP, Powers AC, Bertram R, et al. Individual mice can be distinguished by the period of their islet calcium oscillations: is there an intrinsic islet period that is imprinted in vivo? Diabetes. 2005;54:3517–3522. doi: 10.2337/diabetes.54.12.3517. [DOI] [PubMed] [Google Scholar]
- 20.Scheen AJ. Pathophysiology of insulin secretion. Ann Endocrinol (Paris) 2004;65:29–36. doi: 10.1016/s0003-4266(04)95627-2. [DOI] [PubMed] [Google Scholar]
- 21.Carter JD, Dula SB, Corbin KL, Wu R, Nunemaker CS. A practical guide to rodent islet isolation and assessment. Biol Proced Online. 2009;11:3–31. doi: 10.1007/s12575-009-9021-0. [DOI] [PMC free article] [PubMed] [Google Scholar]
- 22.Becker PL, Fay FS. Photobleaching of fura-2 and its effect on determination of calcium concentrations. Am J Physiol. 1987;253:613–618. doi: 10.1152/ajpcell.1987.253.4.C613. [DOI] [PubMed] [Google Scholar]
- 23.Roe MW, Lemasters JJ, Herman B. Assessment of fura-2 for measurements of cytosolic free calcium. Cell Calcium. 1990;11:63–73. doi: 10.1016/0143-4160(90)90060-8. [DOI] [PubMed] [Google Scholar]