Abstract
Aphanothece halophytica is a halotolerant alkaliphilic cyanobacterium that can grow in media of up to 3.0 m NaCl and pH 11. Here, we show that in addition to a typical H+-ATP synthase, Aphanothece halophytica contains a putative F1F0-type Na+-ATP synthase (ApNa+-ATPase) operon (ApNa+-atp). The operon consists of nine genes organized in the order of putative subunits β, ϵ, I, hypothetical protein, a, c, b, α, and γ. Homologous operons could also be found in some cyanobacteria such as Synechococcus sp. PCC 7002 and Acaryochloris marina MBIC11017. The ApNa+-atp operon was isolated from the A. halophytica genome and transferred into an Escherichia coli mutant DK8 (Δatp) deficient in ATP synthase. The inverted membrane vesicles of E. coli DK8 expressing ApNa+-ATPase exhibited Na+-dependent ATP hydrolysis activity, which was inhibited by monensin and tributyltin chloride, but not by the protonophore, carbonyl cyanide m-chlorophenyl hydrazone (CCCP). The Na+ ion protected the inhibition of ApNa+-ATPase by N,N′-dicyclohexylcarbodiimide. The ATP synthesis activity was also observed using the Na+-loaded inverted membrane vesicles. Expression of the ApNa+-atp operon in the heterologous cyanobacterium Synechococcus sp. PCC 7942 showed its localization in the cytoplasmic membrane fractions and increased tolerance to salt stress. These results indicate that A. halophytica has additional Na+-dependent F1F0-ATPase in the cytoplasmic membrane playing a potential role in salt-stress tolerance.
Keywords: ATP Synthase, ATPases, F1F0-ATPase, H+-ATPase, Membrane Proteins, Photosynthesis, Sodium Transport
Introduction
The F1F0-type ATP synthase (ATPase) plays vital functions in the energy-transducing membranes of bacteria, mitochondria, and chloroplasts by catalyzing ATP synthesis and hydrolysis coupled with transmembrane proton or sodium ion transport (1). The hydrophilic extramembranous F1 domain consists of five different polypeptides with a stoichiometry of α3β3γδϵ. The integral membrane F0 domain consists of three different polypeptides (a, b, and c) and mediates the transfer of protons or sodium ions across the membrane. The number of c subunits shows substantial variation in different organisms (2). Like F1F0-type ATPases, vacuolar V1V0- and archaea A1A0-type ATPases are also membrane-anchored rotary enzymes, although former functions primarily as an ATP-driven ion pump (1, 3).
Plants are known to have two F-type ATPases, one each in the chloroplast and mitochondria, and one V-type ATPase residing in the vacuole. The cyanobacteria are oxygenic photosynthetic organisms and possess one F-type ATPase in the thylakoid membranes. All of these complexes use proton as the coupling ion (1–3).
To survive at high salinity, living organisms must prevent the excessive Na+ accumulation in the cytoplasm. To date, two types of Na+-transporting mechanisms are known to extrude Na+ from the cytoplasm. The Na+/H+ antiporters are of one type that utilize energy of the transmembrane proton gradient for Na+ translocation (4), whereas another type is the primary ATP-driven Na+-pumps in the plasma membrane (P-type Na+-ATPase) (5, 6). The P-type Na+-ATPase is a single component polypeptide found in many organisms, including yeast. However, the presence of P-type Na+-ATPase in plants and algae seems to be rare.
Aphanothece halophytica is a halotolerant cyanobacterium isolated from the Dead Sea. A. halophytica is known to accumulate betaine and can grow in a wide range of salinity (0.25–3.0 m NaCl) as well as at alkaline pH conditions (7). Previous studies have shown that A. halophytica has a unique biosynthetic pathway of osmoprotectant betaine consisting of three-step methylation of glycine (8) and novel Na+/H+ antiporters such as Ap-NhaP1, Ap-NapA1–1, Ap-NapA1–2, and Ap-Mrp (9–11). From the shotgun sequencing of the whole genome, we found that A. halophytica contains a putative F1F0-type Na+-ATP synthase (ApNa+-ATPase) operon (ApNa+-atp). Isolation of the operon and its functional characterization are described below.
EXPERIMENTAL PROCEDURES
Strains and Culture Conditions
A. halophytica cells were grown photoautotrophically in the BG11 liquid medium containing 18 mm NaNO3 and Turk Island salt solution at 30 °C (7, 12). Synechococcus sp. strain PCC 7942 cells were also grown in the BG11 liquid medium supplemented with 10 mm HEPES-KOH and bubbled with 3% CO2 at 30 °C under continuous fluorescent white light (40 μE m−2 s−1). Escherichia coli DH5α and DK8 (Δatp) (13) cells were grown at 37 °C in Luria-Bertani (LB) medium.
Construction of Expression Plasmids
The ApNa+-atp operon of A. halophytica was amplified by PCR using the primer set ApATPaseBamHI-F/ApATPaseSalI-R. The sequences of ApATPaseBamHI-F and ApATPaseSalI-R are 5′-GGATCCGGAGTTAGGGGCGATGGTACAAT-3′ and 5′-GTCGACGGATGAAGGATGATCACTC-3′, respectively. The amplified fragment was ligated into the EcoRV site of pBSK+ (Stratagene) and sequenced. The insert was then cloned in frame into the BamHI/SalI sites of pTrcHis2C (Invitrogen) with the C-terminal peptide of His6 tag. The resulting plasmid, pTrcHis2C-ApNa+-atp was introduced first to E. coli DH5α and then to DK8 cells (13).
Complementation Tests
For the complementation test, E. coli DK8 cells transformed with pTrcHis2C or pTrcHis2C-ApNa+-atp were grown overnight in LB medium at 37 °C. Cells were plated on to a 1.5% M13 minimal medium agar plate (pH 7.0), containing 42 mm Na2HPO4, 22 mm KH2PO4, 8.5 mm NaCl, 2 mm MgSO4, 0.1 mm CaCl2, 15 μm thiamine, a carbon source (35 mm glucose or 35 mm succinate), and 1 mm isopropyl-β-d-thiogalactopyranoside. Plates were incubated at 37 °C for 2 days. For growth experiments, the E. coli DK8 cells grown in LB medium at the late logarithmic phase were transferred into fresh medium containing various concentrations of NaCl at pH 7.0 with a starting A620 of 0.02.
Preparation of Inverted (Inside Out) Membrane Vesicles from E. coli DK8
Cells were harvested at exponential growth phase and washed with 20 mm Tris-HCl (pH 7.6) containing 1.0 m sucrose. The collected cells were resuspended in extraction buffer (20 mm Tris-HCl, pH 7.6, 1 mm DTT, 1 mm PMSF, and 5 mm MgCl2) with a ratio (g ml−1) of 1.0:2.0. After homogenization, cells were disrupted by two passages through a French pressure cell at 400 kilopascals. Unbroken cells and large debris were removed by centrifugation at 4000 × g for 15 min. The inverted membrane vesicles were sedimented by centrifugation at 100,000 × g for 30 min and resuspended in 50 mm HEPES-KOH, pH 7.0, to a final protein concentration of 1 mg ml−1.
Determination of ATPase Hydrolysis Activity
The ATPase activity was assayed by measuring the release of inorganic phosphate resulting from the hydrolysis of ATP. The reaction mixture (1 ml) contained 20 mm Tris-HCl, pH 7.6, 5 mm MgCl2, 10 mm NaCl, and membrane vesicles (30 μg of protein). The reaction was started by addition 4 mm ATP (Tris salt).
Preparation of Na+-loaded Membrane Vesicles
Inverted membrane vesicles were prepared in 5 mm potassium phosphate, pH 7.5, containing 0.25 mm EDTA and 0.2 m NaCl. After incubation for 1 day, Na+-loaded membrane vesicles were collected by centrifugation at 100,000 × g for 1 h and resuspended again in 5 mm potassium phosphate, pH 7.5, containing 0.25 m EDTA.
Determination of ATP Synthesis
ATP synthesis was measured in the reaction medium (0.5 ml) containing 5 mm potassium phosphate, pH 7.5, 5 mm MgCl2, 0.2 m KCl, 0.1 mm ADP, 1 μm valinomycin, and Na+-loaded-membrane vesicles (30 μg protein). At different time intervals, 50-μl sample was taken out and added immediately to 5 μl of 20% TCA. The samples were then centrifuged at 13,000 × g for 5 min. Aliquot (1 μl) of the supernatant was diluted with 99 μl of distilled water, and the ATP content was determined by luciferin/luciferase reaction.
Expression of ApNa+-atp Operon in the Heterologous Freshwater Cyanobacterium Synechococcus sp. PCC 7942
The pTrcHis2C-ApNa+-atp, which contains the trc promoter, was digested with ScaI and then ligated into the E. coli/Synechococcus shuttle vector pUC303 at the SalI-digested and blunt-ended site. The resulting plasmid, designated as pUC303-ApNa+-atp, was used to transform Synechococcus sp. strain PCC 7942 cells (10). For salt stress experiments, Synechococcus cells were subcultured in BG11 medium as described above but supplemented with 50 μg ml−1 streptomycin. Cells at the late logarithmic phase were transferred into fresh medium containing various concentrations of NaCl (0–0.5 m). The isopropyl-β-d-thiogalactopyranoside (0.5 mm) was used to induce the ApNa+-atp expression under the trc promoter.
Preparation of Inverted Membrane Vesicles from Synechococcus sp. PCC 7942
Cells were harvested at exponential growth phase and washed with 20 mm Tris-HCl, pH 7.6, containing 1.0 m sucrose. The collected cells were resuspended in extraction buffer (20 mm Tris-HCl, pH 7.6, 1 mm DTT, 1 mm PMSF, and 5 mm MgCl2) with a ratio (g ml−1) of 1.0:2.0. After homogenization, the cells were disrupted by two passages through a French pressure cell at 400 kilopascals. Unbroken cells and large debris were removed by centrifugation at 9800 × g for 15 min. The inverted membrane vesicles were sedimented by centrifugation at 100,000 × g for 30 min and resuspended in 50 mm HEPES-KOH, pH 7.0, to a final protein concentration of 1 mg ml−1.
Isolation of Thylakoid and Cytoplasmic Membranes from Synechococcus sp. PCC 7942
The above prepared membrane vesicles (total membrane fraction) were used for the separation of thylakoid and cytoplasmic membranes by sucrose gradient centrifugation at 110,000 × g for 16 h (14). The gradient consisted of four layers: 5.5 ml of 58% sucrose, 4.5 ml of 40% sucrose, 4.5 ml of 30% sucrose, and 4 ml of 10% sucrose layer. Thylakoid membranes remained at the 40/58% sucrose interphase, whereas cytoplasmic membranes moved into the 30% sucrose layer that was essentially free of chlorophyll (14).
Other Methods
The nucleotide sequences were determined using an ABI310 genetic analyzer (Applied Biosystems, Foster City, CA). Cellular ions were determined with a Shimadzu PIA-1000 personal ion analyzer (9). Protein concentration was measured using the Bradford's method. SDS-PAGE and Western blot analysis were carried out as described previously (15). Antibody raised against the His6 tag was obtained from R&D Systems (Minneapolis, MN).
Nucleotide Sequence Accession Number
Nucleotide sequence data of the ApNa+-atp operon from A. halophytica are deposited to the DDBJ database under the accession nos. AB602793, AB602794, and AB602795.
RESULTS
Gene Organization in ApNa+-atp Operon of A. halophytica
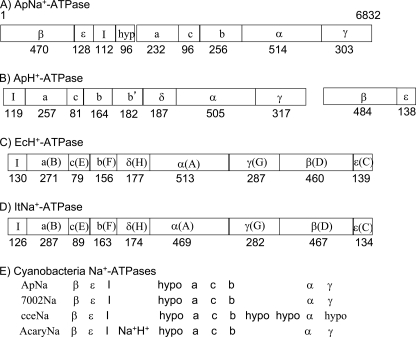
From the shotgun sequence analysis of the A. halophytica genome, we found a putative F1F0-type ApNa+-atp operon in addition to the typical H+-ATPase (ApH+-ATPase) operon (ApH+-atp). The ApNa+-atp operon had nine ORFs, each with a putative start codon. These genes were organized in the order atpD (β), atpC (ϵ), atpI (I), hypothetical gene (hyp), atpB (a), atpE (c), atp F (b), atpA (α), and atp G (γ) (Fig. 1A). By contrast, gene organization of ApH+-atp splits into two clusters, encoding Iacbb′δαγ and βϵ (Fig. 1B). The gene organization of ApNa+-atp is similar to those of the atp operons in E. coli (EcH+-atp) (13, 16) and Ilyobacter tartaricus (ItNa+-atp) (16) that encode F-type H+- and Na+-ATPases, respectively. But, in EcH+-atp and ItNa+-atp, the operon starts from gene I and does not contain the hypothetical gene (Fig. 1, C and D). A Blast search revealed the presence of a similar operon in some cyanobacteria, such as Synechococcus sp. PCC 7002, Acaryochloris marina MBIC11017, and Cyanothece sp. ATCC 51142 (Fig. 1E). Among them, Synechococcus sp. PCC 7002 had the same gene organization to that of ApNa+-atp, whereas in A. marina MBIC11017 and Cyanothece sp. ATCC 51142, additional gene(s) were found.
FIGURE 1.
Schematic structures of gene organization of several ATP synthases. A, ApNa+-ATPase (accession no. AB602793); B, ApH+-ATPase (AB602794, AB602795); C, EcH+-ATPase (E. coli, J01594); D, ItNa+-ATPase (I. tartaricus, AF522463); and E, four kinds of cyanobacterial Na+-ATPases. In A, B, and E, names of encoded proteins are shown. In C and D, both genes and encoded-proteins are shown. In E, ApNa, 7002Na, cceNa, and AcaryNa show the putative Na+-ATPases from A. halophytica (AB602793), Synechococcus sp. PCC7002 (SYNPCC7002_G0144–0152), Cyanothece sp. ATCC 51142 (cce_1502–1512), and A. marina (AM1_D0157–0165), respectively. The numbers of amino acid residues in each subunit are shown below the boxes.
The deduced protein sequences of the nine genes, except the gene encoding hypothetical protein, were compared with the corresponding sequences of ATPase subunits from different species. The protein encoded by ApNa+-atpI showed the least homologous (4–7% identity) compared with the corresponding subunit of H+-transporting ATPase from E. coli and Na+-transporting ATPase from I. tartaricus, Propionigenium modestum, Acetobacterium woodii, and Clostridium paradoxum. The α and β subunits of ApNa+-ATPase showed greater similarity to the corresponding subunits from other species (40–51% identity) than the remaining subunits, which showed ∼15–39% identity.
β Subunit of ApNa+-ATPase Exhibits Higher Homology to Those of ItNa+-ATPase and EcH+-ATPase than That of ApH+-ATPase
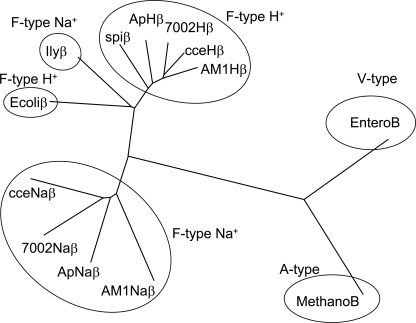
Fig. 2 shows the phylogenetic tree of several ATPases. The β subunit of ApH+-ATPase exhibited high homology to the cyanobacterial H+-ATPases from Synechococcus sp. PCC 7002, A. marina MBIC11017, and Cyanothece sp. ATCC 51142. It also exhibited high homology to that of spinach H+-ATPase, supporting the view that the plant chloroplast originated through endosymbiosis from a cyanobacterium. The β subunit of ApNa+-ATPase exhibited high homology to the Na+-ATPases from Synechococcus sp. PCC 7002, A. marina MBIC11017, and Cyanothece sp. ATCC 51142, but relatively low homology to subunit B of A-type ATPase from Methanosarcina mazei Go1 and V-type ATPase from Enterococcus hirae. This result suggests that cyanobacterial Na+-ATPases are F-type ATPase, and evolved earlier than the separation between cyanobacteria, E. coli, and I. tartaricus.
FIGURE 2.
Phylogenetic trees for β subunit of H+- and Na+-translocating ATPases from several species. F-type Na+ translocating β subunits, AB602793 (ApNaβ), cce_1512 (cceNaβ), SYNPCC7002_G0144 (7002Naβ), AM1_D0157 (AM1Naβ), and AF522463 (IlyNaβ). F-type H+ translocating β subunits, AB602795 (ApHβ), cce_1512 (cceHβ), SYNPCC7002_G0144 (7002Hβ), AM1_D0157 (AM1Hβ), and spinach β subunit (spiβ, NP_054943). An A-type β subunit of Methanosarcina mazei, MetanoB (NP_632803.1) and V-type β subunit of Enterococcus faecalis, EnteroB (NP_815220.1) are shown.
ApNa+-ATPase Has Putative Na+-binding Site in Subunit c
The membrane-spanning helices of the multiple copies of subunit c in the F0 complex are the rotor ring of H+ (or Na+)-translocating ATP synthases (1). Supplemental Fig. S1A shows the phylogenetic tree of subunit c in several ATPases. Subunit c of ApH+-ATPase exhibited high homology to that of cyanobacterial H+-ATPase and spinach H+-ATPase but was considerably different from that of ApNa+-ATPase, which is similar to the phylogenic tree of β subunit. Supplemental Fig. S1B shows the alignment of subunit c of several F-type ATPases. Based on x-ray crystallography, cryo-electron microscopy, and atomic force microscopy studies, the binding sites for H+ and Na+ have been identified (1, 17). The binding site of H+ in subunit c in spinach H+-ATPase has been assigned as Gln (Gln-34, numbering in subunit c of ApNa+-ATPase, Phe (Phe-65), Glu (Glu-67), Thr (Thr-70), and Tyr (Tyr-72), whereas the binding site of Na+ in subunit c of ItNa+-ATPase has been assigned as Gln (Gln-34), Val (Val-65), Glu (Glu-67), Ser (Ser-68), and Tyr (Tyr-72). The H+-binding site (Gln-34, Phe-65, Glu-67, Thr-70, and Tyr-72) was conserved in all cyanobacterial H+-translocating ATPases (supplemental Fig. S1B). For the Na+-binding site, Glu-67, Ser-68, and Tyr-72 were conserved in all cyanobacterial Na+-translocating ATPases. However, the Gln-34 changed to Glu (Glu-34) in all cyanobacterial Na+-ATPases. Val-65 did not change, but Glu-67, Ser-68, and Thr-69 motif were conserved. These results indicate that ApH+-ATPase presumably H+-translocating ATPases, although ion specificity of ApNa+-ATPase need to be tested experimentally.
ApNa+-ATPase and ApH+-ATPase Do Not Have Cys Residues Involved in Redox-induced Activation of Plant ATPase
The plant F-type H+-ATPase has a unique regulatory mechanism, which is caused by a redox change of two cysteine residues located in the γ subunit. Under light, the reducing equivalents produced by photosynthetic electron transport reduce thioredoxin, which in turn reduces the disulfide bond formed within the γ subunit, yielding the active enzyme. The two cysteine residues forming the disulfide bond in the spinach H+-ATPase were assigned to Cys-199 and Cys-205 (18). Supplemental Fig. S2A shows the alignment of the γ subunit of several F-type ATPases. Cys-199 and Cys-205 of spinach H+-ATPase are shown in supplemental Fig. S2A in closed boxes. These cysteines were not conserved in all F-type ATPases from cyanobacteria, E. coli, and I. tartaricus. The spinach γ subunit is unique in having an extra domain around the two cysteine residues as shown by the dotted line box. In the cyanobacterial H+-ATPase, the extradomain was nine residues smaller and did not contain the two cysteine residues. By contrast, in the cyanobacterial Na+-ATPase, that type of extradomain was missing as is the case also in E. coli and I. tartaricus. The phylogenetic tree in supplemental Fig. S2B showed that the γ subunit of spinach H+-ATPase was separated from that of cyanobacterial H+-ATPase, indicating the evolution of unique regulating system in plant H+-ATP synthetases.
Cloning of ApNa+-atp and Expression in E. coli DK8 Cells
To clone the ApNa+-atp operon from A. halophytica, PCR amplification was performed resulting in a 6832-bp PCR product in which the GTG start codon in atpD was changed to ATG. The PCR product was cloned into the EcoRV restriction site of pBSK+ vector and sequenced. Although one nucleotide change from GAG (Glu-41) to GAT (Asp-41) was found in the β subunit, this clone was used for further experiments because the substitution is rather conserved. Then, the insert was digested with BamHI and SalI and subcloned into the BamHI/SalI sites of pTrcHis2C expression vector. The last gene, atpG, was fused in frame with His6 tag.
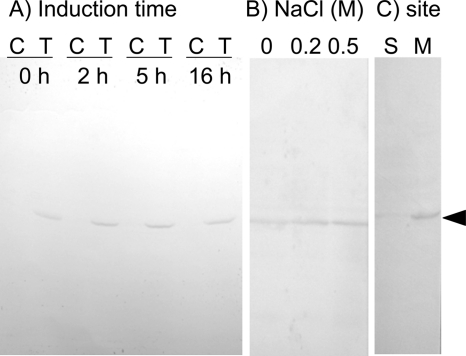
To examine the functional properties of ApNa+-atp, these genes were expressed in the E. coli mutant DK8 lacking the unc operon encoding ATPase (Δatp). As shown in Fig. 3A, the γ subunit of ApNa+-ATPase could be detected in the E. coli DK8 cells transformed with pTrcHis2C-ApNa+-atp but not with the vector alone. The expression was maximum at 2–5 h, and therefore, the 3-h induction time point was employed hereafter, unless otherwise stated. The expression level of γ subunit increased with increase in NaCl concentrations (Fig. 3B). To examine the localization of γ subunit in DK8, E. coli cells expressing ApNa+-atp were fractionated into the cytoplasmic, periplasmic, and membrane fractions, followed by SDS-PAGE and immunoblot analyses. The γ subunit was detected in the membrane fraction (Fig. 3C). These results suggest that the γ subunit and whole complex are assembled into the cytoplasmic membranes of E. coli cells.
FIGURE 3.
Expression of ApNa+-ATPase in E. coli DK8 cells. A, effects of induction time. B, effects of NaCl. C, localization of ApNa+-ATPase. E. coli DK8 cells were grown in the LB medium containing 1 mm isopropyl-β-d-thiogalactopyranoside. In A, the induction time was 0, 2, 5, and 16 h. C and T show the cells-expressing vector only and ApNa+-atp operon, respectively. In B, LB medium contains 0.0, 0.2, and 0.5 m NaCl. In C, the ApNa+-ATPase-expressing cells were fractionated as soluble (S) and membrane (M) fractions. The His tag-containing γ subunit (arrowhead) was detected by immunoblotting.
As a next step, the E. coli membrane fraction was solubilized with Triton X-100, fractionated by 40–65% (g/v) ammonium sulfate, and applied to an ion exchange column chromatography. The active fractions were then used for activity measurements.
ATP Hydrolysis Activity in Inverted Membrane Vesicles of E. coli DK8 Cells
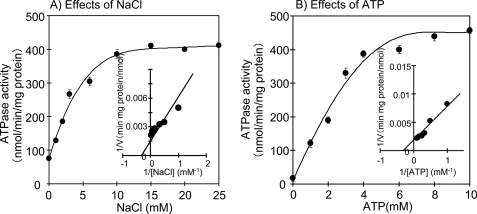
We next examined whether the expressed ApNa+-ATPase has ATP hydrolysis activity. The ATP hydrolysis activity in the inverted membrane vesicles of ApNa+-ATPase-expressing E. coli DK8 cells increased with increasing NaCl concentrations (Fig. 4A). The apparent Km value for Na+ was determined as 3.0 mm. The ATP hydrolysis activity of control cells (the empty vector transformants) was very low and did not increase upon the increase of NaCl concentration (data not shown). The ATP hydrolysis activity of ApNa+-ATPase-expressing E. coli DK8 cells increased with increasing ATP (Fig. 4B); the apparent Km value for ATP was determined to be 2.8 mm. The Na+ content inside the ApNa+-ATPase-expressing E. coli DK8 cells decreased when cells were transferred to a new Na+-free medium, but no change in the Na+ content was observed inside the control cells (data not shown). These results suggest that the E. coli DK8 cells expressing ApNa+-ATPase can extrude Na+ from inside the cells to the external medium.
FIGURE 4.
Effects of NaCl (A) and ATP (B) on ATPase activity in inverted membrane vesicles of ApNa+-ATPase-expressing E. coli DK8. The ATPase activity was assayed by measuring the release of inorganic phosphate resulting from the hydrolysis of ATP. The reaction mixture (1 ml) contained 20 mm Tris-HCl, pH 7.6, 5 mm MgCl2, membrane vesicles (30 μg protein), and various concentrations of NaCl. The reaction was started by addition of 4 mm ATP. All data are the average of three independent experiments with error bars representing S.E.
Effect of Inhibitors on ATP Hydrolysis Activity in Inverted Membrane Vesicles of ApNa+-ATPase-expressing E. coli DK8 Cells
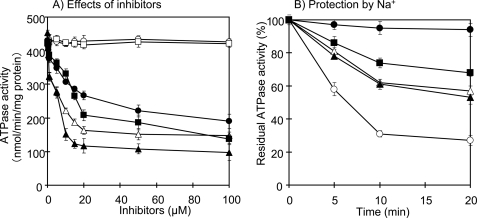
The ATP hydrolysis activity in inverted membrane vesicles of ApNa+-ATPase-expressing E. coli DK8 cells was strongly inhibited by azide (F1 inhibitor; 55%), DCCD2 (F0 inhibitor; 70%), tributyltin chloride (F0 inhibitor; 80%), and monensin (Na+-gradient dissipator; 70%), but not by CCCP (a protonophore) and KNO3 (a permeant anion) (Fig. 5A). Moreover, Na+ provided protection against inhibition by DCCD. When NaCl was added into the individual reaction medium, the DCCD-inhibited ATPase activity was decreased to 70, 40, and 30% in the presence of 1, 10, and 50 mm NaCl, respectively (Fig. 5B).
FIGURE 5.
Effects of inhibitors on ATPase activity in inverted membrane vesicles of E. coli DK8 expressing ApNa+-ATPase and its protection by Na+. A, effects of inhibitors. B, effects of Na+ on the inhibition by DCCD. In A, ATP hydrolytic activity was assayed in the presence of 10 mm NaCl, and each inhibitor was added to the reaction mixture 10 min before the start of the reaction: CCCP (○), KNO3 (□), azide (●), DCCD (■), tributyltin chloride (▴), and monensin (▵). In B, the inverted membrane vesicles was incubated with 200 μm DCCD in 20 mm Tricine-KOH, pH 9.0. The individual mixtures contained NaCl: 0 mm (○), 1 mm NaCl (▴), 10 mm NaCl (▵), and 50 mm NaCl (■). One hundred percent activity corresponded to 423 nmol min−1 (mg protein)−1. Also shown is the control without DCCD (●). Each value shows the average of three independent measurements.
ATP Synthesis in Na+-loaded Inverted Membrane Vesicles of E. coli DK8 Cells
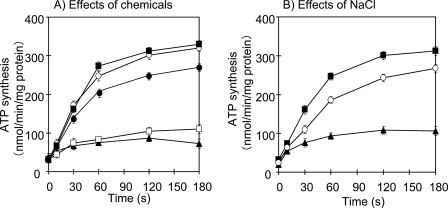
To know whether the expressed ApNa+-ATPase in DK8 cells has ATP synthesis activity, the ATP synthesis activity was assayed using the luciferin/luciferase reaction. The Na+-loaded inverted membrane vesicles of E. coli DK8 cells were prepared and incubated with the reaction medium (0.5 ml) containing 5 mm potassium phosphate, pH 7.5, 5 mm MgCl2, 0.2 m KCl, and 0.1 mm ADP. The ATP synthesis was observed in the membrane vesicles of ApNa+-ATPase-expressing E. coli DK8 cells (Fig. 6A, closed circles), but not in the empty vector transformants (data not shown).
FIGURE 6.
ATP synthesis in Na+-loaded inverted membrane vesicles of E. coli DK8. A, effect of CCCP, DCCD, monensin, and valinomycin on the ATP synthesis in the Na+-loaded inverted membrane vesicles of E. coli DK8 expressing ApNa+-ATPase. ATP synthesis was measured in the reaction medium (0.5 ml) containing 5 mm potassium phosphate, pH 7.5, 5 mm MgCl2, 0.2 m KCl, 0.1 mm ADP, and Na+-loaded-membrane vesicles (30 μg protein) with or without addition of chemicals. Without chemical (●), 1 mm CCCP (■), 1 μm valinomycin (○), 100 μm DCCD (▴), and 10 μm monensin (□) in individual reaction. B, effect of external Na+ on the ATP synthesis in the Na+-loaded membrane vesicles of E. coli DK8 expressing ApNa+-ATPase. ATP synthesis was measured in the presence of 1 μm valinomycin and various NaCl concentrations; 0 mm NaCl (■), 20 mm NaCl (○), and 50 mm NaCl (▴) in individual reaction.
To examine the requirement of Δψ on ATP synthesis, inhibitors and ionophores were added to the reaction medium. Results showed that membrane potential-generating K+/valinomycin and protonophore CCCP stimulated ATP synthesis (Fig. 6A), implying that ATP synthesis requires Δψ but not ΔpH. In contrast, the Na+ gradient dissipator monensin and the F0 inhibitor DCCD inhibited ATP synthesis, suggesting that ATP synthesis by F1F0-ATPase requires ΔpNa+. Furthermore, application of external Na+ (20 and 50 mm NaCl) into the reaction medium decreased the ATP synthesis (Fig. 6B). In other words, decrease in ΔpNa+ due to external Na+ causes decrease in the ATP synthesis.
Expression of ApNa+-ATPase Confers Salt-stress Tolerance in E. coli
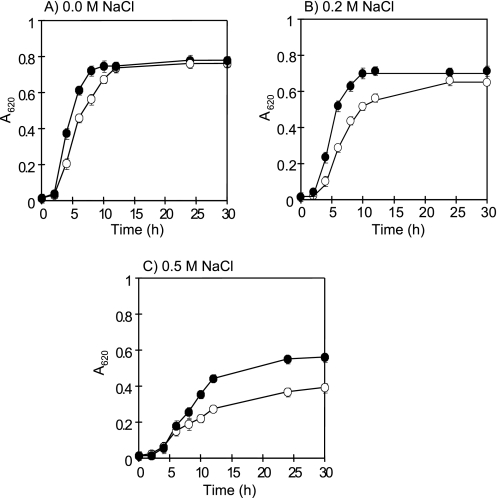
We next investigated the physiological role of ApNa+-ATPase, namely the NaCl-stress tolerance in E. coli. As shown in Fig. 7, E. coli DK8 cells transformed with pTrcHis2C or pTrcHis2C-ApNa+-atp exhibited similar growth patterns in the absence of NaCl. An increase in the NaCl concentration up to 0.2 and 0.5 m NaCl resulted in slow growth of all cells. However, the growth rate of ApNa+-ATPase-expressing cells was higher than that of empty vector transformants. Therefore, the effect of NaCl on growth of a salt-sensitive mutant E. coli TO114, in which nhaA, nhaB, and chaA genes were deleted, was determined. The E. coli TO114 cells transformed with pTrcHis2C-ApNa+-atp grew in the growth medium containing 0.2 m NaCl, whereas the E. coli TO114 cells transformed with pTrcHis2C did not (data not shown). To determine whether ApNa+-atp could complement E. coli DK8 (Δatp), empty vector transformant and ApNa+-ATPase-expressing cells were plated onto M13 minimal medium containing succinate as the sole carbon and energy source. Control plates contained glucose in the same amount as succinate. Results showed that empty vector transformants could grow only on glucose, whereas ApNa+-ATPase-expressing cells could grow on both glucose and succinate (data not shown). Hence, the ApNa+-atp operon encoding F1F0-ATPase was able to produce ATPase in the host cells, supporting the growth of E. coli DK8 on a nonfermentable carbon source.
FIGURE 7.
Effects of NaCl on the growth of E. coli DK8 cells. E. coli DK8 cells were grown in LB medium containing 0.0 m NaCl (A), 0.2 m NaCl (B), and 0.5 m NaCl (C). Open circles represent empty vector transformants, whereas filled circles represent ApNa+-ATPase-expressing cells. Each value shows the average of three independent measurements.
Expression of ApNa+-atp Operon in the Freshwater Cyanobacterium Synechococcus sp. PCC 7942
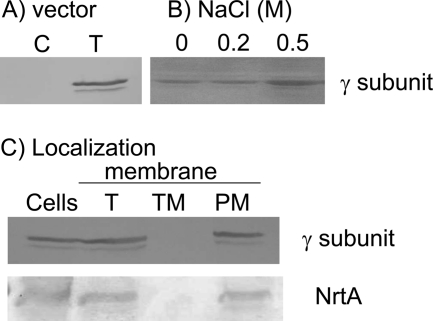
The expression plasmid pUC303-ApNa+-atp containing isopropyl-β-d-thiogalactopyranoside-inducible trc promoter was introduced into Synechococcus sp. strain PCC 7942 cells. The expression of γ subunit of ApNa+-ATPase was detected in the membrane vesicles of ApNa+-ATPase-expressing cells (Fig. 8A). Its expression level increased with the increase of NaCl in the growth medium (Fig. 8B). To examine the localization of ApNa+-ATPase, total membrane fractions were applied on the sucrose density gradient as described in “Experimental Procedures” (14). Thylakoid membranes contained ∼4.1 μg chlorophyll per mg protein, whereas cytoplasmic membranes were essentially free of chlorophyll (data not shown). Moreover, data presented in Fig. 8C revealed that a single protein band of the corresponding molecular mass of γ subunit of ApNa+-ATPase was found in plasma membrane fraction, which was identified by the presence of the nitrate transporter NrtA (19). This indicated that ApNa+-ATPase was localized in the plasma membrane of ApNa+-ATPase-expressing cells.
FIGURE 8.
Immunoblot analysis of ApNa+-ATPase in the membrane vesicles of Synechococcus sp. PCC 7942 cells. A, Synechococcus sp. PCC 7942 cells were transformed with vector (pUC303) (C) or pUC303-ApATPase (T). B, effect of NaCl on the expression of ApNa+-ATPase in the ApNa+-ATPase-expressing cells. The ApNa+-ATPase-expressing cells were grown in the BG11 medium containing 0.0, 0.2, and 0.5 m NaCl. C, localization of ApNa+-ATPase in Synechococcus sp. PCC 7942 cells. The ApNa+-ATPase-expressing cells (Cells) were fractionated as total membrane vesicles (T), thylakoid membrane (TM), and plasma membrane (PM). The γ subunit of ApNa+-ATPase and NrtA of nitrate transporter were detected by immunoblotting with anti-His tag and anti-NrtA (19) antibody, respectively.
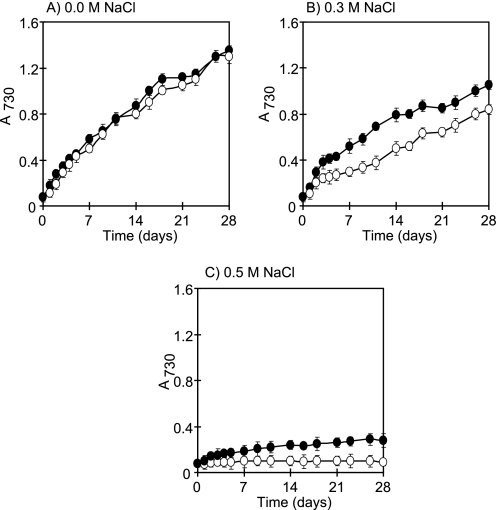
It was shown that all of the transformants could grow at almost the same rate in the BG11 medium (Fig. 9A). At 0.3 m NaCl concentration, the growth rate of both empty vector transformants and ApNa+-ATPase-expressing cells decreased but the growth rate of ApNa+-ATPase-expressing cells is higher than the growth rate of empty vector transformants (Fig. 9B). At 0.5 m NaCl concentration, empty vector transformants could not grow, whereas ApNa+-ATPase-expressing cells could (Fig. 9C), indicating that the ApNa+-atp transformation impaired growth at high salinity.
FIGURE 9.
Effects of NaCl on the growth of Synechococcus sp. PCC 7942 cells. Synechococcus sp. PCC 7942 cells were grown in the BG11 medium containing 0.0 m NaCl (A), 0.3 m NaCl (B), and 0.5 m NaCl (C). Open circles represent the empty vector transformants, whereas filled circles represent the ApNa+-ATPase-expressing cells. Each value shows the average of three independent measurements.
DISCUSSION
The sequence of ApNa+-atp operon was obtained from the shotgun genome sequencing of A. halophytica. Nine ORFs were organized in the order atpD (β), atpC (ϵ), atpI (I), hypothetical gene (hyp), atpB (a), atpE (c), atpF (b), atpA (α), and atpG (γ) (Fig. 1), which is different from other bacteria. In C. paradoxum, E. coli, I. tartaricus, and P. modestum, the atp operon consists of nine structural genes, atpI (I), atpB (a), atpE (c), atpF (b), atpH (δ), atpA (α), atpG (γ), atpD (β), and atpC (ϵ), which are grouped together to form a single transcriptional unit (16–18, 20, 21). The atp operon in a strictly anaerobic A. woodii consists of 11 genes, including nine genes found in the bacterial atp operons and additional two copies of atpE (c) (22). In addition, the structural genes in cyanobacteria Anabaena strain PCC 7210, Synechococcus strain PCC 6301, and Synechocystis sp. PCC 6803 are organized in two separate domains, with one containing atpB (a), atpE (c), atpF (b), atpH (δ), atpA (α), and atpG (γ), whereas the other contained atpD (β) and atpC (ϵ) (23–25). Although the deduced protein sequences of nine ApNa+-ATPase subunits showed low percent identity compared with the corresponding sequences of F-type ATPase subunits from different species, the conserved amino acids Ser68 and Thr69 at the Na+-binding site of the ApNa+-ATPase subunit c were found (supplemental Fig. S1). The Na+-binding site of the I. tartaricus ATPase and H+-binding site of the spinach chloroplast ATPase subunit c were compared (2). Alanine was present at position 62 of the H+-translocating ATPase, whereas a polar serine or threonine was observed in the equivalent position of Na+-translocating ATPase. Likewise, the hydrophobic side chain leucine was found in H+-translocating ATPase at position 63, but threonine was found at the equivalent position of Na+-translocating ATPase. The data presented above clearly indicate that F-typeNa+-ATPase from A. halophytica is a Na+-translocating ATPase.
Furthermore, this study examined the biochemical properties and physiological functions of ApNa+-ATPase. The expression of ApNa+-ATPase in ApNa+-ATPase-expressing cells could impair its growth under high salinity (Fig. 7). The ATP hydolysis activity in inverted membrane vesicles of ApNa+-ATPase-expressing E. coli DK8 was dependent on NaCl and ATP concentration in the reaction medium (Fig. 4). Moreover, the Na+ extrusion from Na+-loaded ApNa+-ATPase-expressing cells was observed after the cells were energized with glucose (data not shown), suggesting that the Na+ extrusion is likely due to the contribution by ApNa+-ATPase because glucose can yield ATP during its metabolism. ApNa+-ATPase was confirmed as a member of F-type Na+-ATPase by using appropriate inhibitors. The ATPase activity was inhibited by azide (F1 inhibitor), DCCD (F0 inhibitor), or tributyltin chloride (F0 inhibitor). In addition, it was found that monensin (Na+-gradient dissipator) inhibited ATPase activity, whereas CCCP (a protonophore) and KNO3 (a permeant anion) did not inhibit activity (Fig. 5A). These data indicate the involvement of ΔpNa+ but not ΔpH on ATP hydrolysis. Furthermore, it was found that Na+ could protect ATPase activity from DCCD inhibition in a pH-dependent manner (Fig. 5B). Using another approach, ATP synthesis was observed in the Na+-loaded membrane vesicles of ApNa+-ATPase-expressing E. coli DK8 cells in the presence of ΔpNa+ and Δψ (Fig. 6). Our data revealed that ATP synthesis was stimulated in the presence of K+/valinomycin. ATP synthesis decreased when external Na+ and monensin (Na+ gradient dissipator) were added because both of them reduced ΔpNa+ (Fig. 6B). Based on these results, it can be concluded that ATP synthesis catalyzed by ApNa+-ATPase requires ΔpNa+.
As per the above data, we thought that the introduction of ApNa+-atp operon into the freshwater cyanobacterium Synechococcus sp. PCC 7942 will confer salt tolerance to this organism. As expected, the ApNa+-ATPase-expressing cells could grow in the BG11 medium containing 0.5 m NaCl, whereas the empty vector transformants could not (Fig. 9). From these results, ApNa+-atp transformation could improve salt tolerance in the freshwater cyanobacterium Synechococcus sp. PCC 7942 as well as E. coli DK8 mutant (Δatp) and salt-sensitive mutant E. coli TO114. Western blot analysis revealed that the expression level of γ subunit of ApNa+-ATPase increased with increasing NaCl concentration in the growth medium (Fig. 8B). Taken together, our results strongly suggest a role for ApNa+-ATPase in the salt-stress tolerance of this photosynthetic organism.
Acknowledgment
We thank Professor T. Omata (Nagoya University) for the generous gift of the nitrate transporter antibody.
This work was supported in part by grants-in-aid for scientific research from the Ministry of Education, Science, and Culture of Japan; the Salt Science Research Foundation; and the High-Technology Research Center of Meijo University. This work was also supported by the Royal Golden Jubilee Ph.D. program and the 90th Anniversary of Chulalongkorn University Fund (Ratchadaphiseksomphote Endowment Fund) (to K. S.).

The on-line version of this article (available at http://www.jbc.org) contains supplemental Figs. S1 and S2.
- DCCD
- N,N′-dicyclohexylcarbodiimide
- CCCP
- carbonyl cyanide m-chlorophenyl hydrazone.
REFERENCES
- 1. von Ballmoos C., Wiedenmann A., Dimroth P. (2009) Annu. Rev. Biochem. 78, 649–672 [DOI] [PubMed] [Google Scholar]
- 2. Vollmar M., Schlieper D., Winn M., Büchner C., Groth G. (2009) J. Biol. Chem. 284, 18228–18235 [DOI] [PMC free article] [PubMed] [Google Scholar]
- 3. Beyenbach K. W., Wieczorek H. (2006) J. Exp. Biol. 209, 577–589 [DOI] [PubMed] [Google Scholar]
- 4. Zhu J. K. (2003) Curr. Opin. Plant Biol. 6, 441–445 [DOI] [PubMed] [Google Scholar]
- 5. Shono M., Hara Y., Wada M., Fujii T. (1996) Plant Cell Physiol. 37, 385–388 [Google Scholar]
- 6. Balnokin Y. V., Popova L. G. (1994) FEBS Lett. 343, 61–64 [DOI] [PubMed] [Google Scholar]
- 7. Waditee R., Hibino T., Tanaka Y., Nakamura T., Incharoensakdi A., Takabe T. (2001) J. Biol. Chem. 276, 36931–36938 [DOI] [PubMed] [Google Scholar]
- 8. Waditee R., Tanaka Y., Aoki K., Hibino T., Jikuya H., Takano J., Takabe T., Takabe T. (2003) J. Biol. Chem. 278, 4932–4942 [DOI] [PubMed] [Google Scholar]
- 9. Wutipraditkul N., Waditee R., Incharoensakdi A., Hibino T., Tanaka Y., Nakamura T., Shikata M., Takabe T., Takabe T. (2005) Appl. Environ. Microbiol. 71, 4176–4184 [DOI] [PMC free article] [PubMed] [Google Scholar]
- 10. Waditee R., Hibino T., Nakamura T., Incharoensakdi A., Takabe T. (2002) Proc. Natl. Acad. Sci. U.S.A. 99, 4109–4114 [DOI] [PMC free article] [PubMed] [Google Scholar]
- 11. Fukaya F., Promden W., Hibino T., Tanaka Y., Nakamura T., Takabe T. (2009) Appl. Environ. Microbiol. 75, 6626–6629 [DOI] [PMC free article] [PubMed] [Google Scholar]
- 12. Waditee R., Hossain G. S., Tanaka Y., Nakamura T., Shikata M., Takano J., Takabe T., Takabe T. (2004) J. Biol. Chem. 279, 4330–4338 [DOI] [PubMed] [Google Scholar]
- 13. Moriyama Y., Iwamoto A., Hanada H., Maeda M., Futai M. (1991) J. Biol. Chem. 266, 22141–22146 [PubMed] [Google Scholar]
- 14. Berger S., Ellersiek U., Steinmüller K. (1991) FEBS Lett. 286, 129–132 [DOI] [PubMed] [Google Scholar]
- 15. Waditee R., Bhuiyan N. H., Hirata E., Hibino T., Tanaka Y., Shikata M., Takabe T. (2007) J. Biol. Chem. 282, 34185–34193 [DOI] [PubMed] [Google Scholar]
- 16. Walker J. E., Saraste M., Runswick M. J., Gay N. J. (1982) EMBO J. 1, 945–951 [DOI] [PMC free article] [PubMed] [Google Scholar]
- 17. Meier T., von Ballmoos C., Neumann S., Kaim G. (2003) Biochim. Biophys. Acta 1625, 221–226 [DOI] [PubMed] [Google Scholar]
- 18. Miki J., Maeda M., Mukohata Y., Futai M. (1988) FEBS Lett. 232, 221–226 [DOI] [PubMed] [Google Scholar]
- 19. Omata T. (1995) Plant Cell Physiol. 36, 207–213 [DOI] [PubMed] [Google Scholar]
- 20. Ferguson S. A., Keis S., Cook G. M. (2006) J. Bacteriol. 188, 5045–5054 [DOI] [PMC free article] [PubMed] [Google Scholar]
- 21. Kaim G., Ludwig W., Dimroth P., Schleifer K. H. (1992) Eur. J. Biochem. 207, 463–470 [DOI] [PubMed] [Google Scholar]
- 22. Rahlfs S., Aufurth S., Müller V. (1999) J. Biol. Chem. 274, 33999–34004 [DOI] [PubMed] [Google Scholar]
- 23. Curtis S. E. (1987) J. Bacteriol. 169, 80–86 [DOI] [PMC free article] [PubMed] [Google Scholar]
- 24. Cozens A. L., Walker J. E. (1987) J. Mol. Biol. 194, 359–383 [DOI] [PubMed] [Google Scholar]
- 25. Lill H., Nelson N. (1991) Plant. Mol. Biol. 17, 641–652 [DOI] [PubMed] [Google Scholar]


