

Abstract
All mammals have 50–100 μm mannose in their blood. However, the source of the dynamic pool of mannose in blood is unknown. Most of it is thought to be derived from glucose in the cells. We studied mannose uptake and release by various cell types. Interestingly, our results show that mannose taken up by the cells through transporters is handled differently from the mannose released within the cells due to glycan processing of protein-bound oligosaccharides. Although more than 95% of incoming mannose is catabolized, most of the mannose released by intracellular processing is expelled from the cells as free mannose predominantly via a nocodazole-sensitive sugar transporter. Under physiological conditions, incoming mannose is more accessible to hexokinase, whereas mannose released within the cells is protected from HK and therefore has a different fate. Our data also suggest that generation of free mannose due to the processing of glycoconjugates composed of glucose-derived mannose and its efflux from the cells can account for most of the mannose found in blood and its steady state maintenance.
Keywords: Carbohydrate Processing, Cell Metabolism, Glycoconjugate, Glycosylation, Oligosaccharide, Congenital Disorders of Glycosylation, N-Glycan Processing, Hexokinase, Hexose Transport, Mannose
Introduction
Mannose is an important constituent of N-glycans. The addition of high mannose oligosaccharides to the newly synthesized polypeptide chain and their subsequent processing provide diversity to N-glycan structures. Mannose residues in N-glycans can be derived from either glycogen/glucose or mannose in the blood. Blood has a metabolically active pool of 50–150 μm mannose in steady state; however, mannose homeostasis is not well understood (1). Dietary contribution is insignificant (2), arguing that most of it is probably derived from an endogenous source. Mannose enters the cells via hexose transporters present at the plasma membrane. It is immediately phosphorylated by hexokinase (HK)2 and then either catabolized via mannose phosphate isomerase (MPI) or diverted toward glycosylation through phosphomannomutase-2 (PMM2) (Scheme 1).
SCHEME 1.

Mannose metabolic pathway.
Glycosylation precursors, such as mannose 1-phosphate, GDP-mannose, and dolichol phosphate mannose, are used to assemble lipid-linked oligosaccharides (LLO). The glycan portion is then transferred to proteins (3). Mannose, which is incorporated into N-glycans, is trimmed down by mannosidases within the endoplasmic reticulum (ER) and Golgi to generate free mannose. In this study, we show that although more than 95% mannose entering the cell is catabolized, surprisingly, more than 50% of mannose derived from glycan processing and degradation is protected from catabolism and exits the cells as free mannose, most probably via a transporter. This mannose efflux from the cells can account for the majority of mannose found in mammalian blood.
EXPERIMENTAL PROCEDURES
Materials
Most of the reagents were purchased from Sigma except BCA protein assay reagent (Pierce). α-Minimal essential medium, Dulbecco's modified Eagle's medium (DMEM) with and without glucose, DMEM/F-12 (1:1) medium, and equine serum were from Invitrogen. Fetal bovine serum was obtained from Hyclone Laboratories (Logan, UT). Concanavalin A-Sepharose was from Amersham Biosciences.
Radiolabels
[2-3H]Mannose was obtained from PerkinElmer Life Sciences. [6-3H]Glucose (60 Ci/mmol) and [14C]mannose (50 mCi/mmol) were from American Radiolabeled Chemicals, Inc. (St. Louis, MO).
Cell Lines
C3a hepatoma cells, HK293 cells, CHO-K2 hamster ovary cells, SKNSH neuroblasts, CRL2254 hepatocytes, and CRL1947 fibroblasts were obtained from American Type Culture Collection. Human umbilical vein endothelial cells were from Cell Application, Inc. (San Diego, CA). C2C12 skeletal muscle cells and CHO cell mutant, MI-54, were generous gifts from Drs. Eva Engvall and Sharon Krag, respectively. The cells were grown either in α-minimal essential medium or DMEM containing 2 mm glutamine, 10% fetal bovine serum, and penicillin/streptomycin. Human umbilical vein endothelial cells were grown in endothelial cell medium, from Cell Applications, Inc. Hepatocytes required DMEM/F-12 (1:1) with insulin/transferrin/selenium supplement, 40 ng/ml dexamethasone, and 10% fetal bovine serum for growth. C2C12 skeletal muscle cells were differentiated in high glucose DMEM containing 2% equine serum.
Pulse-Chase Labeling of Cells with [2-3H]Mannose
The cells were grown in individual 60-mm dishes or 6-well plates to 70% confluence and labeled for 1 h at 37 °C in DMEM containing 0.5 mm glucose and 16.6 μCi/ml [2-3H]mannose. Medium was collected, and the cells were washed twice to remove free radiolabel. This was followed by the addition of label-free DMEM containing 5 mm glucose, and the dishes were incubated at 37 °C. In some experiments, the chase medium contained different monosaccharides, sugar analogues, and inhibitors as specified. At each time point, one dish was harvested. After removing the medium, the cells were washed and scraped into either phosphate-buffered saline (PBS) or chloroform/methanol (2:1), depending on the requirement of the experiment.
Analysis of 3H2O in Chase Medium
An aliquot of the medium was used to determine radioactivity with and without evaporation to dryness. The difference was defined as the amount of 3H2O in the medium.
Analysis of [2-3H]Mannose in Chase Medium
Free [2-3H]Mannose in the chase medium was determined by converting it to 3H2O using HK and MPI, followed by its evaporation. The difference between radioactivity with and without evaporation was defined as the amount of [2-3H]mannose in the medium.
Isolation of Glycosylation Intermediates
The cells scraped in chloroform/methanol (2:1) were extracted three times with 1 ml of chloroform/methanol (2:1) (fraction I) followed by three extractions with water (fraction II) and then with chloroform/methanol/water (10:10:3) (fraction III). Finally, the protein pellet was solubilized in 0.1% SDS. In some cases, N-linked oligosaccharides were released with PNGase F (4). Free oligosaccharides were separated from the rest of the water-soluble molecules by subjecting fraction II to concanavalin A-Sepharose affinity chromatography.
Uptake of [2-3H]Mannose by Various Cells
[2-3H]Mannose radiolabel was dried down and resuspended in water just before the experiment to eliminate traces of 3H2O. Seven different cell lines were grown to 70% confluence and labeled with [2-3H]mannose (33 μCi/ml) for 3 h in DMEM containing physiological concentration of glucose (5 mm) and mannose (50 μm) in a volume of 1.5 ml. 10-μl aliquots were withdrawn after every half hour. At the end of the labeling, the cells were washed and solubilized in 0.1% SDS. Radiolabel in the cell lysate and TCA-precipitated secreted protein in the medium was determined. The medium aliquots were analyzed for 3H2O (as described for chase medium), and background at the zero time point was subtracted to obtain the actual values.
Immunostaining of C3a Cells in the Presence and Absence of Paclitaxel
The cells were grown on round glass coverslips and transferred to four different dishes. The cells were incubated in 0.5 mm glucose DMEM at 37 °C. After 30 min, indicated reagents were added and incubated for another 30 min. The medium was removed, and cells were incubated with fresh 5 mm glucose DMEM with the same additions as mentioned above for 90 min. The cells were fixed with 4% paraformaldehyde, permeabilized with 0.2% Triton X-100, and stained for α-tubulin.
Monosaccharide Analysis of [3H]Glucose- and [14C]Mannose-labeled Glycoproteins
The cells were labeled for 1 h with [6-3H]glucose and [14C]mannose at the same specific activity in the medium containing 5 mm glucose and 50 μm mannose. At the end of the labeling, the cells were washed, sonicated, treated with amyloglucosidase for 30 min, and solubilized in 0.1% SDS. Glycoproteins were precipitated from cell lysates with trichloroacetic acid, solubilized, and digested with PNGase F. The released oligosaccharides were separated on a Sephadex G-50 gel filtration column. Fractions containing the oligosaccharides were pooled, dried, and subjected to strong acid hydrolysis using 2 m trifluoroacetic acid at 100 °C for 4 h. The acid was evaporated, and the residue was solubilized in water. The sample was analyzed for monosaccharides by HPAEC-PAD on a CarboPac PA1 column by the Glycotechnology Core Facility at the University of California, San Diego. The column effluent was collected and assayed by liquid scintillation counting.
RESULTS
Our goal is to understand mannose homeostasis in the blood. We studied the fate of mannose entering the cells via transporters as well as free mannose generated inside the cells by glycan processing and degradation. We used [2-3H]mannose for these experiments because radiolabel appears in H2O if [2-3H]mannose is catabolized through MPI ([2-3H]mannose → [2-3H]Man-6-P → fructose 6-phosphate + 3H2O); otherwise, it is incorporated into glycoproteins primarily as [3H]mannose (Scheme 1) and to a small extent as [3H]fucose.
Initial Fate; The Majority of Mannose Entering the Cells Is Catabolized
Mannose enters a cell through a family of hexose transporters (5). We first determined the rate of [2-3H]mannose uptake in several mammalian cell lines under physiological concentrations of 5 mm glucose and 50 μm mannose. Under these conditions, mannose uptake varied between 6.5 and 23.0 nmol/h/mg protein (Table 1). The great majority of mannose (>95%) that entered the cell was catabolized via MPI and then presumably through glycolysis as estimated by radiolabel present in 3H2O (Table 1). Cell-associated radioactivity in [2-3H]mannose, primarily as N-glycans, accounted for only 2–4%.
TABLE 1.
Mannose uptake by the cells and percentage catabolized
Different cells were labeled in DMEM containing 5 mm glucose, 50 μm mannose, and 50 μCi of [2-3H]mannose, as described under “Expermental Procedures.” Total mannose uptake was determined using values for 3H2O in the medium, 3H radiolabel in secreted glycoproteins, and cell-associated 3H radiolabel.
| Cell lines | Uptake | Mannose catabolized |
|---|---|---|
| nmol/mg/h | % | |
| SKNSH neuroblastoma | 23.0 | 96.2 |
| CRL1947 fibroblasts | 10.8 | n.d. |
| C3a hepatoma cells | 10.0 | 96.5 |
| C2C12 muscle cells | 10.0 | 98.0 |
| 42F fibroblasts | 7.7 | 98.0 |
| HUVEC | 4.3 | 98.0 |
| Primary hepatocytes | 1.7 | 96.0 |
C3a hepatoma cells were used to further study mannose utilization in detail because the liver is the major site for plasma glycoprotein synthesis. A small percentage of incoming mannose used for N-glycosylation is found in glycosylation precursors, such as mannose 1-phosphate, Man-6-P, GDP-mannose, and dolichol phosphate mannose, which make LLO (Scheme 1). The oligosaccharide portion from LLO is then transferred to newly synthesized proteins in the ER. Efficiency of this transfer is incomplete; therefore, some of the LLO glycans are hydrolyzed to free glycans (6) and transported from the ER to the cytoplasm (7). Glycans on improperly folded proteins exported from the ER are cleaved by cytoplasmic endo- and exoglycosidases, further adding to the free glycan pool (8). Incubation of C3a hepatoma cells with [2-3H]mannose-labeled Man-6-P and Man-1-P within a few seconds and GDP-mannose within 5 min as determined by high pressure liquid chromatography (HPLC). Labeled LLO and free glycans reached a steady state in 15 and 30 min, respectively (Fig. 1).
FIGURE 1.

Steady state levels of precursors during labeling. C3a cells were labeled with [2-3H]mannose in DMEM containing 0.5 mm glucose. At the indicated times, the medium was collected, and the cells were extracted as mentioned under “Experimental Procedures.” Glycosylation intermediates were measured using standard protocols.
Post-steady State; Free Mannose inside the Cells Obtained from Glycan Processing Is Less Prone to Catabolism
C3a cells were radiolabeled with [2-3H]mannose for 1 h to allow all precursors to reach steady state. When these labeled cells were chased in fresh medium without radiolabel, LLO turned over with a t½ of 15 min (Fig. 2a), which is consistent with previous studies (9). Water-soluble oligosaccharides or free glycan pool turned over much more slowly. This could be due to either a slow degradation rate or an ongoing influx of free glycans. Because HPLC profiles show continuous trimming of high mannose oligosaccharides (data not shown), it is probably due to continuous influx of oligosaccharides from LLO hydrolysis labeled in the initial phase. Free glycans were then degraded subsequently. More than 50% of the radiolabel from cell-associated proteins decreased within the first 2 h, followed by a much slower loss over the next 4 h (Fig. 2a).
FIGURE 2.

a, pulse-chase depicting turnover of various glycosylation intermediates. C3a cells were labeled in DMEM containing 0.5 mm glucose and 50 μCi of [2-3H]mannose for 1 h. The cells were washed and chased in fresh DMEM with 5 mm glucose. At the indicated times, the medium was collected, and the cells were extracted as mentioned under “Experimental Procedures.” Glycosylation intermediates were measured using standard protocols. b, total radiolabel associated with cells and medium at each time point was determined during chase. c, composition of the medium during pulse-chase. At different time points, free [3H]mannose, 3H2O, and 3H-labeled protein were estimated as described under “Experimental Procedures.” The results shown are representative of two such experiments.
We determined the loss of total 3H radiolabel from the cells and its appearance in the chase medium containing 5 mm glucose. The appearance of radiolabel in the medium corresponded to the total radiolabel lost from the cells, and the total radioactivity remained constant (Fig. 2b).
Next, we determined the identity of radiolabel in the chase medium. Because our initial experiment showed that more than 95% of the incoming [2-3H]mannose was catabolized and converted to 3H2O (Table 1), we expected radiolabel in chase medium to be predominantly 3H2O. Surprisingly, more than 50–60% of radioactivity was present as free mannose (Fig. 2c). Only 5–10% was associated with secreted proteins, and the remaining radioactivity was in 3H2O. This result suggests that mannose released within the cells is not catabolized. This is not unique to C3a hepatoma cells because we obtained similar results with six other cell lines, including fibroblasts and muscle cell lines (data not shown).
This observation raised three important questions. (i) What is the major source of free mannose inside the cells? (ii) How does mannose exit the cell? (iii) Why does mannose turned over inside the cells have a different fate from mannose entering the cells?
Majority of Endogenous Free Mannose Is Contributed by Glycan Processing
Free mannose is produced inside the cells by (i) ER/Golgi-processing mannosidases acting on protein-bound N-glycans and (ii) cytoplasmic α-mannosidases and acidic lysosomal α- and β-mannosidases involved in glycoprotein catabolism.
The radioactivity associated with cellular proteins decreased by 60% within the first 2 h (Fig. 2a), but only a small portion (5–10%) of this is due to protein secretion (Fig. 2c). This decrease could be potentially due to processing of protein-bound N-glycans in the ER and Golgi, where the majority of N-glycan-bound mannose is trimmed to give rise to diverse glycan structures.
C3a cells were labeled with [2-3H]mannose and then chased in fresh medium in the presence of α-mannosidase inhibitors and/or lysosomotropic agents: swainsonine (Golgi mannosidase II, lysosomal α-mannosidases inhibitors), deoxymannojiramycin (mannosidase I inhibitor), kifunensine (Golgi mannosidase inhibitor), and ammonium chloride and chloroquine (lysosomal pH inhibitors).
A combination of α-mannosidase inhibitors and lysosomotropic agents blocked the appearance of 3H radiolabel in the medium by 70–80% (Fig. 3), of which 55–65% of the label was inhibited by α-mannosidase inhibitors alone. These results show that most of the label that appeared in the medium was due to N-glycan processing and to a lesser extent by lysosomal degradation. Pulse-chase experiments using [2-3H]mannose on several cell lines showed that all of the cells export mannose generated from glycan processing from the cells, the majority of which could be inhibited by α-mannosidase inhibitors (Table 2), thus implying that this phenomenon was not unique to hepatoma cells but is exhibited by most cell types.
FIGURE 3.

Glycan processing contributes the majority of mannose secreted in the medium. C3a cells were labeled for 1 h with 50 μCi of [2-3H]mannose in DMEM containing 0.5 mm glucose and then chased in 5 mm glucose DMEM with a mixture of mannosidase inhibitors (MI) (50 μg/ml kifunensine, 20 μg/ml swainsonine, 20 μg/ml deoxymannojiramycin) and/or lysosomotropic agents (1 mm chloroquine (CHlQ) or 10 mm ammonium chloride (NH4Cl)) for 1 h. Radiolabel was measured in the medium. The data are an average of triplicate determinations.
TABLE 2.
Effect of mannosidase inhibitors and lysosomotrphic agents on different cell lines
Seven other cell lines were treated as mentioned in Fig. 3. The data represent an average of triplicate determinations. MI, mannosidase inhibitor; HUVEC, human umbilical vein endothelial cells.
| Cell type | Inhibition by CH1Q and MI |
|---|---|
| % | |
| 293 kidney cells | 42 ± 3.0 |
| C3a hepatoma cells | 72 ± 2.5 |
| CHO cells | 45 ± 2.0 |
| 42F fibroblasts | 61 ± 1.7 |
| HUVEC | 66 ± 2.6 |
| SKNSH neuroblastoma | 51 ± 3.2 |
| CRL1947 fibroblasts | 79 ± 6.5 |
| C2C12 muscle cells | 65 ± 8.7 |
It has been shown that protein degradation and release of free polymannose oligosaccharides are coupled events in the cytoplasm; therefore, proteosome inhibitors reduce the appearance of free oligosaccharides in the cytoplasm (10). When pulse-chase was done in the presence of proteosome inhibitors like MG-132 and ALLN, there was no effect on the appearance of [3H]mannose in the medium, which suggests minimal contribution resulting from glycoprotein degradation (data not shown).
Our results indicated that free mannose in the chase medium was primarily contributed by the mannose released by N-glycan processing in ER and Golgi, which also explained rapid loss of more than 50% 3H radiolabel from cellular protein in the first 1–2 h followed by much slower loss afterward.
Mannose Efflux from the Cells Is Nocodazole-sensitive
To appear in the medium, mannose generated in ER and Golgi must cross ER/Golgi membranes as well as the plasma membrane. The appearance of mannose in the medium can be explained in several ways: (i) diffusion through ER/Golgi and plasma membranes; (ii) facilitated diffusion transporters; or (iii) vesicle-mediated route and fusion with the plasma membrane.
With a diffusion constant of 10−10 cm/s for hexose sugar through the lipid bilayer, it would take ∼50–150 min to cross a cell membrane of 3–10 nm (11). This time would double for crossing two membranes. In our experiments, we saw immediate release of free mannose within 2–5 min, which rules out simple diffusion as the mechanism of mannose loss from the cell.
To determine if mannose exits cells through a vesicular route, the cells were labeled with [2-3H]mannose and then chased in the presence of various inhibitors of vesicular transport, which block different steps of vesicle-mediated trafficking. Brefeldin A induces tubulation of secondary endosomes and lysosomes as well as merging of Golgi with ER, which disrupts trafficking of transport vesicles within the cell (12). Nocodazole and colchicine are microtubule-depolymerizing agents (13, 14), and bafilomycin A is an inhibitor of vacuolar H+-ATPase that prevents lysosomal acidification (15). None of the inhibitors had any effect on mannose transport (data not shown) except for nocodazole.
Nocodazole inhibited mannose efflux in a dose-dependent fashion (Fig. 4a). Although nocodazole is a microtubule-disrupting agent, it also inhibits glucose transporters, independent of its effect on microtubules (16). If the inhibition of mannose transport by nocodazole is due to microtubule disruption, then the addition of paclitaxel (taxol), a microtubule-stabilizing reagent (17), should reverse the inhibitory effect. When the chase was done in the presence of 40 μm paclitaxel and 25 μm nocodazole, inhibition of mannose efflux was still observed (Fig. 4b). We checked microtubule stabilization by immunofluorescence. Nocodazole-treated cells showed no staining of microtubules because of the depolymerization (Fig. 4e) as compared with untreated cells (Fig. 4c) and paclitaxel-treated cells (Fig. 4d), where microtubules are intact. Paclitaxel (40 μm) stabilized microtubules even in the presence of 25 μm nocodazole (Fig. 4f). Colchicine, which is another microtubule-depolymerizing agent, did not show any effect on mannose efflux (data not shown). All of these results clearly demonstrate that nocodazole is able to inhibit a sugar transporter that is responsible for mannose efflux, and the effect of nocodazole is not due to inhibition of vesicular transport.
FIGURE 4.

a, nocodazole inhibits mannose efflux. C3a cells were labeled for 1 h. After 30 min, during labeling, the indicated amount of nocodazole was added for preincubation. This was followed by a chase in fresh DMEM containing the indicated amounts of nocodazole. At different times, an aliquot of medium was collected, and [3H]mannose was estimated using hexokinase and MPI (as mentioned under “Experimental Procedures”). b, inhibition of mannose release by nocodazole is independent of microtubule depolymerization. The procedure is the same as mentioned above except that chase was done for 1 h with medium containing nocodazole either in the absence or presence of taxol. Free [3H]mannose was estimated in the medium using hexokinase and MPI (as mentioned under “Experimental Procedures”). c–f, microtubule stabilization by paclitaxel under experimental conditions. C3a cells were grown on glass coverslips and treated with nocodazole in the absence (e) and presence (f) of paclitaxel as described under “Experimental Procedures” and compared with no treatment (c) and paclitaxel alone (d). The cells were fixed, permeabilized, and stained for α-tubulin. Error bars, S.E.
Mannose Pool Generated inside the Cells by Glycan Processing Is Shielded from Hexokinase
When we added phloretin, an inhibitor of facilitated hexose transporter to the chase medium, interestingly, we observed the same amount of radiolabel in the medium, but the proportion of 3H2O increased and [2-3H]mannose decreased (Fig. 5a). In other words, more endogenous free [2-3H]mannose obtained from glycan processing was catabolized ([2-3H]Man → [2-3H]Man-6-P → fructose 6-phosphate + 3H2O) in the presence of phloretin. Phloretin blocks facilitative hexose transporters on the plasma membrane, which inhibits influx of glucose (5 mm) present in the chase medium. Incoming glucose competes for cellular enzymes with endogenous free mannose that is released within the cells. There are two enzymes involved in the production of 3H2O from [2-3H]mannose, HK and MPI (Scheme 1). Protection of endogenously released mannose from one of these enzymes could explain the differential fate of this pool from the fate of incoming mannose.
FIGURE 5.

Effect of phloretin, sugars, and sugar analogs. C3a cells were labeled with [2-3H]mannose for 1 h. This was followed by a chase in fresh DMEM containing the indicated amounts of the additives. a, phloretin-[3H]mannose and 3H2O were determined in the medium. Sugars (b) and sugar analogs (c) 3H2O were estimated in the medium. The data represent the average of triplicate determinations. Error bars, S.E.
Pulse-chase experiments with human CDG-Ib cells deficient in MPI by 95% did not show any change in the proportion of [2-3H]mannose and 3H2O produced, making it unlikely that a limitation of MPI is responsible for the accumulation of [2-3H]mannose in the medium (data not shown). To determine if HK is the limiting enzyme, various sugars and sugar analogs were tested as extracellular competitors. Glucose, mannose, and 2-deoxyglucose are HK substrates, whereas fructose, galactose, and 6-deoxyglucose are not HK substrates. Increasing the concentration of exogenous glucose, mannose, and glucose analog, 2-deoxyglucose, in the chase medium decreased the proportion of 3H2O in the medium, whereas fructose, galactose, and 6-deoxyglucose did not (Fig. 5, b and c). These results were consistent with glucose, mannose, and 2-deoxyglucose competing with endogenous mannose for either hexokinase or ATP. Fructose and galactose require ATP for activation and do not require hexokinase to phosphorylate the substrate to its 1-phosphate form. Thus, it is more likely that exogenous glucose and mannose compete with the released [2-3H]mannose for HK rather than competition for a limited amount of ATP.
In order to further confirm our hypothesis, we chose a CHO cell mutant, MI-54, with a 90% deficiency in hexokinase activity (4.3 ± 1.2 nmol/min/mg) compared with wild type (32.5 ± 2.5 nmol/min/mg). In a cell line that is already limited for HK, a lower concentration of exogenous sugar should be able to compete with endogenous [2-3H]mannose for HK as compared with wild type in reducing the proportion of 3H2O in the medium. When labeled cells were chased with different concentrations of glucose, as low as 0.1 mm glucose could compete with hexokinase, resulting in decreased catabolism of [2-3H]mannose compared with wild type, which required 2.5 mm (Fig. 6). Our results clearly demonstrate that mannose released from glycan processing and degradation is much less accessible to hexokinase than mannose taken up by the cells through transporters. As a result, endogenous mannose released within the cell is released as free mannose. This return of endogenous mannose to the medium would probably contribute substantial amounts of mannose to mammalian plasma.
FIGURE 6.
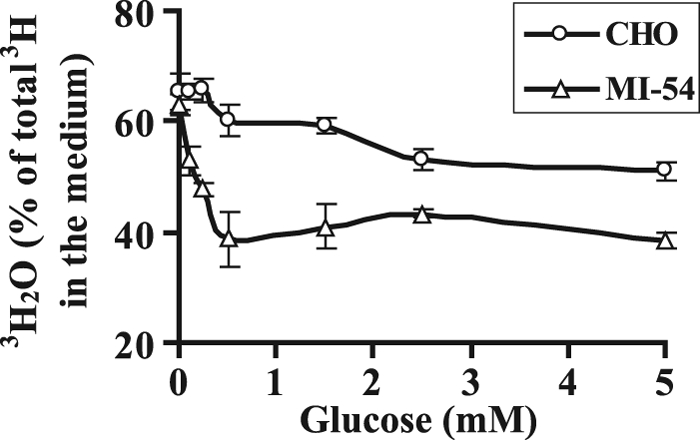
Endogenously generated mannose from glycan processing escapes catabolism due to inaccessibility to hexokinase. CHO cells and HK-deficient CHO and (MI-54) cells were labeled for 1 h. This was followed by chase in fresh DMEM containing the indicated amounts of glucose. 3H2O formation was estimated by counting medium with and without evaporation. The data represent an average of triplicate determinations. Error bars, S.E.
Most of the Mannose in N-Glycans Is Glucose-derived
Because most of the free mannose exiting the cells is contributed by N-glycan processing, we determined the relative contribution of glucose and mannose to N-linked oligosaccharides. Multiple cell lines were dual labeled with [3H]glucose and [14C]mannose at the same specific activity, N-glycans were isolated, and monosaccharide analysis was done as described under “Experimental Procedures.” In most of the cell types, 95% of mannose was derived from glucose, but there were some cells, such as fibroblasts, that derived considerably more mannose in glycoproteins from mannose (Table 3).
TABLE 3.
Glucose-derived mannose in N-glycans
The cells were dual labeled for 1 h with [6-3H]glucose and [14C]mannose in the medium containing 5 mm glucose and 50 μm mannose. Monosaccharides were analyzed by HPAEC-PAD on a CarboPac PA1 column. The contribution to mannose in glycoproteins from glucose and mannose was calculated. HUVEC, human umbilical vein endothelial cells.
| Cell lines tested | Contribution from glucose |
|---|---|
| % | |
| 293 kidney cells | 99 |
| C3a hepatoma cells | 99 |
| Primary hepatocytes | 98 |
| C2C12 muscle cells | 97 |
| SKNSH neuroblastoma | 96 |
| HUVEC | 92 |
| 42F fibroblasts | 90 |
| CRL1947 fibroblasts | 80 |
DISCUSSION
The source of mannose in plasma and its homeostasis remains to be fully elucidated. Glycogen breakdown has been proposed as a possibility, as shown in rats in response to epinephrine administration (19). Glycogen phosphorylase is activated upon induction of ER stress, which could provide glycosylation precursors during stress (20). These processes may account for a portion of mannose under certain metabolic states but do not explain the steady state of mannose in plasma under normal conditions. We propose a mechanism that is applicable under normal conditions to maintain mannose levels in plasma.
Interestingly, more than 95% of mannose entering various cells is catabolized, whereas mannose produced from glycan processing (endogenous mannose pool) is not metabolized but is expelled from the cells, presumably via a transporter. At a physiological concentration of 5 mm, glucose influx substantially competes for phosphorylation by HK and makes the enzyme less accessible to the endogenous pool of mannose. Substrate channeling through enzyme complexes might explain different handling of endogenous mannose from that of incoming mannose. There are many synthetic and degradation processes that occur in the same organelle and require compartmentalization of metabolic networks and pathways (21). There is a partitioning of glycolytic enzymes between cytomatrix-bound and aqueous cytoplasm free forms. High cytomatrix association concentrates the enzymes for most efficient substrate channeling (21). Glycolytic enzymes are bound to the plasma membrane and contractile apparatus of vascular smooth muscle cells and to the actin cytoskeleton, microtubules, and outer mitochondrial membranes of other cell types (22). Their localization depends on the metabolic state. Hardin and Finder (23) demonstrated that none of the glycolytic intermediates except fructose 6-phosphate is free in solution when studied in gently permeabilized vascular smooth muscle cells, implying a highly ordered assembly of the glycolysis machinery in the cytoplasm. The association of glycolytic enzymes with a variety of cytoplasmic structures results in strict channeling of glycolytic intermediates. Preferential substrate entry and exit from such complexes may be necessary for high metabolic efficiency. For example, fructose 6-phosphate lies at the intersection of several metabolic pathways, including glycosylation (Man-6-P, N-acetylglucosamine 6-phosphate), glycolysis (fructose 1,6-diphosphate), hexose monophosphate shunt, and gluconeogenesis (Glc-6-P). Channeling common substrates into different pathways may rely on subtle differences in the organization of multienzyme complexes.
Type III HK has perinuclear localization, whereas Type I and Type II HK have been shown to be associated with mitochondria (24). Such a location gives HK preferential access to ATP too. Under certain conditions, HK is mobilized to actin filaments, and its activity increases (25). In certain cells, hexose transporters are colocalized with HK (26). In pancreatic cells, enzyme to enzyme tunneling of hexose phosphates in the hexokinase/phosphoglucoisomerase/phosphofructokinase sequence has been postulated (27). In hepatoma cells, Glc-6-P generated by glucokinase is in a compartment that is accessible to several enzymes, whereas Glc-6-P produced by HK is directed to a compartment with restricted access (28). We propose similar regulated channeling of incoming mannose, which might explain why this mannose pool has more privileged access to hexokinase compared with endogenous mannose generated from glycan processing/turnover at various locations within the cell at physiological glucose concentration. Consequently, the majority of the endogenous mannose escapes catabolism and is exported from the cell.
Calculations based on our experiments suggest that efflux of endogenous mannose substantially contributes blood mannose levels. All of the cell lines we tested returned the majority of mannose derived from glycan processing directly to the medium. Previous in vivo studies in mice have shown that liver and intestines incorporate a significant amount of [3H]mannose into glycoproteins, whereas muscle and heart incorporate 10–15-fold less radiolabel. Assuming that differentiated cultured muscle cells model the in vivo situation, we calculate that muscle cells release ∼0.73 nmol of mannose/mg/h into the medium under physiological conditions. An average mouse of 30 g has a 12-g muscle weight and 1.32 g of muscle protein (29). Therefore, mannose (derived primarily from glucose in muscle) is released at a rate of 0.96 μmol/h. Mouse plasma contains 100 μm mannose, which turns over at t½ = 28 min (18). Given the plasma and interstitial fluid volumes (7.8 ml), this would utilize ∼0.85 μmol of mannose/h. Under physiological steady state conditions, muscle alone could provide the bulk of plasma mannose. Other cell types are also net producers of plasma mannose, and in each case, the majority is derived from glucose (Table 3).
The phenomenon of mannose efflux might also explain why CDG-I patients have lower blood mannose levels (5–40 μm) as compared with normal individuals (40–80 μm) (30). CDG-I patients have underglycosylated proteins, and if glycoprotein processing is the major source of mannose in the blood, then proteins in the patients would generate less endogenous mannose, resulting in a lower mannose concentration in the blood.
There are several reasons why cells may want to prevent intracellular accumulation of free mannose. Within the ER and Golgi, it could interfere with normal glycosylation processes by competing with glycosidases and proofreading lectins (31). Man-6-P in the cytosol could be detrimental because in vitro studies show that Man-6-P can reduce the amount of LLO available for protein N-glycosylation (32). Mouse embryonic fibroblasts lacking all MPI activity accumulate lethal concentrations of Man-6-P when exposed to exogenous mannose (33). Also, mannose is 5-fold more reactive than glucose in protein glycation (34); therefore, mannose could increase the amount of undesirable intracellular glycated proteins. For mannose released from ER/Golgi/lysosomes to exit, cells would require a transport mechanism from the organelle to cytoplasm and across the plasma membrane. Rapid efflux can only be mediated by transporters and/or vesicles as opposed to simple diffusion. Facilitated diffusion of hexoses through glucose transporters is 50,000 times more rapid than simple diffusion (35).
Mannose is transported by most of the known glucose transporters. Lysosomes have a facilitated hexose transporter (Kt = 75 mm) for neutral monosaccharides, such as d-glucose, d-galactose, d-mannose, and d- and l-fucose (36). An ER-localized bidirectional glucose transporter distinct from plasma membrane GLUTs has been reported in HepG2 hepatoma cells (37). A recent study has described a novel class of transporters, SWEETs, which are distinct from the two already known classes (GLUTs and SGLT) and are present in several different species (38). They mediate glucose efflux. There is one copy of SWEET in humans (hsSWEET), which is ubiquitously expressed in all of the tissues. hsSWEET is mainly present in the Golgi and some at the cell surface (38). Although mannose transport was not specifically checked in mammalian cells, there is a possibility of involvement of this new class of transporter in mannose efflux from Golgi to cytoplasm and subsequently outside the cell. Our results suggest that rapid mannose efflux involves a nocodazole- sensitive transporter either at the ER/Golgi or cell membrane or both. Nocodazole also inhibits [3H]deoxyglucose uptake in intact cells (16). Therefore, the same transporter at the cell surface could be involved in transporting endogenous mannose out of the cell. Facilitated sugar transporter inhibitors to the medium decreased transport of exogenous glucose into the cell and led to catabolism of endogenously generated [3H]mannose, producing more 3H2O, which rapidly equilibrates with the extracellular milieu. This made it more difficult to provide direct evidence of a transporter for mannose efflux through the cell membrane in intact cells because endogenous [3H]mannose is no longer available in its free form.
In summary, we propose a mechanism by which mannose produced by glycan processing exits the cells, presumably by transporters. The extent of mannose flux is sufficient to account for mannose homeostasis in the blood. Maintenance of the blood mannose level is beneficial for CDG-Ib patients who are deficient in MPI. Mannose supplementation increases its concentration in the blood and provides enough substrate to reverse most of their pathological symptoms resulting from insufficient glycosylation.
Acknowledgments
We thank Drs. Geetha Srikrishna, Mariam Rodriguez Lee, and Bobby Ng for comments on the manuscript.
This work was supported, in whole or in part, by National Institutes of Health Grants R01GM55695, R01DK55615, and R21HD062914. This work was also supported by a Sanford Professorship (to H. H. F.) and by the Rocket Williams Fund.
- HK
- hexokinase
- MPI
- mannose phosphate isomerase
- LLO
- lipid-linked oligosaccharide(s)
- Man-6-P
- mannose 6-phosphate
- ER
- endoplasmic reticulum
- HPAEC-PAD
- high pH anion-exchange chromatography with pulsed amperometric detection.
REFERENCES
- 1. Alton G., Hasilik M., Niehues R., Panneerselvam K., Etchison J. R., Fana F., Freeze H. H. (1998) Glycobiology 8, 285–295 [DOI] [PubMed] [Google Scholar]
- 2. Wood F. C., Jr., Cahill G. F., Jr. (1963) J. Clin. Invest. 42, 1300–1312 [DOI] [PMC free article] [PubMed] [Google Scholar]
- 3. Stanley P., Schachter H., Taniguchi N. (2008) in Essentials of Glycobiology (Varki A., Cummings R. D., Esko J. D., Freeze H. H., Stanley P., Bertozzi C. R., Hart G. W., Etzler M. E. eds) pp. 101–127, 2nd Ed., Cold Spring Harbor Laboratory, Cold Spring Harbor, NY: [PubMed] [Google Scholar]
- 4. Freeze H. H., Kranz C. (2010) Current Protocols in Immunology, Chapter 8, pp. 8.15.1–25, John Wiley & Sons, Inc., New York: [DOI] [PubMed] [Google Scholar]
- 5. Panneerselvam K., Freeze H. H. (1996) J. Biol. Chem. 271, 9417–9421 [DOI] [PubMed] [Google Scholar]
- 6. Anumula K. R., Spiro R. G. (1983) J. Biol. Chem. 258, 15274–15282 [PubMed] [Google Scholar]
- 7. Moore S. E., Bauvy C., Codogno P. (1995) EMBO J. 14, 6034–6042 [DOI] [PMC free article] [PubMed] [Google Scholar]
- 8. Suzuki T., Lennarz W. J. (2002) Glycobiology 12, 803–811 [DOI] [PubMed] [Google Scholar]
- 9. Hubbard. S. C., Robbins P. W. (1980) J. Biol. Chem. 255, 11782–11793 [PubMed] [Google Scholar]
- 10. Karaivanova V. K., Spiro R. G. (2000) Glycobiology 10, 727–735 [DOI] [PubMed] [Google Scholar]
- 11. Wood R. E., Wirth F. P., Jr., Morgan H. E. (1968) Biochim. Biophys. Acta. 163, 171–178 [DOI] [PubMed] [Google Scholar]
- 12. Klausner R. D., Donaldson J. G., Lippincott-Schwartz J. (1992) J. Cell Biol. 116, 1071–1080 [DOI] [PMC free article] [PubMed] [Google Scholar]
- 13. Hoebeke J., Van Nijen G., De Brabander M. (1976) Biochem. Biophys. Res. Commun. 69, 319–324 [DOI] [PubMed] [Google Scholar]
- 14. Deery W. J., Weisenberg R. C. (1981) Biochemistry 20, 2316–2324 [DOI] [PubMed] [Google Scholar]
- 15. Dröse S., Bindseil K. U., Bowman E. J., Siebers A., Zeeck A., Altendorf K. (1993) Biochemistry 32, 3902–3906 [DOI] [PubMed] [Google Scholar]
- 16. Molero J. C., Whitehead J. P., Meerloo T., James D. E. (2001) J. Biol. Chem. 276, 43829–43835 [DOI] [PubMed] [Google Scholar]
- 17. Schiff P. B., Fant J., Horwitz S. B. (1979) Nature 277, 665–667 [DOI] [PubMed] [Google Scholar]
- 18. Davis J. A., Freeze H. H. (2001) Biochim. Biophys. Acta 1528, 116–126 [DOI] [PubMed] [Google Scholar]
- 19. Taguchi T., Yamashita E., Mizutani T., Nakajima H., Yabuuchi M., Asano N., Miwa I. (2005) Am. J. Physiol. Endocrinol. Metab. 288, E534–E540 [DOI] [PubMed] [Google Scholar]
- 20. Shang J., Lehrman M. A. (2004) J. Biol. Chem. 279, 12076–12080 [DOI] [PubMed] [Google Scholar]
- 21. Ovádi J., Srere P. A. (2000) Int. Rev. Cytol. 192, 255–280 [DOI] [PubMed] [Google Scholar]
- 22. Mendes P., Kell D. B., Welch G. R. (1995) Adv. Mol. Cell. Biol. 11, 1–19 [Google Scholar]
- 23. Hardin C. D., Finder D. R. (1998) Am. J. Physiol. 274, C88–C96 [DOI] [PubMed] [Google Scholar]
- 24. Lynch R. M., Fogarty K. E., Fay F. S. (1991) J. Cell Biol. 112, 385–395 [DOI] [PMC free article] [PubMed] [Google Scholar]
- 25. Pedley K. C., Jones G. E., Magnani M., Rist R. J., Naftalin R. J. (1993) Biochem. J. 291, 515–522 [DOI] [PMC free article] [PubMed] [Google Scholar]
- 26. Rauch M. C., Ocampo M. E., Bohle J., Amthauer R., Yáñez A. J., Rodríguez-Gil J. E., Slebe J. C., Reyes J. G., Concha I. I. (2006) J. Cell. Physiol. 207, 397–406 [DOI] [PubMed] [Google Scholar]
- 27. Malaisse W. J., Bodur H. (1991) (1991) Int. J. Biochem. 23, 1471–1481 [DOI] [PubMed] [Google Scholar]
- 28. Gomis R. R., Cid E., García-Rocha M., Ferrer J. C., Guinovart J. J. (2002) J. Biol. Chem. 277, 23246–23252 [DOI] [PubMed] [Google Scholar]
- 29. Marieb E., Katja H. (2007). Human Anatomy and Physiology, 7th Ed., p. 317, Pearson Benjamin Cummings, Upper Saddle River, NJ [Google Scholar]
- 30. Panneerselvam K., Etchison J. R., Skovby F., Freeze H. H. (1997) Biochem. Mol. Med. 61, 161–167 [DOI] [PubMed] [Google Scholar]
- 31. Ellgaard L., Helenius A. (2003) Nat. Rev. Mol. Cell Biol. 4, 181–191 [DOI] [PubMed] [Google Scholar]
- 32. Gao N., Shang J., Lehrman M. A. (2005) J. Biol. Chem. 280, 17901–17909 [DOI] [PMC free article] [PubMed] [Google Scholar]
- 33. DeRossi C., Bode L., Eklund E. A., Zhang F., Davis J. A., Westphal V., Wang L., Borowsky A. D., Freeze H. H. (2006) J. Biol. Chem. 281, 5916–5927 [DOI] [PubMed] [Google Scholar]
- 34. Bunn H. F., Higgins P. J. (1981) Science 213, 222–224 [DOI] [PubMed] [Google Scholar]
- 35. Marcolongo P., Fulceri R., Giunti R., Burchell A., Benedetti A. (1996) Biochem. Biophys. Res. Commun. 219, 916–922 [DOI] [PubMed] [Google Scholar]
- 36. Mancini G. M., Beerens C. E., Verheijen F. W. (1990) J. Biol. Chem. 265, 12380–12387 [PubMed] [Google Scholar]
- 37. Fehr M., Takanaga H., Ehrhardt D. W., Frommer W. B. (2005) Mol. Cell. Biol. 25, 11102–11112 [DOI] [PMC free article] [PubMed] [Google Scholar]
- 38. Chen L. Q., Hou B. H., Lalonde S., Takanaga H., Hartung M. L., Qu X. Q., Guo W. J., Kim J. G., Underwood W., Chaudhuri B., Chermak D., Antony G., White F. F., Somerville S. C., Mudgett M. B., Frommer W. B. (2010) Nature 468, 527–532 [DOI] [PMC free article] [PubMed] [Google Scholar]