

Abstract
The mechanism by which HIV-1-Tat protein transduction domain (TatP) enters the cell remains unclear because of an insufficient understanding of the initial kinetics of peptide entry. Here, we report the successful visualization and tracking of TatP molecular kinetics on the cell surface with 7-nm spatial precision using quantum dots. Strong cell binding was only observed with a TatP valence of ≥8, whereas monovalent TatP binding was negligible. The requirement of the cell-surface heparan sulfate (HS) chains of HS proteoglycans (HSPGs) for TatP binding and intracellular transport was demonstrated by the enzymatic removal of HS and simultaneous observation of two individual particles. Multivalent TatP induces HSPG cross-linking, recruiting activated Rac1 to adjacent lipid rafts and thereby enhancing the recruitment of TatP/HSPG to actin-associated microdomains and its internalization by macropinocytosis. These findings clarify the initial binding mechanism of TatP to the cell surface and demonstrate the importance of TatP valence for strong surface binding and signal transduction. Our data also shed light on the ability of TatP to exploit the machinery of living cells, using HSPG signaling to activate Rac1 and alter TatP mobility and internalization. This work should guide the future design of TatP-based peptides as therapeutic nanocarriers with efficient transduction.
Keywords: Heparan Sulfate, Lipid Raft, Membrane Trafficking, Signal Transduction, Single Molecule Biophysics, Quantum Dot, Protein Transduction Domain
Introduction
A small region of HIV-1 Tat (trans-acting activator of transcription), corresponding to residues 47YGRKKRRQRRR57 and the Tat protein transduction domain (TatP),2 is responsible for translocating the protein across the cellular membrane (1–7). Several studies have reported the strong protein transduction property of these short sequences after fusion with various proteins both in vivo and in vitro (4, 6, 8). This property makes them extraordinarily good candidates for the transport of therapeutic bioactive molecules, such as proteins, DNA, RNA, or drugs, into cells. Therefore, understanding the molecular mechanisms of TatP entry and its efficacy is particularly important (3).
The pathway by which these peptides enter cells is the subject of substantial controversy (3). Biological assays have shown that TatP can enter into the cells at a relatively low concentration (∼5 nm) (1, 9). In live cell imaging studies, photobleaching of GFP- and FITC-labeled TatP has been used to explore the mechanisms of TatP entry. The high concentrations (∼10 μm to 100 nm) of TatP used in these experiments could induce the nonspecific entry of TatP into cells, however (5, 10–12). Therefore, it has been difficult to determine specific pathways. Moreover, because of the lack of state-of-the-art techniques for direct visualization, the initial events at the cell surface have only been predicted based on biological activities (e.g. activity of the reporter genes) or the amount of TatP inside the cells after ∼1 h of TatP exposure. For instance, in a recently published paper (13), TatP was shown to enter cells in both pinosomes and macropinosomes after initially binding to an unidentified, non-HSPG protein. Pinocytosis is always occurring at the cell surface, even without stimulation. Increasing the TatP concentration might accelerate this nonspecific entry and prevent the discovery of a truly specific entry pathway (13). Thus, it is rather difficult to determine specific entry pathways using conventional live cell imaging and photobleaching fluorophores. There is still considerable controversy surrounding the validity of the data that have been obtained using such indirect measurements. As a result, phosphate groups of plasma membrane lipids (14–16) or cell-surface receptors, namely CXCR4 (17), integrin family members (18, 19), vascular endothelial growth factor receptor (20), low density lipoprotein receptor-related protein (21), and heparan sulfate (HS) proteoglycans (HSPGs) (10–12), are still considered potential candidates.
To clarify and quantify the mechanisms of TatP entry while overcoming the above-mentioned difficulties, we visualized the initial TatP molecular binding kinetics using a high speed confocal microscope and a high sensitivity camera with 7-nm spatial precision (22, 23). We used TatP labeled with quantum dots (QD), which are bright and resistant to photobleaching (24, 25). We were able to directly visualize and quantitatively analyze the initial molecular dynamics of TatP at the cell surface. Notably, we confirmed that multivalent TatP-induced HSPG cross-linking activates Rac1 for TatP internalization.
EXPERIMENTAL PROCEDURES
Reagents
St-QDs and biotinylated Alexa were purchased from Invitrogen. Unless otherwise mentioned, inhibitors of cellular proteins were acquired from Sigma. The Rac1 inhibitor NSC23766 was purchased from Calbiochem. mAb clone F58-10E4 (IgM class) (26), F69-3G10 (IgG2b class) HS lyase, and Ch-ABC lyase were received from Seikagaku Corp. (Tokyo, Japan). Heparin was purchased from Sigma. We received the vector for glycosylphosphatidylinositol-linked GFP (pGFP-GPI) as a kind gift from Dr. Santos Manes (Centro Nacional de Biotechnologia/CSIC, Madrid, Spain) (27). The pAcGFP1-tubulin vector was purchased from Clontech.
Preparation of TatP-QDs
The 11-amino acid TatP sequence was synthesized by Fmoc (N-(9-fluorenyl)methoxycarbonyl) solid phase synthesis. The N terminus was conjugated with FITC or biotin or left unmodified. The peptides were purified by reverse phase-HPLC to >95% purity on an acetonitrile/H2O/trifluoroacetic acid gradient and confirmed by electrospray ionization mass spectrometry (Toray, Osaka, Japan). The lyophilized peptides were reconstituted in distilled water to 3 mm stock concentrations. For the labeling of TatP with QDs, biotin-TatP was incubated with streptavidin (St)-QD (1 μm) at room temperature for 30 min at a TatP to St-QD molar excess of 1, 2, 4, 6, 8, 10, 12, and 16. To saturate the free Sts on the QDs, TatP-QDs were further incubated with an equal volume of 20 μm biotin at room temperature for 30 min. St-QD605s were used unless otherwise mentioned. The conjugated QDs were diluted in phenol red-free (Ph−) X-VIVO-10 buffer (X-B) (Lonza, Walkersville, MD) for 45 min before the experiments.
Cell Culture and Drug Treatments
The cells were cultured in minimal essential medium (Invitrogen) with 10% FBS (Invitrogen) at 37 °C in 5% CO2. 24 h before the start of the experiment, cells were detached and suspended at 1 × 10⁵ cells/ml by Ph− minimal essential medium with 10% FBS. Subsequently, 100- or 30-μl aliquots were plated onto either 96- or 384-well microwell plates (Nalge Nunc, Naperville, IL), which were coated with 15-fold-diluted Ph− Matrigel Matrix (BD Biosciences) for 1 h and cultured overnight. One h before the microscopy experiments, the culture medium was exchanged for Ph− X-B with 2% FBS. TatP-QD molecular imaging was performed at 37 °C on the microscope. Primary cells were isolated from a healthy donor and cultured as described previously (28).
The partial depletion of cholesterol from the plasma membrane was performed by incubating the cells in 4 mm methyl-β-cyclodextrin (MBC) at 37 °C for 30 min (29). This treatment did not decrease the surface expression of HSPG, which was followed by F58-10E4 with flow cytometry (data not shown). Partial actin depolymerization was performed by incubating the cells in medium containing 50 nm latrunculin-B (LatB) for 10 min at 37 °C (29). Rac1 was inhibited by treating the cells with 100 μm NSC23766 for 30 min at 37 °C. The Na+/H+ exchange and dynamin required for macropinocytosis were inhibited by treating the cells with 1 mm amiloride and 17 μm Dynasore, respectively, for 30 min at 37 °C.
Optical System for Single Molecule Imaging
The optical system that was used to observe the individual particles consisted of an epifluorescence microscope (IX-71, Olympus, Tokyo, Japan) equipped with a Nipkow lens-type confocal unit (CSU10, Yokokawa, Tokyo, Japan) and an electron multiplier type charge-coupled device camera (EM-CCD, Ixon DV887, Andor Technology, Belfast, Northern Ireland), as described previously (22, 30). A ×100 objective lens (UPlanFLN, 1.30 NA, oil, Olympus) was used. A 50 × 50 μm2 area was illuminated with a green laser (532 nm wavelength, 50 milliwatts, CrystaLaser, Reno, NV). The laser-excited fluorescence was filtered with a >580 nm long pass filter to image the QDs. All images were processed with SOLIS software (Andor Technology). The position of a given QD was determined by fitting the image with two-dimensional Gaussian functions (30). As shown in Fig. 1A, immobile 8-val TatP-QDs on HeLa cells were tracked with a time resolution of 23 ms/frame; the standard deviation of the position of the QDs was 6.9 nm in the x axis and 6.5 nm in the y axis, indicating that the spatial precision for detecting TatP-QDs on HeLa cells was ∼7 nm.
FIGURE 1.

Cell-surface binding of monovalent TatP. A, spatial precision of TatP-QDs in HeLa. Immobile TatP-QDs were tracked in HeLa. The S.D. of the position of QDs was 6.9 nm in the x axis and 6.5 nm in the y axis. B, typical time course of monovalent TatP-QD cell binding to HeLa cells pre-exposed to 30 pm of monovalent Tat-QDs, followed by exposure to the indicated concentrations of nonlabeled TatP or medium. Data were collected at 400 ms/frame. Arrow indicates time of TatP addition. C, HeLa were exposed to either FITC-TatP, FITC alone (control) (upper panel), 1- and 4-val TatP-Alexa488, or Alexa488 alone (lower panel) for 15 min and analyzed for their binding capability by FACS. D, schematic figure illustrates the experiments for E–G: monovalent TatP-QD contains free sites for biotin-TatP on the Sts. E and D, typical time course of TatP-QD cell binding (E) and selected frames (F) from HeLa cells pre-exposed to 30 pm monovalent Tat-QDs, followed by exposure to the indicated concentrations of biotin-TatP. Arrows in E and F (right panel) indicate the time of biotin-TatP addition. Bars, 5 μm. F, arrowheads (left panel) indicate filopodia. G, mean QD number/cell calculated from ∼20 cells exposed to biotin-TatP for 15 min. Bars, S.D. Results are representative of three independent experiments.
Dual Imaging for HSPG and TatP
For dual labeling of HSPG and TatP, the cells were detached with 0.25% trypsin/EDTA (Invitrogen), washed thoroughly with Ph− X-B, and cultured for 6 h in 1.5 ml of Eppendorf tubes with X-B containing 2% FBS. Cultured HeLa cells were first incubated with mAb F58-10E4 (1:200) in PBS with 2% FBS (designated as the binding buffer, binding B) followed by a secondary goat anti-mouse IgM tagged with QD705 (1:100, Sigma). QD705-labeled anti-mouse IgM was prepared with a QD705 antibody conjugate kit (Invitrogen), according to the manufacturer's instructions. After labeling, the cells were incubated with 30 pm of 8-val TatP-QD525 for 10 min at room temperature and washed thoroughly with X-B. The cells were suspended at a concentration of 1 × 10⁵ cell/ml in Ph− X-B containing 2% FBS, plated on 96-well glass bottom plates (Nalge Nunc), centrifuged at 4 °C, and then observed under the microscope. QD525 and QD705 were illuminated with a blue laser (488 nm wavelength, 40 milliwatts, Furukawa Electric, Chiba, Japan). The laser-excited fluorescence was split into two paths with a dichroic mirror (transmission/reflection at 570 nm, Olympus, Tokyo, Japan) and filtered with a 500–550-nm bandpass filter for QD525 and a 690–730-nm bandpass filter for QD705 (22, 23, 31, 32). Images were taken at a rate of 200 ms/frame at 37 °C on the microscope.
Measurements of Individual Trajectories and Equations for Single Particle Tracking
The number of TatP-QDs bound to the cell and the dynamics of the QDs were examined by imaging at 400 and 23 ms/frame, respectively. TatP-QD cell-surface binding requires more than 10 min to plateau, so the lower rate of 400 ms/frame was used to avoid collecting unnecessarily large amounts of data (at 23 ms/frame, ∼19 gigabytes would be required to store the >198,000 pictures).
When captured by the EM-CCD camera, the brightness of a single QD particle was characterized by a Gaussian distribution, with a peak at the center and a concentric drop in intensity. This unique property can be used to estimate the physical location of a single QD particle with nanometer accuracy. The positions of individual particles and their trajectories were determined with a single particle tracking plug-in for Image J (View5D, which automatically detects the positions of fluorescence-labeled particles).
To investigate the dynamics of the particle, a mean square displacement (MSD) was calculated from the x-y coordinates of the position of the tracked particle, as described previously (30). The MSD values were defined by Equation 1,
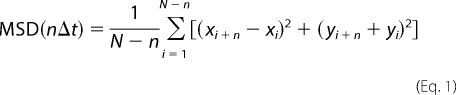 |
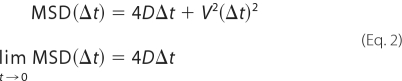
where xi and yi give the position within frame i, and N is the total number of frames. The time between frames is Δt, and nΔt is the time interval over which the MSD is calculated. To calculate the diffusion coefficients (D) and the velocities (V), MSD values were fitted by Equation 2,
 |
Optical System for Differential Interference Contrast (DIC) and Three-dimensional Image Reconstruction
The DIC images and reconstructed three-dimensional images of live cells were collected with a Zeiss LSM 510-meta confocal laser scanning microscope (Carl Zeiss, Jena, Germany) with a Plan-Apochromatic 63 × 1.4 NA oil-immersion DIC objective (Carl Zeiss). Live cells were imaged at 10-s intervals at 37 °C in Ph− X-B. To generate the three-dimensional reconstructions of cells exposed to 8-val TatP-QD for 1 h, overlapping image stacks (10–15 stacks per cell; thickness of each image: 0.45 μm) were recorded with a ×2.0 scan zoom. The DIC and three-dimensional reconstructions were imaged with the Zeiss LSM Image Browser version 32.
Analysis of TatP Binding by FACS
To examine the ability of TatP-QD655 of varying valences to bind the cell surface, detached HeLa cells were cultured in 1.5-ml Eppendorf tubes with X-B for 6 h and exposed to 5 nm of TatP-QD of various valences for 15 min, washed three times with ice-cold binding B, and kept on ice until analysis with a FACSCalibur flow cytometer (BD Biosciences).
Activated Rac1-Pulldown Assay
HeLa cells were serum-starved for 24 h prior to the experiment and exposed to 30 pm of either 2- or 8-val-TatP. At the first indicated time point, the exposed cells were washed once with ice-cold PBS and lysed. The lysates (500 μg each) were subjected to a Rac1-GTP pulldown assay with GST-human Pak1-protein binding domain, using the active Rac1 pulldown and detection kit (Thermo Scientific, Rockford, IL) and the manufacturer's instructions. Samples were loaded and blotted with anti-Rac1 mAb (1:3000) and an HRP-labeled anti-mouse IgG (1:3000). Signal was visualized with SuperSignal West Pico chemiluminescent substrate (Thermo Scientific).
Enzymatic Treatment, HSPG Expression, and 8-val TatP Binding
To examine the cell-surface expression of HSPG, cells were detached and cultured in 1.5-ml Eppendorf tubes with X-B containing 2% FBS at least 6 h prior to experiments. Cells were stained with either anti-HSPG mAb (1:100) or an isotype-matched mAb followed by a FITC-conjugated secondary Abs (1:500) (Sigma). For experiments involving the enzymatic removal of the HS chains from cell-surface HSPGs by either HS lyase or Ch-ABC lyase, the cells were incubated for 2 h at 37 °C with HS lyase (20 milliunits) or Ch-ABC lyase (0.5 unit) in HS lyase buffer (20 mm Tris, pH 7.4, 0.01% BSA, and 4 mm CaCl2) or Ch-ABC lyase buffer (3.3 mm Tris, pH 8.0, 0.01% BSA, 3.3 mm sodium acetate), respectively, and stained as described above. Aliquots of the enzyme-treated cells were plated and attached to 96-well glass bottom plates by centrifugation at 4 °C. The level of binding of 30 pm of 8-val TatP-QD to the HeLa cells was examined by single molecule microscopy as described above, with an acquisition rate of 200 ms/frame.
To study the effect of trypsin, cells treated with 0.25% trypsin/EDTA for 8 min were cultured in 1.5-ml Eppendorf tubes with X-B with 2% FBS. Trypsin/EDTA-treated cells were collected at the time indicated and examined for HSPG expression or 10 nm 8-val TatP-QD binding by FACS or 30 pm of 8-val TatP-QD binding by single molecule microscopy as described above.
RESULTS
Monovalent TatP Does Not Efficiently Bind to the Cell Surface
To visualize the interactions between TatP and the cell surface, we used St-QDs coupled with biotin-TatP at a TatP/QD molar ratio of 1:1. Unless otherwise stated, all experiments were conducted with the HeLa cell line. We cultured the HeLa cells on glass-bottom plates, exposed them to either 30 or 250 pm of TatP-QDs for 30 s, and observed them under a Nipkow-type confocal microscope at a time resolution of 400 ms/frame. TatP-QD molecules that are not bound to the surface move very rapidly due to Brownian motion, and at this rate of acquisition, these particles cannot be localized in discrete spots. Only QDs that are bound to the membrane can be recognized as fluorescent spots. As shown in Fig. 1B, TatP-QDs surprisingly did not bind to the cell surface (∼100 cells examined) even after exposing the cells for about 15 min to 30 or 250 pm (data not shown) of QDs (the methods that were used to measure the QD numbers are described in the supplemental “Experimental Procedures”). This result suggests that monovalent TatP-QDs do not bind to the surface of HeLa cells at concentrations of 30 and 250 pm.
The entry of TatP occurs in living cells at a concentration of ∼10 μm (5, 10–12). We speculated that increasing the TatP concentration in the medium could enhance their ability to bind the cells. Using high concentrations of QDs would lead to very high background fluorescence, however. Thus, we first exposed the cells to 30 pm TatP-QDs for ∼3 min and then added unlabeled TatP at different concentrations in the medium. As shown in Fig. 1B, the addition of unlabeled TatP to the medium at concentrations up to 50 μm does not significantly enhance the ability of TatP-QDs to bind the cell surface. Similarly, when FITC-labeled TatP was used to test surface binding, very little binding was observed after 15 min of exposure, as detected by FACS (Fig. 1C, upper panel). These results further confirm that monovalent TatP has little to no capacity to bind to the surface of HeLa cells. Because each St-QD typically contains ∼7 streptavidin molecules, ∼30 biotin-TatP molecules can bind to each St-QD. We studied the effect of adding biotin-TatP to the medium. We expected that the extra biotin-TatP would bind to the free streptavidin sites on the TatP-QDs (Fig. 1D). The cells were precultured with 30 pm monovalent TatP-QDs without added biotin (see “Experimental Procedures”), and different concentrations of biotin-TatP were then added to the medium. We found that the binding of TatP-QD to the cell surface, including filopodia, continually increased until a plateau was reached after ∼5 min of biotin-TatP exposure (Fig. 1, E and F). The numbers of TatP-QD bound to the cell surface increased with increasing concentrations of biotin-TatP in the medium up to 5 μm (Fig. 1, E and G). These results suggest that the number of TatPs on the QDs could determine the capacity for cell-surface binding and that the TatPs in the medium interact with one another very little, if at all.
Multivalency of TatP Is Essential for Efficient Cell-surface Binding
To test whether the increase in TatP peptides per QD enhances cellular binding, we examined the cell surface association of QDs with different valences of TatP. One of the limitations of single molecule microscopy is that only a limited number of cells can be examined at once. Therefore, in addition to single molecule microscopy, we also employed FACS to analyze a larger population. We designate St-QD incubated with molar ratios of TatP/QDs of 1, 2–4, 6, 8, 10, 12, and 16 as 1-, 2-, 3-, 4-, 6-, 8-, 10-, 12-, and 16-valent (val) TatP-QD, respectively. Cells were incubated with these different valences of 30 pm TatP-QDs for 15 min and then placed on ice. The amount of TatP-QDs bound to the cellular surface was analyzed by FACS. As shown in Fig. 2 (A and B), the binding of TatP was found to increase as the valency increased from 4 to 8. The binding of ≥8-val TatP-QD was 15-fold higher than that of 4-val TatP-QD (Fig. 2F). At concentrations above 8-val, the binding did not further increase, as shown by both the relative mean fluorescence intensities (MFI) and the percentages of gated cells (data not shown). We studied the kinetics of 1-, 2-, 4-, 6-, 8-, 10-, 12-, and 16-val TatP and found that the cell-surface binding of 30 pm 8-val TatP-QDs was more rapid than that of 30 pm 4-val TatP-QDs (Fig. 2, C–E, and supplemental Video 1). The binding velocities of 2-, 4-, 6-, 12-, and 16-val TatP relative to that of 8-val TatP (as calculated from Fig. 1) were 10.1, 14.6, 35.1, 70.2, and 68.6%, respectively (Fig. 2F). We confirmed these results by testing the binding of different TatP valences, namely mono-, 2-, and 4-val TatP, labeled with St-Alexa488 (Fig. 1C, lower panel). The 4-val but not monovalent TatP showed a significant amount of binding after 15 min of exposure, as detected by FACS (2.6 and 60.0% of cells bound mono- and 4-val-TatP+, respectively). In addition, we found that 8-val TatP-QDs bound well to primary CD4+T cells, macrophages, and B cells isolated from the peripheral blood cells of healthy donors (supplemental Fig. S1), suggesting that this phenomenon extends beyond HeLa cells.
FIGURE 2.

Cell-surface binding of multivalent TatP. A and B, analysis of cell-bound TatP of different valences in HeLa by FACS (A) and calculated relative MFI (B). Cells were exposed to TatP-QDs of the indicated valence or QDs alone (cont) for 15 min; binding levels were analyzed by FACS. C and D, typical time course of cell binding for TatP-QD of different valences to HeLa cells (C); images at 15 min of TatP exposure (E), and selected images of the first 5 s of 8-Val TatP cell exposure (D). The cells were exposed to TatP-QDs of the indicated valence or medium, and images were collected at 400 ms/frame. Lines, trajectories of the QDs. (See also supplemental Video 1.) F, binding velocities calculated from time course experiments in C. Results are representative of five independent experiments.
Collectively, these results demonstrate that increasing the TatP valency on the QDs enhances cellular binding; we found that at least bivalent TatP-QD is required to support TatP-QD cell-surface binding on living cells, and a valence ≥8 is required for rapid and efficient cell-surface binding of TatP.
Multivalent TatP Remains on the Surface for About 20 min Before Internalization
We next examined whether the lower concentrations of cell surface-bound 8-val TatP-QD could translocate into the cells. We examined cultured HeLa cells exposed to 3 or 30 pm of 8-val TatP-QD for a 24-h period, obtaining confocal images at 30 and 40 min and 1, 2, and 24 h (supplemental Fig. S2A). We found that when the cells were exposed to 3 or 30 pm of 8-val TatP-QD, the number of QD particles attached to the cells was limited to either ∼30 or ∼400 of 8-val QD particles/cell 10 min after the addition of TatP. As reported previously (33), we found that TatP-QDs started to appear inside the cells at 30 min; by 24 h essentially all of the TatP-QDs had accumulated in the perinuclear region. This region contains the microtubule organizing center, indicated by the co-localization of QDs with GFP-tubulin (data not shown). These results are consistent with the finding that the translocation of TatP that is mediated by either pinocytosis or endocytosis results in the formation of aggregates at the perinuclear region (33). Moreover, at 2 h after exposure, almost equal numbers of cell-bound TatP were internalized in the experiments containing 3 or 30 pm of 8-val TatP-QD (data not shown and Fig. 4C), indicating that ∼250 bound TatPs are sufficient to induce the internalization of cell-bound QDs. Collectively, these results indicate that, after exposure to 3 or 30 pm of 8-val TatP-QD, TatP-QDs are successfully internalized into the cells.
FIGURE 4.

Activation of Rac1 by 8-val-TatP exposure linked to membrane ruffling and TatP internalization by macropinocytosis. A, levels of activated Rac1 after 8-val or 2-val TatP-QD exposure. HeLa cells, 24-h serum-starved, were exposed to 30 pm 8-val or 2-val TatP-QDs for the indicated times and lysed. Lysates were harvested, and Pak1 pulldown was performed. Samples from pulldowns were loaded and blotted with anti-Rac1. The numbers indicate the level of Rac1 activation. B, DIC images of HeLa cells at 15 min after 8-val TatP in the presence and absence of 100 μm Rac1 inhibitor, NCS23766 (upper panel). Higher magnitude images in upper panel squares are shown in lower panels. HeLa cells, 24-h serum-starved, were cultured with/without 100 μm Rac1 inhibitor (RacI) and exposed to 100 pm 8-val-TatP-QDs, and DIC images were collected every 10 s. A 2-val TatP QD stimulation is shown as a control. Arrowheads indicate prominent membrane ruffling. Bar, 20 μm. (See also supplemental Videos 6 and 7.) C, three-dimensional reconstructed images of a HeLa cell exposed to 100 pm 8-val TatP for 1 h. Arrowheads indicate TatP containing macropinosomes. Bar, 10 μm. D, effects of 50 nm cytochalasin D (CyD), 4 mm MBC, 1 mm amiloride (AMI), 100 μm Rac1 inhibitor (RacI), and 17 μm Dynasore (Dyn). Cells were exposed to the indicated drugs and exposed to 100 pm 8-val TatP for 1.5 h; images were collected by LSM510 confocal microscope at ∼2 μm above the glass surface, which can identify cytoplasm. Uptake levels were calculated based on 20 observed cells. Bars, S.D. Results in B–D are representative of five independent experiments.
We also measured how long the 8-val TatP-QDs remain on the cell surface before being internalized. To determine whether the cell surface-bound 8-val TatP-QDs were internalized after ∼20 min of exposure, we examined the accessibility of the bound 8-val TatP-QDs to the external medium using two strategies. The first strategy was based on the finding that the TatP cell is mediated by electrostatic interactions and that membrane-bound TatP is easily removed by exposing the cells to an acidic buffer. We found that washing with 10 mm HCl in 150 mm NaCl caused immediate release of the QDs from the cell surface (supplemental Fig. S3A). With the second technique, we were able to avoid exposing the cells to the extremely low pH by exploiting the ability of QDs to serve as donors for fluorescence resonance energy transfer (FRET) (see supplemental “Experimental Procedures”). We used the cell-bound TatP-QD525 as a donor and a membrane-impermeable, biotinylated Alexa546 fluorophore as an acceptor (34). Because 8-val TatP-QD retains free biotin-binding sites, the addition of a membrane-impermeable, biotinylated fluorophore with an absorption peak corresponding to the QD emission band should result in FRET quenching only in those QDs that are accessible to the extracellular buffer and not yet internalized (supplemental Fig. S3B). As expected, the addition of the potential acceptor to the medium led to an immediate (within 1 s) and substantial (50–60%) quenching of QD525 on the cells after ∼20 min of TatP exposure (supplemental Fig. S3, C and D). The amount of observed quenching was consistent with control experiments in which the acceptor was added to QD525 fixed to a glass slide. Collectively, these results indicate that most of the cell-bound 8-val TatP-QDs remains on the cell surface for at least ∼20 min before internalization.
Signaling from Multivalent TatP Facilitates the Frequent and Constitutive Recruitment of TatP Receptor (TatR) to Actin-associated Membrane Lipid Rafts
Calorimetric analyses have revealed that TatP has a binding affinity for HS and induces the cross-linking and/or aggregation of HS-TatP complexes in the liquid medium (35). Thus, it is reasonable to hypothesize that multivalent TatP induces the cross-linking of HSPGs on the cell surface immediately after binding. To characterize the molecular behavior of TatP/TatR in the absence of cross-linking, we observed the movement of individual 2-val TatPs, which cannot induce the cross-linking of receptors, after 2, 5, and 15 min of exposure. To compare 2-val with 8-val TatP, we modified the concentration of 2-val TatP-QDs (300 pm) in the medium so that the number of attached QD particles (∼400/cell) at ∼15 min of exposure would equal that of the cells exposed to 30 pm 8-val TatP. We observed the movement of TatP-QDs on the cell surface at 23 ms/frame. The spatial precision at this time resolution is ∼7 nm. As shown in Fig. 3A, 2-val TatP was found to exhibit apparently simple diffusion at 2 min after exposure; the mean diffusion coefficient (mD) in the 230-ms window, calculated from the constructed trajectories of single particles found in the images, was found to be 0.3 ± 0.06 μm2/s (mean ± S.E.; n = 39). For comparison, we also examined the mobility of CD4, a monomeric transmembrane protein, using CD4-expressing HeLa cells and QD705-labeled anti-CD4 Ab. CD4 exhibited almost identical behavior to that of 2-val TatP, mD = 0.26 ± 0.07 (n = 39). The trajectory (Fig. 3A), proportion of mobility (Fig. 3B), and mD (Fig. 3C) values for 2-val TatP did not significantly change until 15 min (mD = 0.28 ± 0.05 and 0.33 ± 0.04 after 5 and 15 min, respectively). We fit the intensity distributions of the visualized spots to multiple Gaussian curves and compared them with the distributions of a single QD. In so doing, we found that cell-bound 2-val TatP consists of single QD molecules after an exposure of 2 and 15 min (Fig. 3D, upper panels). Plasma membrane proteins are organized into microdomains that are compartmentalized by the membrane-bound actin cytoskeleton, as well as the hydrodynamic slowing effects of transmembrane-protein pickets that are anchored on the membrane-skeleton fence (29, 36, 37). Thus, both the trajectory and the mD are sensitive parameters for detecting complex formation between proteins and the membrane skeleton. The behavior of 2-val TatP suggests that TatR initially exists as a monomer; the cell surface mobility of 2-val Tat does not significantly change over time.
FIGURE 3.

Multivalent TatP induces a slowing of diffusion by frequent recruitment of TatR to actin-associated membrane lipid rafts. A, typical trajectories of 2- or 8-val TatP after 2 and 15 min of exposure, recorded at 23 ms/frame. (See supplemental Videos 2 and 3.) B, histograms of 2- and 8-val-TatP velocities (calculated from 1150-ms time window) in the presence or absence of 100 μm Rac1 inhibitor after 5 min (left) and 15 min (right) of exposure. C, mean diffusion coefficient of 2- or 8-val TatP, over time up to 15 min, averaged for all particles in time window 1150 ms. Mean diffusion coefficient of 8-val TatP on cells, when unbound QDs were washed out after 2 min of exposure (8-val washed out). Bars, S.E. D, intensity histogram of TatP-QDs at the indicated time and condition, fitted to four gaussian curves. The mean of the first peak is equal to TatP-QD (left upper panel), defined as q1. E, mean diffusion coefficient of 8-val TatP in the presence and absence of 50 nm LatB, 100 μm Rac1 inhibitor (RacI), and 4 mm MBC. Bars, S.E. F, selected frames (left) and trajectories of 8-val TatP-QDs from 23 ms/frame after a 15-min exposure. Arrowhead color corresponds to that of its trajectory. (See supplemental Video 4.) G, often 8-val TatP exhibited alternating periods of apparently simple Brownian diffusion (black) and temporary immobilization (red) for 500 frames (left). Changes in velocity of the trajectories over time are also shown (right). The numbers of temporal immobilizations of the trajectories correspond with the graph. (See also supplemental Video 5.) *, p < 1 × 10⁻⁵; **, p < 1 × 10⁻⁷; ***, p < 1 × 10⁻¹⁵ as calculated by Student's t test.
We then observed the movement of each individual 8-val TatP to explore the effect of multiple TatPs on the induction of HSPG-cross-linking. The trajectory (Fig. 3A), the proportion of mobility (Fig. 3B), and the mD (Fig. 3C) of 8-val TatP particles were almost identical to those of 2-val TatP particles until 5 min. Thereafter, these parameters were found to drop substantially over time until 15 min (mD = 0.31 ± 0.04 (n = 39), 0.23 ± 0.06 (n = 56), 0.17 ± 0.02 (n = 99) after 2, 5, 15 min, respectively) (Fig. 3, A and C, and supplemental Videos 2 and 3). In the presence of TatP, de novo binding to the cell surface continues throughout the observation; thus, the mD calculated under these conditions could be influenced by the mobility of recently cell-bound TatP. Thus, after exposing the cells to 8-val TatP for 2 min, the cells were washed to remove TatP from the medium. We found that by reducing the mD of 8-val TatP with the wash step, the mobility becomes more prominent (mD = 0.15 ± 0.03 versus 0.23 ± 0.06 and 0.17 ± 0.02 versus 0.12 ± 0.03 after 5 and 15 min, respectively) (Fig. 3E). The intensity distributions of the cell-bound 8-val TatP particles were found to gradually increase, suggesting that they consisted of more than two QDs (see Fig. 3D, lower left and middle panels). We describe these spots in the rest of this paper as spots>2 QDs. We found that after partial actin depolymerization (by LatB) or partial cholesterol depletion (by MBC), diffusion of the 8-val TatP slows (0.172 ± 0.02 (n = 100), 0.347 ± 0.05 (n = 104), and 0.329 ± 0.02 (n = 18) in untreated, LatB, and MBC, respectively) (Fig. 3E), and the spots>2 QDs almost disappeared (data not shown). Thus, our results indicate that the slowing of 8-val TatP movement might be caused by the binding of TatP/TatR clusters to actin filaments and/or membrane-associated microdomains, as this rate decrease is affected by partial actin depolymerization. One might expect that the disruption of the membrane rafts and actin cytoskeleton might actually increase the freedom of TatP or the mobility of TatR across the cell membrane, thereby increasing the probability of aggregation between different TatP-QD-TatR complexes on the cell surface. We found, however, that the number of spots>2 QDs does not increase with LatB treatment, suggesting that the TatP-QD-TatR complexes do not easily aggregate with other complexes in the absence of polymerized actin. The reduction in the movement of the 8-val TatP particles and the increase in the number of spots>2 QDs were also linked to cholesterol-rich domains in the membrane, known as lipid rafts or cholesterol-enriched membrane microdomains. Indeed, with HeLa cells expressing GFP-GPI, we found that 8-val TatP-QD co-localizes with GFP-GPI after ∼20 min of exposure; FITC-GPI is used as a marker for membrane lipid rafts (supplemental Fig. S4). When we observed the spots>2 QDs after 15 min of exposure, we found that they exhibit continuous association and dissociation mobility in a confined area (Fig. 3F and supplemental Video 4). Similarly, after 15 min of exposure, we noticed that only 8-val TatP particles often exhibit temporary immobilization in its trajectories (Fig. 3G and supplemental Video 5). These temporary pauses persisted for nearly half of the total observation time (67 of 138 s). The temporarily immobilized spots usually have velocities ≤5 μm/s (Fig. 3G, right panel), and the number of these spots is significantly higher in cells exposed to 8-val TatP than in those exposed to 2-val TatP after 15 min (34.2 versus 64.1% on cells exposed to 2-val and 8-val TatP, respectively). These temporary immobilization events were also inhibited by both partial depolymerization of the actin filaments and partial cholesterol depletion (data not shown). Notably, the reduced mobility and the temporary immobilization events of 8-val TatP are not directly linked to the internalization of TatP, as 8-val TatP remains on the cell surface for 15 min (supplemental Fig. S3). Moreover, those pauses are always temporary. Collectively, these results suggest that the cross-linked TatP on the higher valency QDs facilitate the frequent and constitutive recruitment of TatP/TatR to actin-associated membrane lipid raft microdomains through an unknown signal.
Multivalent TatP Activates Rac1 to Slow Molecular Movement and Induce Internalization through Macropinocytosis
Full-length Tat protein exposure activates Rac1, a GTP-binding protein that regulates membrane actin polymerization (19). Activated Rac1 also regulates membrane ruffling and macropinocytosis by reorganizing actin in growth factor-stimulated cells (34, 38, 39). Activated Rac1 was shown to be preferentially recruited to lipid rafts, triggering downstream signaling cascades (40, 41). We hypothesized that multivalent TatP induces the cross-linking of TatR, which causes the rearrangement of Rac1 adjacent to the lipid rafts and the membrane actin near the raft domains. In turn, TatR movement would be reduced, and TatP/TatR particles would be internalized by macropinocytosis. We first tested whether Rac1 was activated by TatP exposure with a pulldown assay that detects active GTP-bound Rac1 using the Rac1-GTP-binding domain of Pak1 (Fig. 4A) (40). We measured the amplitude and the time course of Rac1 activation in the cells exposed to 2-val and 8-val TatP and found that 8-val TatP-QDs activate Rac1 within 7 min of exposure, continuing until 15 min of exposure. In contrast, the induction of Rac1 activation was marginal in cells exposed to 2-val TatP. We also studied the mobility of individual 8-val QDs in cells pre-exposed to NCS23766, a Rac1 inhibitor. We found that reductions of mD (0.34 ± 0.05 (n = 18), 0.38 ± 0.04 (n = 35), and 0.33 ± 0.04 (n = 100) at 2, 5, and 15 min, respectively) and the induction of temporary immobilization events (the number of spots with a velocity <5 μm/s in Fig. 3B is 36.2%) were suppressed by NCS23766. The gradual increase in the number of the spots>2 QDs over time was also found to be significantly suppressed by this inhibitor. Rac1 was found to cluster with TatP-coated beads and not uncoated beads (supplemental Fig. S5), confirming the effect of TatP on Rac1 targeting to the membrane. These findings suggest that the TatP-induced cross-linking of TatR activates Rac1 and that activated Rac1 is recruited to lipid raft domains (see supplemental Figs. S4 and S5). These events result in membrane actin reorganization, which ultimately slows and confines the cell-surface mobility of TatP/TatR. We then examined whether Rac1 activation by multivalent TatP is linked to the internalization of TatP/TatR. Rac1 activation correlates with membrane ruffling (29, 42). Thus, we first characterized the changes in cell shape in cells exposed to TatP using DIC images acquired at 1-min intervals for about 15 min. As shown in Fig. 4B, membrane ruffling was greatly enhanced in response to 8-val TatP exposure (see also supplemental Video 6). Moreover, three-dimensionally reconstructed images of the cells after ∼1 h of 8-val TatP exposure revealed that the number of TatP-QD-containing vesicles had increased (Fig. 4C). These vesicles contain extracellular fluid, as determined by dye uptake in cells pulsed with Alexa488-dextran (supplemental Fig. S6). We examined the effect of the various inhibitors on 100 pm of 8-val TatP-QD internalization by focusing inside the cells at ∼2 μm above the glass surface (the level at which transfected intracellular GFP can be easily visualized) (supplemental Fig. S2B). We found that the internalization of 8-val TatP is suppressed by inhibiting actin polymerization (cytochalasin D) and Na+/H+ exchange required for macropinocytosis (amiloride) and by changing cholesterol levels with MBC, as reported previously (9, 43). The inhibitor for dynamin (Dynasore), a GTPase responsible for most of the endocytotic pathways (44), had no effect (Fig. 4D). From these data, we can confidently assume that the exposure of cells to 8-val TatP induces the internalization of TatP through macropinocytosis. We next studied the effects of the Rac1 inhibitor. When cells were pre-exposed to NCS23766, both the enhancement of membrane ruffling (Fig. 4B and supplemental Video 7) and the induction of macropinocytosis were substantially suppressed (Fig. 4D). In addition, 2-val TatP did not induce membrane ruffling or macropinocytosis. In summary, multivalent (≥8 val) TatP induces the activation of Rac1, which leads to membrane actin reorganization and the reduction of TatP/TatR mobility. TatP recruits the activated Rac1 adjacent to cholesterol-rich domains and facilitates the internalization of TatP by macropinocytosis.
HSPGs Are Essential Receptors for TatP Cell-surface Binding
Several studies have shown that cell-surface HSPGs are involved in Tat transduction into cells (10–12). It is not clear, however, whether HSPGs are directly involved in the initial steps of Tat cell-surface binding. HSPG is composed of a core protein and ≥3 linear HS-glycosaminoglycan (GAG) polysaccharide chains (45). We first studied the effect of heparin (a highly sulfated GAG) on the cellular binding of TatP. HeLa cells were cultured in the presence or absence of 10 units of heparin, exposed to 30 pm of 8-val Tat, and observed by single molecule microscopy. As shown in Fig. 5A, the cell-surface binding of 8-val TatP was totally abrogated after the addition of heparin.
FIGURE 5.

HSPGs are essential for initial TatP cell-surface binding. A, typical time course of monovalent TatP-QD cell binding to HeLa cells treated with 20 milliunits of HS lyase or 0.5 units of Ch-ABC lyase or cultured with 10 units of heparin. Images were collected at 400 ms/frame. B, binding of a mAb specific for intact HSPGs (F58-10E4) or for an epitope generated by the cleavage of HSPGs with HS lyase (F69-3G10). Cells were treated with 20 milliunits of HS lyase (middle right panel), 0.5 units of Ch-ABC lyase (middle left panel), or 0.5% trypsin/EDTA (right panel); nontreated cells (left panels) were stained with the indicated Abs and analyzed by FACS. Dark lines represent anti-HSPG Abs; light lines represent isotype-control. C, turnover of HSPG (F58-10E4) in cells treated with 0.5% trypsin/EDTA by FACS. D, recovery of the cell-surface binding capability of 8-val TatP-QDs in cells treated with 0.5% trypsin/EDTA. Data were calculated from the MFI values by FACS. E, recovery of the cell-surface binding capability of 8-val TatP calculated from single particle images of 8-val-TatP binding in cells treated with 0.5% trypsin/EDTA. The relative binding capability of 8-val TatP over time was calculated from the mean numbers of TatPs/cell based on 20 observed cells (upper graph) and selected images (lower panels). Bars, S.D. Results are representative of three independent experiments.
To clarify the involvement of HSPGs in the cell-surface binding of TatP, we examined the effect of removing cell-surface GAGs with specific enzymes. We used HS lyase, which cleaves GAG from HSPG, as well as chondroitinase (Ch)-ABC lyase, which cleaves the chondroitin sulfate chain from chondroitin sulfate proteoglycans. As expected, the binding of mAb F58-10E4, which specifically recognizes a GAG epitope of native HSPG, was reduced almost to background levels when HeLa cells were treated with 10 milliunits of HS lyase (Fig. 5B, upper panels). Conversely, F69-3G10, an HSPG epitope that is revealed after HS lyase treatment, did not bind to the untreated HeLa cells but bound to HS lyase-treated cells (Fig. 5B, lower panels). We examined the binding of 30 pm 8-val TatP to the enzyme-treated cell surface by single molecule microscopy. We found that the treatment with HS lyase, but not Ch-ABC lyase, totally abrogates 8-val TatP cell-surface binding to HeLa cells (Fig. 5A). This result suggests that the GAGs of HSPGs serve as the initial receptors for TatP on the cell surface.
We then examined the effect of trypsin, a serine protease that digests cell-surface proteoglycans (46). When cells were treated with 0.25% trypsin/EDTA, the binding of F58-10E4 was reduced almost to background levels, and F69-3G10 did not bind (Fig. 5B). This result suggests that HSPGs on the surface are depleted by trypsin. We observed rapid turnover of HSPGs after trypsin treatment, with the MFI levels of F58-10E4 returning to 47.8 and 98.5% of the normal levels after 3 h and 6 h, respectively (Fig. 5C). Accordingly, when trypsin-treated cells were exposed to 8-val TatP, the cellular binding of TatP was initially totally abrogated (Fig. 5, D and E), but binding was restored to ∼50 and ∼90% of normal levels within 3 h and 6 h, respectively. These results clearly demonstrate that the GAG chains of HSPGs, which are expressed on the cellular surface, serve as the initial cell-surface receptors for TatP.
TatP-HSPGs Co-mobilize in Living Cells
To confirm the role of HSPGs as receptors for TatP, we simultaneously observed two single particles of TatP and HSPGs in living cells using single molecule microscopy with the dual imaging techniques that have been previously developed and reported (22, 23, 30). To observe the movement of HSPGs and TatP, HeLa cells were first incubated with mAb F58-10E4 followed by QD705-labeled secondary Ab at 4 °C. The cells were subsequently incubated with 30 pm 8-val TatP-QD525 for 10 min, plated onto glass-bottom plates, centrifuged at 4 °C, and visualized at a time resolution of 200 ms/frame. As shown in Fig. 6 (A and B) (see also supplemental Video 8), after exposure for >30 s, 17.8% (n = 124) of the total TatP co-mobilized with HSPGs at the cellular surface at 20 min. We also observed that TatP-HSPGs were co-mobilized inside the cells within 45 min of 8-val TatP exposure (Fig. 6C). The percentage of TatP co-mobilized with HSPG appears to be much lower, but note that we had to use a much lower concentration of F58-10E4 to overcome the antibody occupancy of the binding domain of TatP (47). Hence, the number of F58-10E4-QD spots was lower than that of TatP. Combined with the result that the enzymatic removal of HSPGs totally abrogates TatP cell-surface binding, the dual imaging of these two single particles confirms that cell-surface HSPGs serve as the initial TatP receptors and that the TatP-HSPGs complex transports TatP inside HeLa cells.
FIGURE 6.

Co-mobilization and co-internalization of TatP and HSPG. A, bright field image (upper panel) and fluorescence images in the red square were obtained using dual imaging system (lower panel) at 200 ms/frame. Fluorescence images of TatP-QD525 (lower left panel) and HSPG as detected by F58-10E4 plus secondary Ab labeled with QD705 (lower right panel) at 20 min of TatP exposure. Arrowheads indicate co-localization spots of TatP and HSPG. Bars, 5 μm. B, time course fluorescence images of TatP and HSPG of the red arrow in A. (See also supplemental Video 8.) C, bright field image (upper) and selected frames of merged fluorescence images of TatP (green) and HSPG (red) at 45 min of TatP exposure. Arrowheads indicate co-localization of TatP and HSPG. Images are contrast-enhanced. Bar, 1 μm.
Level of TatP Bound to the Surface Does Not Correlate with the Level of F58-10E4 Antigen Expressed in a Variety of Cell Types
We next examined whether a similar phenomenon occurs in the HOS and HepG2 cell lines. We studied the correlation between TatP binding and the expression of HSPG in these cell lines (Fig. 7A). We found that the MFIs of F58-10E4 mAb in HeLa, HepG2, and HOS were 235, 397, and 257, respectively. In contrast, the levels of 8-val TatP-QDs bound on the cellular surface, as detected with MFI in HeLa, HepG2, and HOS, were 64.1, 14.4, and 90.3, respectively (Fig. 7B). Moreover, the numbers of 8-val TatP-QDs, calculated by observing a mean of 10 cells each with single molecule microscopy in HeLa, HepG2, and HOS, were 74.6 ± 12.8, 17.2 ± 3.0, and 107 ± 23.6, respectively (Fig. 7C). These data are consistent with the above-mentioned FACS results; however, when we treated those cells with HS lyase, the MFIs of 8-val TatP-QDs on HeLa, HOS, and HepG2 were completely reduced to background levels (data not shown).
FIGURE 7.

Levels of HSPG expression and TatP-binding capability in various cell lines. A, HSPG (as detected by F58-10E4) expression in HeLa, HepG2, and HOS by FACS. B, levels of 8-val TatP-QDs bound in HeLa, HepG2, and HOS as examined by FACS. C, relative mean number of 8-val TatPs/cell on different cells at 15 min of TatP exposure as observed by single molecule microscopy. Data are based on 20 observed cells. Bars, S.D.
DISCUSSION
We obtained a surprising result that strong cell binding can only be achieved with a TatP valence of ≥8 (Fig. 2), and monovalent TatP has a negligible binding capacity (Fig. 1). Although it has been proposed that electrostatic interactions mediate TatP cell binding (9, 14–16), the electric charge of St-QD cannot account for the negligible binding capacity of monovalent TatP-QD. The net charge Zp is approximately −18, as each QD contains ∼30 Sts, and the Zp of each St is −0.6. This charge could be offset by two biotin-TatPs (total Zp = 15.8). The very weak binding by monovalent TatP was also measured with two other techniques (FITC-TatP and St-Alexa488 (total Zp = −2.4) labeled TatP) (Fig. 1C). Multivalent TatP (experiments with both St-Alexa488 and -QD) showed a significant amount of binding after 15 min of exposure (Figs. 1C and 2). The very weak surface binding is intrinsic to TatP rather than the labeling method. It is common in biological systems that the strength of a ligand-receptor pair is enhanced with multivalency. The chemical and physical mechanisms underlying this phenomenon are not well understood, however, mainly due to the lack of effective assays to detect the strength of cell-surface binding in living cells. Here, we show that single molecule microscopy with particles resistant to photobleaching can be employed as a tool to measure binding in living cells.
We also found that the cell-surface HS chains of HSPG, and not the lipid phosphate groups, are essential for TatP binding, as demonstrated with the enzymatic removal of HS (Fig. 5) and simultaneous observation of two individual molecules (Fig. 6). This result is consistent with a previous report (35) demonstrating that TatP can bind to HS/heparin in the liquid phase with a dissociation constant that is ∼2–3 orders of magnitude smaller than in the absence of lipid phosphate groups (48).
Both the trajectory and the mD of 2-val TatP, which is unlikely to induce HSPG cross-linking, were found to be similar to that of CD4 (Fig. 3). Thus, the species of HSPG that binds to TatP might initially exist as a monomer (Fig. 8). When 8-val TatP cross-links with the HSPG, Rac1 is activated, inducing frequent, constitutive recruitment of 8-val TatP/TatRs to actin-associated lipid raft microdomains. The 8-val TatP/TatRs that are recruited to these domains have reduced degrees of freedom, probably through Rac1-mediated membrane actin polymerization. Thus, 8-val TatP lipid raft association is more likely to occur. Accordingly, we observed that ≥2 of each 8-val TatP-TatR complex is located in close proximity to a confined area of the plasma membrane that is below the resolution of the microscope. We found that 8-val TatP exposure activates membrane ruffling and increases the level of macropinocytosis through Rac1-dependent mechanisms (Fig. 4, B–D). Notably, cell-bound 8-val TatP could be internalized when as few as ∼30 8-val particles/cell were attached. In contrast, when ∼400 2-val TatP particles/cell were attached, only marginal internalization occurred by 1 h after exposure (data not shown). We found that the initial cell-surface binding velocity of 8-val TatP is only ∼6-fold higher than that of 2-val TatP (Fig. 2, C and F), but the number of TatPs entering cells after 1 h is 120-fold higher.3 By FACS analysis (supplemental Fig. S7), we found that in the presence of heparin both the binding to the surface and the internalization of the 8-val TatPs are completely abrogated. We found that 2-val TatP can bind to the surface, but it remains on the surface for ∼1 h. Its binding is also completely abrogated by heparin exposure. Monovalent TatP-QDs could neither bind to the cell surface nor be internalized. Collectively, these results suggest that both the initial binding of cell surface HSPG and the activation of the signal for internalization are essential for the TatP-QDs getting inside the cells. With our recently developed three-dimensional single particle tracking system (22, 30), we observed that after ∼35 min of exposure, 8-val TatP completely stops moving randomly and starts to internalize and move toward the nucleus. We also found that 2-val TatP exhibits only random movements near the glass surface.4 In our system, without binding to the cell surface, no direct translocation on the membrane can be achieved by monovalent TatP-QDs. Thus, we strongly believe that macropinocytosis of TatP/HSPGs is the only route of entry for TatP. Collectively, multivalent TatP induces HSPG cross-linking to recruit activated Rac1 to lipid rafts; it thereby enhances the recruitment of TatP/HSPG to actin-associated microdomains and internalization by macropinocytosis. These results should guide the design of TatP-based peptides with sufficient transduction efficiencies to be used as therapeutic nanocarriers.
FIGURE 8.

A model showing the events in plasma membrane exposed to 2-val and 8-val TatP. HSPG exists as a monomer; 8-val TatP clusters with several HSPGs, leading to recruitment of Rac1 to lipid rafts, which triggers membrane reorganization of actin filaments and/or actin-dependent domains and induces the temporary immobilization and clustering of 8-val TatP/HSPGs. Rac1 activation induces TatP/HSPG internalization through macropinocytosis.
Regarding the expression of HSPG in the HeLa, HepG2, and HOS cell lines, we found that the MFIs of F58-10E4 mAb were the highest in HepG2 and the lowest in HeLa cells (Fig. 7A). In contrast, the level of 8-val TatP binding to the cellular surface was highest in HOS and lowest in HepG2 (Fig. 7, B and C). These results suggest that the level of TatP binding in different cell types does not correlate with the levels of F58-10E4 bound to the cells. However, the ability of TatP to bind these cells requires cell-surface GAG chain expression, as the binding capacity of 8-val TatP to the cell surface is totally abrogated by HS lyase treatment. An enormous number of potential GAG structures can be synthesized as part of the complex process of GAG chain synthesis and modification. Specific modified forms of GAG induce the lock-and-key interaction between HS/heparin and ligands and occur in a tissue- and cell type-specific manner (45). We hypothesize that TatP-specific GAG units are preferentially added in some cell types or some types of HSPGs. Consequently, the level of TatP bound to the cell could vary regardless of the level of F58-10E4 bound to those cells. It has also been shown that HSPG always works as a co-receptor with various other factors. Thus, another possible explanation is that TatP binds to an unidentified secondary cell-surface receptor, which determines the level of TatP binding to the cell surface. As subfamilies of HSPGs exist (45), future studies should focus on the identification of the relevant HSPGs, the structural determinants within the HS chains that mediate TatP binding, and the secondary TatRs.
We have not confirmed that our findings are applicable in vivo; however, we have already reported that our visualization system can track a single tumor-targeting antibody-QD in tumors of live mice (49). Therefore, future studies can focus on whether multivalent TatP-QDs can efficiently bind to and be taken up by cells in vivo.
Acknowledgment
We thank Dr. Toshio Hattori for logistical support in performing the study.
This work was supported by a grant-in-aid for AIDS research from the Ministry of Health, Labor, and Welfare of Japan and by the Japanese Foundation for AIDS Prevention (to Y. S.).

The on-line version of this article (available at http://www.jbc.org) contains supplemental “Experimental Procedures,” Figs. S1–S7, and Videos 1–8.
J. Imamura, unpublished results.
Y. Suzuki, unpublished results.
- TatP
- Tat-protein transduction domain
- HS
- heparan-sulfate
- HSPG
- HS-proteoglycan
- QD
- quantum dot
- St
- streptavidin
- Ch
- chondroitinase
- DIC
- differential interference contrast
- MFI
- mean fluorescent intensity
- GPI
- glycosylphosphatidylinositol-anchored
- GAG
- glycosaminoglycan
- LatB
- latrunculin-B
- MBC
- methyl-β-cyclodextrin
- MSD
- mean square displacement
- val
- valent
- TatR
- TatP Receptor.
REFERENCES
- 1. Frankel A. D., Pabo C. O. (1988) Cell 55, 1189–1193 [DOI] [PubMed] [Google Scholar]
- 2. Green M., Loewenstein P. M. (1988) Cell 55, 1179–1188 [DOI] [PubMed] [Google Scholar]
- 3. Chauhan A., Tikoo A., Kapur A. K., Singh M. (2007) J. Control Release 117, 148–162 [DOI] [PMC free article] [PubMed] [Google Scholar]
- 4. Fawell S., Seery J., Daikh Y., Moore C., Chen L. L., Pepinsky B., Barsoum J. (1994) Proc. Natl. Acad. Sci. U.S.A. 91, 664–668 [DOI] [PMC free article] [PubMed] [Google Scholar]
- 5. Vivès E., Brodin P., Lebleu B. (1997) J. Biol. Chem. 272, 16010–16017 [DOI] [PubMed] [Google Scholar]
- 6. Nagahara H., Vocero-Akbani A. M., Snyder E. L., Ho A., Latham D. G., Lissy N. A., Becker-Hapak M., Ezhevsky S. A., Dowdy S. F. (1998) Nat. Med. 4, 1449–1452 [DOI] [PubMed] [Google Scholar]
- 7. Sodroski J., Patarca R., Rosen C., Wong-Staal F., Haseltine W. (1985) Science 229, 74–77 [DOI] [PubMed] [Google Scholar]
- 8. Schwarze S. R., Ho A., Vocero-Akbani A., Dowdy S. F. (1999) Science 285, 1569–1572 [DOI] [PubMed] [Google Scholar]
- 9. Wadia J. S., Stan R. V., Dowdy S. F. (2004) Nat. Med. 10, 310–315 [DOI] [PubMed] [Google Scholar]
- 10. Sandgren S., Cheng F., Belting M. (2002) J. Biol. Chem. 277, 38877–38883 [DOI] [PubMed] [Google Scholar]
- 11. Rusnati M., Coltrini D., Oreste P., Zoppetti G., Albini A., Noonan D., d'Adda, di Fagagna F., Giacca M., Presta M. (1997) J. Biol. Chem. 272, 11313–11320 [DOI] [PubMed] [Google Scholar]
- 12. Tyagi M., Rusnati M., Presta M., Giacca M. (2001) J. Biol. Chem. 276, 3254–3261 [DOI] [PubMed] [Google Scholar]
- 13. Gump J. M., June R. K., Dowdy S. F. (2010) J. Biol. Chem. 285, 1500–1507 [DOI] [PMC free article] [PubMed] [Google Scholar]
- 14. Dathe M., Schümann M., Wieprecht T., Winkler A., Beyermann M., Krause E., Matsuzaki K., Murase O., Bienert M. (1996) Biochemistry 35, 12612–12622 [DOI] [PubMed] [Google Scholar]
- 15. Mishra A., Gordon V. D., Yang L., Coridan R., Wong G. C. (2008) Angew. Chem. Int. Ed. Engl. 47, 2986–2989 [DOI] [PubMed] [Google Scholar]
- 16. Suzuki T., Futaki S., Niwa M., Tanaka S., Ueda K., Sugiura Y. (2002) J. Biol. Chem. 277, 2437–2443 [DOI] [PubMed] [Google Scholar]
- 17. Xiao H., Neuveut C., Tiffany H. L., Benkirane M., Rich E. A., Murphy P. M., Jeang K. T. (2000) Proc. Natl. Acad. Sci. U.S.A. 97, 11466–11471 [DOI] [PMC free article] [PubMed] [Google Scholar]
- 18. Barillari G., Gendelman R., Gallo R. C., Ensoli B. (1993) Proc. Natl. Acad. Sci. U.S.A. 90, 7941–7945 [DOI] [PMC free article] [PubMed] [Google Scholar]
- 19. Toschi E., Bacigalupo I., Strippoli R., Chiozzini C., Cereseto A., Falchi M., Nappi F., Sgadari C., Barillari G., Mainiero F., Ensoli B. (2006) Mol. Biol. Cell 17, 1985–1994 [DOI] [PMC free article] [PubMed] [Google Scholar]
- 20. Albini A., Soldi R., Giunciuglio D., Giraudo E., Benelli R., Primo L., Noonan D., Salio M., Camussi G., Rockl W., Bussolino F. (1996) Nat. Med. 2, 1371–1375 [DOI] [PubMed] [Google Scholar]
- 21. Liu Y., Jones M., Hingtgen C. M., Bu G., Laribee N., Tanzi R. E., Moir R. D., Nath A., He J. J. (2000) Nat. Med. 6, 1380–1387 [DOI] [PubMed] [Google Scholar]
- 22. Watanabe T. M., Sato T., Gonda K., Higuchi H. (2007) Biochem. Biophys. Res. Commun. 359, 1–7 [DOI] [PubMed] [Google Scholar]
- 23. Nguyen V. T., Kamio Y., Higuchi H. (2003) EMBO J. 22, 4968–4979 [DOI] [PMC free article] [PubMed] [Google Scholar]
- 24. Medintz I. L., Uyeda H. T., Goldman E. R., Mattoussi H. (2005) Nat. Mater. 4, 435–446 [DOI] [PubMed] [Google Scholar]
- 25. Jaiswal J. K., Mattoussi H., Mauro J. M., Simon S. M. (2003) Nat. Biotechnol. 21, 47–51 [DOI] [PubMed] [Google Scholar]
- 26. David G., Bai X. M., Van der Schueren B., Cassiman J. J., Van den Berghe H. (1992) J. Cell Biol. 119, 961–975 [DOI] [PMC free article] [PubMed] [Google Scholar]
- 27. Gómez-Moutón C., Lacalle R. A., Mira E., Jiménez-Baranda S., Barber D. F., Carrera A. C., Martínez-A C., Mañes S. (2004) J. Cell Biol. 164, 759–768 [DOI] [PMC free article] [PubMed] [Google Scholar]
- 28. Suzuki Y., Rahman M., Mitsuya H. (2001) J. Immunol. 167, 3064–3073 [DOI] [PubMed] [Google Scholar]
- 29. Suzuki K. G., Fujiwara T. K., Sanematsu F., Iino R., Edidin M., Kusumi A. (2007) J. Cell Biol. 177, 717–730 [DOI] [PMC free article] [PubMed] [Google Scholar]
- 30. Watanabe T. M., Higuchi H. (2007) Biophys. J. 92, 4109–4120 [DOI] [PMC free article] [PubMed] [Google Scholar]
- 31. Gonda K., Watanabe T. M., Ohuchi N., Higuchi H. (2010) J. Biol. Chem. 285, 2750–2757 [DOI] [PMC free article] [PubMed] [Google Scholar]
- 32. Hikage M., Gonda K., Takeda M., Kamei T., Kobayashi M., Kumasaka M., Watanabe M., Satomi S., Ohuchi N. (2010) Nanotechnology 21, 185103. [DOI] [PubMed] [Google Scholar]
- 33. Ruan G., Agrawal A., Marcus A. I., Nie S. (2007) J. Am. Chem. Soc. 129, 14759–14766 [DOI] [PubMed] [Google Scholar]
- 34. Lidke D. S., Lidke K. A., Rieger B., Jovin T. M., Arndt-Jovin D. J. (2005) J. Cell Biol. 170, 619–626 [DOI] [PMC free article] [PubMed] [Google Scholar]
- 35. Ziegler A., Seelig J. (2004) Biophys. J. 86, 254–263 [DOI] [PMC free article] [PubMed] [Google Scholar]
- 36. Kusumi A., Nakada C., Ritchie K., Murase K., Suzuki K., Murakoshi H., Kasai R. S., Kondo J., Fujiwara T. (2005) Annu. Rev. Biophys. Biomol. Struct. 34, 351–378 [DOI] [PubMed] [Google Scholar]
- 37. Fujiwara T., Ritchie K., Murakoshi H., Jacobson K., Kusumi A. (2002) J. Cell Biol. 157, 1071–1081 [DOI] [PMC free article] [PubMed] [Google Scholar]
- 38. Hall A. (2005) Biochem. Soc. Trans. 33, 891–895 [DOI] [PubMed] [Google Scholar]
- 39. Grimmer S., van Deurs B., Sandvig K. (2002) J. Cell Sci. 115, 2953–2962 [DOI] [PubMed] [Google Scholar]
- 40. del Pozo M. A., Alderson N. B., Kiosses W. B., Chiang H. H., Anderson R. G., Schwartz M. A. (2004) Science 303, 839–842 [DOI] [PubMed] [Google Scholar]
- 41. Grande-García A., Echarri A., Del Pozo M. A. (2005) Biochem. Soc. Trans. 33, 609–613 [DOI] [PubMed] [Google Scholar]
- 42. Ridley A. J., Paterson H. F., Johnston C. L., Diekmann D., Hall A. (1992) Cell 70, 401–410 [DOI] [PubMed] [Google Scholar]
- 43. Kaplan I. M., Wadia J. S., Dowdy S. F. (2005) J. Control. Release 102, 247–253 [DOI] [PubMed] [Google Scholar]
- 44. Mayor S., Pagano R. E. (2007) Nat. Rev. Mol. Cell Biol. 8, 603–612 [DOI] [PubMed] [Google Scholar]
- 45. Esko J. D., Lindahl U. (2001) J. Clin. Invest. 108, 169–173 [DOI] [PMC free article] [PubMed] [Google Scholar]
- 46. Bartholomew J. S., Handley C. J., Lowther D. A. (1985) Biochem. J. 227, 429–437 [DOI] [PMC free article] [PubMed] [Google Scholar]
- 47. Piñon J. D., Klasse P. J., Jassal S. R., Welson S., Weber J., Brighty D. W., Sattentau Q. J. (2003) J. Virol. 77, 9922–9930 [DOI] [PMC free article] [PubMed] [Google Scholar]
- 48. Ziegler A., Blatter X. L., Seelig A., Seelig J. (2003) Biochemistry 42, 9185–9194 [DOI] [PubMed] [Google Scholar]
- 49. Tada H., Higuchi H., Wanatabe T. M., Ohuchi N. (2007) Cancer Res. 67, 1138–1144 [DOI] [PubMed] [Google Scholar]