

Abstract
The developing and mature central nervous system contains neural precursor cells expressing the proteoglycan NG2. Some of these cells continuously differentiate to myelin-forming oligodendrocytes; knowledge of the destiny of NG2+ precursors would benefit from the characterization of new key functional players. In this respect, the G protein-coupled membrane receptor GPR17 has recently emerged as a new timer of oligodendrogliogenesis. Here, we used purified oligodendrocyte precursor cells (OPCs) to fully define the immunophenotype of the GPR17-expressing cells during OPC differentiation, unveil its native signaling pathway, and assess the functional consequences of GPR17 activation by its putative endogenous ligands, uracil nucleotides and cysteinyl leukotrienes (cysLTs). GPR17 presence was restricted to very early differentiation stages and completely segregated from that of mature myelin. Specifically, GPR17 decorated two subsets of slowly proliferating NG2+ OPCs: (i) morphologically immature cells expressing other early proteins like Olig2 and PDGF receptor-α, and (ii) ramified preoligodendrocytes already expressing more mature factors, like O4 and O1. Thus, GPR17 is a new marker of these transition stages. In OPCs, GPR17 activation by either uracil nucleotides or cysLTs resulted in potent inhibition of intracellular cAMP formation. This effect was counteracted by GPR17 antagonists and receptor silencing with siRNAs. Finally, uracil nucleotides promoted and GPR17 inhibition, by either antagonists or siRNAs, impaired the normal program of OPC differentiation. These data have implications for the in vivo behavior of NG2+ OPCs and point to uracil nucleotides and cysLTs as main extrinsic local regulators of these cells under physiological conditions and during myelin repair.
Keywords: Neurodevelopment, Neurodifferentiation, Neuroprogenitor Cell, Purinergic Receptor, Signal Transduction, GPR17, Myelination
Introduction
In both the gray and white matter of adult central nervous system, there still remain many NG2+ stem-like cells that serve as oligodendrocyte precursor cells (OPCs)3 and as the primary source of remyelinating cells in demyelinated lesions. These cells (polydendrocytes), which are the majority of proliferating cells in the adult brain and spinal cord, actually represent a peculiar type of multifunctional cells because, under specific conditions, they can also give rise to neurons and astrocytes (1). Moreover, lineage tracing studies indicate that some NG2+ cells in the mature brain cease proliferating and rarely, if ever, undergo differentiation (2). Finally, some NG2+ cells might also generate action potentials (3) and physically interact with axon terminals filled with synaptic vesicles, leading to the novel concept of neuron-polydendrocyte synapses. NG2+ cells thus represent a heterogeneous population of precursors whose complete characterization would benefit from the identification of new markers mapping specific functional/differentiation stages.
In this respect, we recently identified the membrane G protein-coupled receptor GPR17 activated by uracil nucleotides (UDP-glucose and UDP) and cysteinyl leukotrienes (cysLTs, like LTD4 and LTE4) (4–7) as a new key player in oligodendrocyte differentiation (8). We have originally demonstrated that, in primary cortical neuron-glia cultures, GPR17 is expressed by OPCs together with typical preoligodendroglial markers like NG2 and O4 (8). In vivo, GPR17 was found on rodent adult OPCs of brain (8) and spinal cord parenchyma (9). Both in vivo and in vitro, co-localization of GPR17 with markers of mature myelinating oligodendrocytes (e.g. myelin basic protein (MBP)) was found to a very small extent (8). Important from a functional point of view, we also originally showed that the pharmacological manipulation of GPR17 with its ligands fosters the progression of preoligodendrocytes toward mature myelinating cells (8). Accordingly, GPR17-forced overexpression inhibits OPC differentiation and maturation, and, conversely, GPR17 knock-out mice show precocious onset of myelination (10).
However, more data are needed to explore in detail the time-dependent changes of GPR17 during OPC differentiation, its presence at specific maturation stages, and its role in the proliferation and multifaceted functions of NG2+ cells. Moreover, despite extensive signaling studies on recombinant GPR17 in various heterologous expression models suggesting GPR17 coupling to both cAMP formation and, under certain circumstances, to calcium increases (4, 8, 11), no data are available on the signaling mechanisms and second messengers utilized by the natively occurring receptor in OPCs. The relatively low number of OPCs (∼5–10%) in the previously utilized neuronal-glia cultures (8) has hampered the functional characterization of GPR17 and of its signaling. On this basis, the present study was undertaken on purified OPCs from rat cortex to characterize GPR17 expression during spontaneous in vitro differentiation, to define fully the immunophenotype of GPR17-expressing cells and to unveil the signaling pathways of the native receptor.
We show that GPR17 identifies two distinct stages of slowly proliferating NG2+ cells. We also provide strong evidence indicating inhibition of cAMP as the main signaling pathway of native GPR17 upon activation by its endogenous ligands. Finally, we provide pharmacological and gene silencing data to establish a mechanistic role of GPR17 in OPC differentiation.
EXPERIMENTAL PROCEDURES
Primary OPC Cultures
OPCs were isolated from mixed glial cultures from embryonic day 19 or postnatal day 2 Sprague-Dawley rat cortex, by the shaking method, as described (12–14). OPCs were plated onto poly-d,l-ornithine-coated (final concentration 50 μg/ml; Sigma-Aldrich) 13-mm or 24-mm glass coverslips for immunocytochemistry, single-cell RT-PCR (1.5 × 10⁴ cells/coverslip) or calcium imaging studies (8 × 10⁴ cells/coverslip) in Neurobasal with 2% B27 (Invitrogen), 2 mm l-glutamine, 10 ng/ml human platelet-derived growth factor BB (Sigma-Aldrich), and 10 ng/ml human basic fibroblast growth factor (Invitrogen) to promote proliferation. After 1 day, cells were switched to a Neurobasal medium lacking growth factors to allow differentiation. In some experiments, triiodothyronine T3 was added to a final concentration of 400 ng/ml, as indicated in the legends of Figs. 8 and 9. 87.6 ± 2.9% of cells were positive for the Olig2, (n = 4900, from five independent experiments); a very low percentage of contaminating astrocytes and microglia was found.
FIGURE 8.

Cangrelor delays and UDP-glucose accelerates OPC differentiation in vitro. Primary purified OPCs were cultured in differentiating medium containing T3. At day 5, either the GPR17 antagonist cangrelor (10 μm) or the agonist UDP-glucose (100 μm) was added to cultures. After 48 h, cells were fixed and immunostained with anti-GPR17, anti-MBP, and anti-CNPase antibodies. A, histograms show quantification of the percentage of cells expressing the indicated oligodendrocyte markers in control and treated cells (with vehicle-treated control cells set to 100%). Hoechst 33258 was used to label cell nuclei. The number of positive cells was counted in 10 optical fields under a 10 × magnification (∼2000 cells/coverslip in the control condition). For cangrelor, data are the mean ± S.E. (error bars) of cell counts from a total of 10–20 coverslips/condition from four independent experiments. For UDP-glucose, data are the mean ± S.E. of cell counts from a total of 9 coverslips/condition from three independent experiments run in parallel with cangrelor (**, p < 0.001; *, p < 0.05 compared with control, one-way ANOVA, followed by Bonferroni's multiple comparison test. #, p < 0.01 compared with control, Student's t test). B, representative images of control, cangrelor-, or UDP-glucose-treated cells show double immunostaining with anti-GPR17 and anti-MBP antibodies. Nuclei were labeled with Hoechst 33258. Scale bars, 15 μm.
FIGURE 9.

GPR17 knock-down by specific siRNAs impairs the normal program of oligodendrocyte differentiation and abolishes the differentiating effects induced by UDP-glucose. OPCs were plated in 24 wells, and after 3–4 days in differentiating medium containing T3, they were treated with either siRNAs specifically designed against rat GPR17 or ineffective randomly designed siRNA utilized as a negative control. After 72 h, cells were fixed and stained with anti-GPR17 and anti-MBP antibodies. A, histograms show the quantification of GPR17+ or MBP+ cells in control (neg) and silenced (siRNA) OPC cultures (with control cells set to 100%). In GPR17-silenced cultures, a significant reduction of the number of MBP+ cells with respect to control was observed, along with the expected significant reduction in the number of GPR17+ cells. **, p < 0.0001 compared with control, Student's t test. There were no significant changes in the total number of cells, as shown by labeling of cell nuclei with Hoechst 33258. The number of positive cells was counted in 10 optical fields under a 10 × magnification (∼2000 cells/coverslip in the control condition). Data are the mean ± S.E. (error bars) of counts from a total of 10 coverslips/condition from three independent experiments. B, in a set of four experiments, at day 3, OPCs cultured in differentiating medium containing T3 were transfected with siRNA and, after 48 h, treated with UDP-glucose (100 μm) for an additional 48 h. Cells were fixed to assess the differentiation degree by immunocytochemistry. Histograms show the quantification of MBP+ cells in control (neg) and silenced (siRNA) OPC cultures (with control cells set to 100%), in the absence or presence of UDP-glucose (100 μm). In line with data reported in A, in GPR17-silenced cultures, a significant reduction of the number of MBP+ cells with respect to control was reproduced. Moreover, in line with data reported in Fig. 8, UDP-glucose induced a significant increase in the percentage of mature MBP+ cells (*, p < 0.05). In the absence of GPR17, the differentiating effect of UDP-glucose was dramatically reduced (**, p < 0.0001 with respect to control (neg), one-way ANOVA, followed by Bonferroni's multiple comparison test). There were no significant changes in the total number of cells, as shown by labeling of cells nuclei with Hoechst 33258. The loss of the UDP-glucose-induced effect after GPR17 silencing is even more evident if, in the siRNA-treated cultures, data are expressed as percentage increase of MBP+ oligodendrocytes with respect to the basal number of MBP+ cells set to 100% (right columns).
Immunocytochemistry
Primary OPCs were fixed at room temperature with 4% paraformaldehyde in 0.1 m PBS. Double labeling was performed using the in-house made anti-GPR17 polyclonal antibody (1:100; 2.5 h at room temperature) (8) with the selected primary antibodies in goat serum dilution buffer (450 mm NaCl, 20 mm sodium phosphate buffer, pH 7.4, 15% goat serum, 0.3% Triton X-100). The following primary antibodies were used: mouse anti-NG2 (1:200; Abcam, Cambridge, UK), rabbit Olig2 (1:600; Chemicon, Millipore), mouse anti-O4 (1:100), mouse anti-O1 (1:500), mouse anti-CNPase (1:100), rat anti-MBP (1:200), (all from Chemicon), mouse anti-phosphohistone H3 (PH3, 1:500, Cell Signaling, Danvers, MA). Double labeling with anti-O4 was performed using detergent-free buffers. When co-staining with primary antibodies developed in the same species was done, GPR17 was detected with the high sensitivity tyramide signal amplification kit (PerkinElmer Life Sciences).
Cells were then incubated for 1 h at room temperature with the secondary goat anti-rabbit and goat anti-mouse antibodies conjugated to Alexa Fluor 488 or Alexa Fluor 555 (1:600 in goat serum dilution buffer; Molecular Probes, Invitrogen). An additional step with the UV fluorescent dye Hoechst 33258 (1:10,000, Molecular Probes, Invitrogen) for the nuclei labeling was performed. Coverslips were finally mounted with a fluorescent mounting medium (Dako, Milan), and analyzed as described (8). The total number of cells counted for any given condition is indicated as n.
Immunohistochemistry
Male Sprague-Dawley rats were perfused with 4% paraformaldehyde in 0.1 m PBS. Brains were postfixed for 1 h and then incubated for 24 h in 30% sucrose, embedded in OCT (Cell Path), and then frozen at −80 °C. Frozen sections (16 μm) were stained as described previously (8). The following Chemicon primary antibodies were used: rabbit anti-Olig2 (1:800), rabbit anti-NG2 (1:200), mouse anti-proteolipid protein (PLP) (1:100), and rat anti-MBP (1:200). GPR17 was detected with the tyramide signal amplification system (PerkinElmer Life Sciences).
BrdU Incorporation
The degree of cell proliferation was determined by analyzing BrdU incorporation in OPCs. After 5 days in culture, 10 μm BrdU was added to cells for 5 and 24 h. After fixing, cells were incubated in 2 n HCl for 30 min at room temperature to denaturate nuclear DNA, followed by washes with 0.1 m sodium borate, pH 8.5, to neutralize HCl, and immunostaining was performed using rat anti-BrdU (1:400; Abcam) in parallel with rabbit anti-NG2 (1:100, Chemicon) or rabbit anti-GPR17 as described. The total number of cells counted for any given condition is indicated as n.
Real-time and RT-PCR Studies
Total RNA was extracted using the TRIzol reagent method (Invitrogen). The quality of RNA samples was assessed with an Agilent 2100 Bioanalyzer (Agilent Technologies, Palo Alto, CA). One μg of total RNA was used for semiquantitative real-time RT-PCR (AMV first-strand cDNA Synthesis kit and Faststart DNA Master SYBR Green 1 PCR mix; Roche Diagnostics), with the following primers: GPR17 forward, CTGCTACCTGCTGATCATTCG and reverse, TAGACTGAACGGTGGATGTGG; MPB forward, CGATTGGGTGTCACTCCGAAA and reverse, CCCAGCAGAGAATGAACACAA; PLP1 forward, AAGTCGCAGAGGAATGAAAGC and reverse, AAGGACATTCCTGCTTTCTACC; GAPDH forward, AATGCATCCTGCACCACCAAC and reverse, TGGATGCAGGGATGTTCTG.
Data analysis was performed using LightCycler software (Roche Diagnostics) with quantification and melting curve options. The acquired fluorescence signal was quantified by the second derivative maximum method using LightCycler data analysis software to obtain crossing point values (Cp) and PCR efficiency (E). Changes in concentration of the amplified target were detected as differences in threshold cycle (ΔCp) between samples; relative expression ratio (R) of target genes were calculated based on E and ΔCP and expressed as a ratio to the reference housekeeping gene GAPDH.
For single-cell RT-PCR studies, one living cell or a small pools of cells (up to 10) was sucked into a patch pipette by applying a negative pressure and then processed for RT-PCR, using oligo(dT) for retrotranscription (Invitrogen), as described (8). The selection of oligodendrocytes was performed at the light microscope on the basis of cell morphology. Half of the reverse-transcribed cDNA product was amplified with Platinum TaqDNA polymerase. Amplifications were performed in a GeneAmp 9700 thermal cycler (Applied Biosystems) for 40 cycles (94 °C/45 s, 30 s at the optimal annealing temperature for each primer pair and 72 °C/45 s). For a complete list of primers sequences, annealing temperature (Ta), and size of PCR products for GPR17, P2Y, and cysLT receptors see Ref. 6. The following primers were also utilized: rat Olig2 forward, 5′-TCCTCCAGCACCTCCTCGTC-3′ and reverse, 5′-GTGACCCCCGTAAATCTCGC-3′ (Ta, 59.8 °C; PCR product, 306 bp); rat PDGF receptor-α (PDGFRα) forward, 5′-GGAAATCAGAACCGAGGAG-3′ and reverse, 5′-CAGTTTGATGGACGGGAGT-3′ (Ta, 55.9 °C; PCR product, 306 bp).
Primers used for two splicing forms of PLP1, PLP and DM-20, were forward, 5′-GAAAAGTTAATTGAGACCTA-3′ and reverse, 5′-TACCAGGGAAACTAGTGTGG-3′ (Ta, 57 °C; PCR products, two bands of 532 and 637 bp representing DM-20 and PLP transcripts, respectively).
Twenty-microliter aliquots of the PCR products were size separated by electrophoresis on a 1.5% agarose gel. To check GPR17 knock-down after silencing experiments, total RNA from control and silenced postnatal OPCs was extracted with TRIzol reagent according to the manufacturer's instructions. Retrotranscriptions to cDNA and PCR reactions were carried out as described (8, 16).
RNA Interference
After 3–4 days in culture, cells in proliferating medium were transfected with a siRNA specifically designed for silencing rat GPR17 (Qiagen, Milan, Italy): CCGTATAGAGAAGCACCTCAA (target sequence). The sequence was designed to minimize homology to any known vertebrate transcript and did not induce the interferon-mediated stress response pathways, according to the manufacturer's specifications. This sequence has been already successfully utilized to knock-down GPR17 specifically (6). In parallel, an ineffective randomly designed RNA sequence was used as negative control (Qiagen). In the present study, to prove a role for GPR17 in cAMP regulation, siRNAs were transfected with Lipofectamine RNAiMAX reagent (Invitrogen) as described (6) to a final concentration of 100 nm/well (24-well cell culture plate), following the manufacturer's protocol. Preliminary experiments with graded siRNA concentrations were performed to choose the optimal conditions for silencing. GPR17 knock-down was checked by RT-PCR analysis and immunocytochemistry. Measurement of cyclic AMP levels in OPCs was evaluated 48–72 h after siRNA transfection. To prove a role for GPR17 in OPC differentiation, cells were maintained in differentiating medium supplemented with T3 and after 3–4 days in culture transfected with siRNA as described above. Immunocytochemical analysis was performed 72 h after RNA interference.
Measurement of Cyclic AMP Levels
Intracellular cAMP levels were measured using a competitive protein binding method as reported (17–19). Briefly, purified OPCs were seeded on poly-d,l-ornithine 24-well plates (1.5 × 10⁴ cells/well) in 0.5 ml of medium and maintained in culture for 6–7 days (peak of GPR17 expression). For the assay, the complete medium was removed, and cells were incubated at 37 °C for 15 min with 0.4 ml of medium in the presence of the phosphodiesterase inhibitor Ro20-1724 (20 μm). The concentration-response curve of tested ligands was evaluated by assessing their ability to inhibit cAMP accumulation stimulated by 10 μm forskolin. Agonists were added to cells for 15 min. When required, cells were preincubated for 10 min with antagonists. Reactions were terminated by medium removal and addition of 200 μl of 0.4 n HCl. After 30 min, lysates were neutralized with 50 μl of 4 n KOH, and the suspension was centrifuged at 800 × g for 5 min. For determination of cAMP, cAMP-binding protein isolated from bovine adrenal glands was incubated with [3H]cAMP (2 nm), 50 μl of cell lysate or cAMP standard (0–16 pmol) at 4 °C for 150 min, in a total volume of 300 μl. Bound radioactivity was separated by rapid filtration through GF/C glass fiber filters and washed twice with 4 ml of 50 mm Tris-HCl, pH 7.4. Radioactivity was measured by liquid scintillation spectrometry.
The following pharmacological agents were tested: UDP, UDP-glucose (Sigma-Aldrich), LTD4 and LTE4 (Cayman Europe). Montelukast was a gift from Merck, and cangrelor was a gift from The Medicines Company (Parsippany, NJ).
Pharmacological Treatments
At day 5, the GPR17 antagonist cangrelor (10 μm) or the agonist UDP-glucose (100 μm) were added to OPCs in differentiating medium containing T3. After 48 h, cells were fixed and immunostained with anti-GPR17, anti-MBP, and anti-CNPase antibodies as described above. In a set of experiments, at day 3, OPCs cultured in differentiating medium containing T3 were transfected with siRNA as described and after 48 h, exposed to UDP-glucose (100 μm) for an additional 48 h. Cells were then fixed to determine their differentiation stage by immunocytochemistry.
Data Analysis
For cAMP data, a nonlinear multipurpose curve-fitting program Graph-Pad Prism was used. Data are reported as mean ± S.E. of three/four different experiments (performed in duplicate). For all other experiments, Graph-Pad Prism was also used (see legends of Figs. 8 and 9 for details).
RESULTS
In Cultured Primary OPCs, Expression of GPR17 Is Segregated from That of Myelin Markers
As a first step, we analyzed the induction of GPR17 mRNA compared with the mRNAs of some major myelin proteins, such as MBP and PLP1 during the process of spontaneous in vitro differentiation. Real-time PCR analysis showed that GPR17 mRNA was expressed at low levels at early differentiation stages (∼after 2–3 days in culture), whereas it was sharply increased immediately afterward, reaching a maximum peak around day 6, when the mRNA levels of MBP started to increase. As OPC differentiation proceeded, GPR17 mRNA progressively declined, reaching its lowest level at 14 days in culture, when, conversely, PLP1 expression reached its maximum (Fig. 1A). These expression changes were paralleled by gradual morphological changes in culture, from a very simple bipolar shape to an increasingly complex ramified morphology (see also below and Fig. 3).
FIGURE 1.

In primary rat OPC cultures, expression of GPR17 is restricted to the first in vitro days and segregated from that of myelin proteins. A, total RNA was extracted from rat OPCs cultured for 3, 6, 10, 14, and 21 days, as indicated. cDNAs obtained by retrotranscription were used for semiquantitative real-time RT-PCR. Data analysis was performed by LightCycler software with quantification and melting curve options. Fold changes are expressed as percentage of the peak value of each gene, set to 100%. B, single-cell RT-PCR was used to assess whether GPR17+ cells also express the mRNA for PDGFRα, PLP, and DM-20. Different pools of 2–5 cells, at various stages of oligodendrocyte differentiation (defined as stages 1–4), were picked up from living cultures using cell morphology as a guide at the light microscope. Representative brightfield microscope images showing OPC morphology at the selected stages are shown in the upper part of the figure. For RT-PCR analysis, each lane corresponds to a single pool of 5 cells. For bipolar precursor cells, two representative distinct pools picked up after 2 days in culture (stage 1) are shown. These cells already expressed GPR17 mRNA and only co-expressed the immature PLP splicing variant DM-20; they also expressed the immature oligodendrocyte marker PDGFRα. One representative pool of tripolar cells at day 4 in culture (stage 2) is shown. These cells maintained the same gene expression pattern of stage 1. Three representative distinct pools of ramified preoligodendrocytes picked up after 6 days in culture (stage 3) are shown. These cells expressed GPR17 together with both PLP and DM-20 mRNAs whereas they completely lost the expression of PDGFRα. Highly ramified cells (stage 4, typically MBP+, see “Results”) picked up at day 10 in culture lost GPR17 mRNA but maintained the mRNAs for both PLP1 isoforms. cDNA from adult rat brain was utilized in parallel as a positive control (shown in left panel, after 100-bp ladder, std).
FIGURE 3.

Scheme showing GPR17 expression as a function of OPC differentiation. The drawing illustrates the typical differentiation steps of OPCs, from the immature precursor to mature oligodendrocyte. Tables summarize single-cells RT-PCR (mRNA) and immunocytochemical (protein) data for GPR17 and other already known markers identifying specific differentiation stages. GPR17 can be considered as a novel lineage marker that recognizes two subsets of NG2+ cells (polydendrocytes) and pre/immature oligodendrocytes. At early stage (stage 1), bipolar OPCs already express GPR17 mRNA, but receptor protein expression is detectable only when NG2+ cells acquire a more complex morphology (stage 2, polydendrocyte stage). After this stage, GPR17 gradually increases in pre/immature oligodendrocytes, reaching a maximum peak when O4 is expressed (stage 3). GPR17 expression is then turned down, and mature MBP+ cells no longer express the receptor (stage 4). The graded changes of the GPR17 protein during differentiation are highlighted in a yellow-orange-red triangle, where orange represents the maximum expression level. N.D., not done.
To obtain more information on the expression pattern of other OPC markers in the GPR17-expressing cells, we examined genes encoding for PDGFRα, a typical marker of early OPCs, and for the two splicing variant forms of PLP1: DM-20, the predominant immature isoform during early OPC development, and the myelin protein PLP, which is instead expressed by more mature OPCs. To this purpose, at different days in culture corresponding to distinct maturation stages (stages 1–4, see Fig. 1B and Fig. 3), single-cell PCR was applied to pools of bipolar, tripolar, or ramified oligodendrocytes (2–5 cells/pool) picked up from living cultures using cell morphology at the light microscope as a guide. We found that bipolar cells at day 2 in culture (stage 1) co-expressed the mRNAs for GPR17, the immature marker PDGFRα, and the more immature PLP splicing variant DM-20. Tripolar cells at day 4 in culture (stage 2) maintained the same gene expression pattern. At day 6 (stage 3), ramified preoligodendrocytes instead co-expressed GPR17 mRNA together with the mRNAs for both PLP and DM-20 myelin proteins, whereas they no longer expressed PDGFRα mRNA (Fig. 1B). At this stage, virtually all ramified cells were still immature oligodendrocytes because very few cells (2.7 ± 0.3%, n = 2470) were found positive for the MBP at this age in culture. Highly ramified cells isolated at day 10 in culture (stage 4) were instead typically MBP+; these cells had lost GPR17 mRNA but still maintained the mRNAs for both PLP1 isoforms (Fig. 1B). Altogether, these data suggest that, during in vitro OPC specification, GPR17 expression is restricted to cells at early differentiation stages characterized by distinct expression patterns.
GPR17 Protein Decorates Two Distinct Stages of Slowly Proliferating NG2+ OPCs
To get more information on the morphological characteristics and immunophenotye of GPR17-expressing cells, we then followed the appearance of the GPR17 protein in culture by employing our anti-GPR17 antibody (4) along with a variety of specific markers labeling differentiation stages characterized by distinct morphologies (i.e. O4 and O1 for pre/immature oligodendrocytes, MBP for mature cells, see also above).
At early stages (∼ 1, 2 days) in culture, OPCs showed a typical bipolar morphology with little secondary branching and were positive for NG2 (Fig. 2A). These cells accounted for the 72 ± 6.7% of the total cell population (n = 2350 cells, four independent experiments). Despite the presence of GPR17 mRNA (Fig. 1), at this initial stage, the GPR17 protein was undetectable in the majority of cells, being present only in cells with a tripolar or more complex morphology (Fig. 2A′). These NG2+-GPR17+ double-positive cells accounted only for the 2.6 ± 0.4% of NG2+ population (n = 1496, from three independent experiments). As OPCs started to differentiate spontaneously in vitro, strong GPR17 immunolabeling was found in NG2+ cells with many branched processes emerging from the cell body (Fig. 2B), thus increasing the percentage of NG2+-GPR17+ double-positive cells to 23 ± 2.7% of the total NG2+ population (Fig. 2B, n = 1010, from four independent experiments). Some of these cells were also positive for the immature oligodendrocyte marker A2B5 (data not shown). Interestingly, at stage 2, the DM-20 and PLP isoforms are not expressed by OPCs as assessed by both immunocytochemistry (supplemental Fig. S1A) and by Western blot analysis performed in parallel with rodent brain extracts utilized as positive controls (supplemental Fig. S1C). On the contrary, at this early stage in culture, the PDGFRα protein is present in almost all cells, and double staining with the anti-GPR17 antibody indicates that morphologically immature GPR17+ cells also co-express PDGFRα (supplemental Fig S1, D and D′). The presence of PDGFRα was also confirmed by Western blot analysis (supplemental Fig. S1G). The number of GPR17+ OPCs continued to increase during differentiation, reaching a maximum peak around day 6 when they represented about 70% of the total cell population and when a significant number of cells acquired a preoligodendrocyte phenotype (Fig. 2, C and G), as assessed by immunoreactivity for O4 (number of O4+/total, 35.8 ± 5.3%, n = 4406) and O1 (Fig. 2G). At this stage, 59.8 ± 7.9% of GPR17+ OPCs were still immunoreactive for NG2 (n = 3454, from six independent experiments); 48.3 ± 7.9% of GPR17+ OPCs acquired O4 immunoreactivity (n = 1829, from three independent experiments; Fig. 2, D and H), whereas only 1.4 ± 1.1% of GPR17+ cells co-localized with the mature marker MBP (n = 2770, from five independent experiments; Fig. 2, E and F). Of note, at this stage, the majority of O4+ cells were also immunoreactive for GPR17 (GPR17+-O4+, 82 ± 6.5%; total number of O4+, 700; data from three independent experiments). Moreover, at this time in culture (stage 3), some GPR17+ cells also started to express the proteolipid protein (see white arrows in supplemental Fig. S1B); Western blot analysis indeed showed the presence of the DM-20 isoform (supplemental Fig. S2C). Conversely, virtually all of the ramified GPR17+ cells had lost expression of PDGFRα (supplemental Fig. S1E), as also confirmed by Western blot analysis showing massive reduction of the specific PDGFRα immunoreactive band (supplemental Fig. S1G). When the majority of cells differentiated to immature oligodendrocytes, as assessed by O1 immunostaining (∼at day 10; Fig. 2G), almost all GPR17+ cells co-expressed O1 (number of GPR17+/total, 63.55 ± 2.67%; and O1+-GPR17+, 79.07 ± 7.35% versus GPR17+ cells, n = 960 from three independent experiments) and were losing expression of NG2. At later stages of maturation, while MBP immunoreactivity progressively increased up to day 21 (when oligodendrocytes reach terminal differentiation), labeling for GPR17 constantly declined, and the percentage of double-positive GPR17+-MBP+ cells decreased from 26.29 ± 2.51% at day10 to almost zero at day 21. Incidentally, typically mature cells did not express either GPR17 or PDGFRα (supplemental Fig. 2F). A summary of GPR17 expression together with other already known markers of different OPC differentiation stages is reported in Fig. 3. In line with our previous indications (8), in vivo immunohistochemistry in rat cortex showed co-expression of GPR17 with Olig2 and NG2, but not with mature oligodendrocyte markers like PLP and MBP (Fig. 4), thus confirming the validity of our in vitro results.
FIGURE 2.

In primary rat OPC cultures, GPR17 decorates specific subsets of slowly proliferating highly ramified NG2+ OPCs, and its expression is turned down in morphologically mature myelinating cells. Representative images of purified primary OPCs cultured for 2 days show NG2+ precursors (red fluorescence) exhibiting bipolar (stage 1) or tripolar morphology with little secondary branching (stage 2). A, at stage 1, only a small percentage of NG2+ cells co-stained for the GPR17 protein (an example is shown in A′), whereas most cells already expressed GPR17 mRNA (see “Results”). B, as OPCs spontaneously differentiated in culture, strong GPR17 labeling appeared in cells with more processes emerging from the cell body (stage 2). C, the number of GPR17+ OPCs continued to increase during differentiation, reaching its maximum when a significant number of cells acquired a ramified morphology (stage 3). D, at this stage, GPR17+ cells became positive for O4 (in red) and O1 (data not shown), typical markers of pre-/immature oligodendrocytes. Co-localization of GPR17 with markers of mature, myelinating oligodendrocytes MAG (data not shown) and MBP (E) was found only to a much lesser extent. Nuclei were labeled with Hoechst 33258 dye (blue). Scale bars, 15 μm. F, histograms show quantification of the percentage of ramified GPR17+ cells that also co-express the indicated oligodendrocyte markers in 6-day-old cultures (stage 3). G, presence of the GPR17 protein on preoligodendrocytes decreases in parallel with the in vitro maturation of cells toward fully differentiated oligodendroglia. At the indicated times in culture, cells were fixed and immunostained with antibodies against GPR17 and markers of specific oligodendrocyte differentiation stages (O1, MBP, or PH3, as indicated). Labeling with the mitotic marker PH3 showed that oligodendrocyte proliferative ability gradually decreased with time, in parallel with their terminal differentiation. To evaluate the proliferative abilities of GPR17+ cells, BrdU (10 μm) was added to 5-day-old cultures for 5 or 24 h. Cells were then fixed and processed as described under “Experimental Procedures.” H, representative images show NG2+ cells (in red) that have incorporated BrdU in their nuclei (in green). I, GPR17+ cells (in green) show nuclear BrdU staining (in red) after 24-h treatment with BrdU. J, graph shows the percentage of NG2+ proliferating cells (red line) compared with the percentage of mitotic GPR17+ cells (blue line) after the 5- or 24-h BrdU treatment. Data represent the mean ± S.E. (error bars) of three separate experiments. At each time point, the number of proliferating NG2+ cells was higher compared with the number of mitotic GPR17+ cells.
FIGURE 4.

In rat brain, GPR17 is expressed in OPCs and not in mature oligodendrocytes. Immunohistochemistry experiments were performed to detect GPR17 (red fluorescence) in parallel with early (Olig2 and NG2) or late (PLP and MBP) markers of oligodendrogliogenesis (green fluorescence) as described under “Experimental Procedures.” A and B, co-localization of GPR17 with the transcription factor Olig2 (A) and with the membrane proteoglycan NG2 (B and B′). C and D, no co-localization was observed with proteolipid protein PLP (C) and with MBP (D). Nuclei were labeled with Hoechst 33258 dye (blue). Scale bars, 20 μm.
We also assessed the nuclear labeling for the mitotic marker PH3 on cells fixed at distinct times in culture (Fig. 2G). The number of PH3+ oligodendrocytes was quite high at day 3 in culture and decreased progressively with time, in line with the time-dependent increase of oligodendrocyte terminal differentiation (Fig. 2G). Interestingly, the number of mitotic GPR17 cells (i.e. double-labeled PH3+-GPR17+ cells) was low at each time point (data not shown). To analyze in more detail the proliferative abilities of the GPR17-expressing OPCs, we exposed living OPCs to the DNA synthesis precursor BrdU (10 μm) for 5 or 24 h and looked at its nuclear incorporation in GPR17+ cells. At variance from PH3, BrdU immunostaining indicates the number of cells that have proliferated during the entire period of BrdU exposure. Because, as mentioned above, NG2+ cells represent the most proliferating stem-like cells in the CNS, we also determined the number of BrdU-positive NG2+ cells. For each BrdU pulse, the percentage of proliferating NG2+ cells over the total NG2+ population (11.4 ± 4%, n = 380 and 35.6 ± 6.6%, n = 1550, after 5 and 24 h; Fig. 2, I–K) was much higher than the number of proliferating GPR17+ cells (5.6 ± 1.2%, n = 400 and 10.4 ± 3.5%, n = 1500 after 5 and 24 h; Fig. 2, I–K). Thus, GPR17-expressing OPCs have a quite low proliferation rate, and the time-dependent increase of GPR17+ cells in culture is mainly due to the spontaneous differentiation of the already present OPCs rather to proliferation of the GPR17+ cell subpopulation.
In Cultured Primary OPCs, GPR17 Responds to Its Endogenous Agonists with Selective Coupling to Inhibition of Adenylyl Cyclase
Because GPR17 can respond to both nucleotides and cysLTs (4, 8, 11), to dissect the signaling pathway(s) associated with the native receptor in OPCs, we first performed a detailed single-cell RT-PCR analysis of all cloned P2Y and cysLT1 and cysLT2 receptors. This approach was needed to estimate the potential contribution of other co-expressed receptors of the same family to the responses detected in OPCs upon exposure to these ligands.
Analysis of 2–10 cells picked up from living cultures showed that, together with GPR17, all P2Y receptors (i.e. P2Y1,2,6,12,13,14), with the only exception of P2Y4, were co-expressed in preoligodendrocytes (supplemental Fig. S2). Concerning cysLT receptors, cysLT1 was not found (supplemental Fig. S2B), whereas a specific band for cysLT2 was identified (supplemental Fig. S2C).
As recombinant P2Y receptors, including P2Y12,13,14, GPR17 and cysLT can couple to the Gq protein and phospholipase C to increase intracellular calcium ([Ca2+]i) (4, 15, 20–22), the functionality of the detected receptors was investigated by single-cell calcium imaging by recording responses to the most commonly utilized P2Y agonists and LTD4. We found that a significant percentage of cells responded to ADP (supplemental Fig. S2, D and E) (75.0 ± 7.70%, n = 203, ΔF340/380, 0.43 ± 0.02) and UTP (32.5 ± 17.9%, n = 132; ΔF340/380, 0.36 ± 0.04), whereas only a very small fraction showed responses to UDP (5.08 ± 2.5%, n = 185; ΔF340/380, 0.25 ± 0.03). In five independent OPC preparations (n = 200), no cells responded to UDP-glucose or LTD4 (supplemental Fig. S2, F–H), thus ruling out the possibility that, in primary rodent OPCs, GPR17 is coupled to Gq, at least under these experimental conditions.
As previously published data demonstrate that recombinant human and rodent GPR17 is primarily coupled to the Gi protein, which, in turn, inhibits cAMP formation (4), we evaluated the possible receptor coupling to the adenylyl cyclase system. In particular, the effect of uracil derivatives and cysLTs on cAMP accumulation stimulated by forskolin was evaluated. As a first approach, cAMP production was assayed by incubating cells with increasing forskolin concentrations (from 1 to 30 μm) in the absence or presence of LTD4 (10 nm) or UDP-glucose (10 μm). Both agonists inhibited cAMP accumulation stimulated by 1, 5, and 10 μm forskolin (data not shown). No inhibition on cAMP accumulation was observed when forskolin was used at a 30 μm concentration (data not shown). Based on these data, 10 μm forskolin was then used in all subsequent functional assays.
Complete concentration-response curves to these two agonists were then performed. UDP-glucose and LTD4 concentration-dependently inhibited the cAMP formation elicited by 10 μm forskolin, with EC50 values of 424.7 ± 125 nm and 2.85 ± 0.89 nm, respectively (Fig. 5), confirming their agonist activity at native GPR17. In a similar way, also UDP and the cysLT derivative LTE4, which has recently been proposed to also act as a GPR17 agonist (8), significantly and concentration-dependently inhibited forskolin stimulation, with an EC50 value of 1.29 ± 0.07 μm and 51.8 ± 6.6 pm, respectively (Fig. 5). Interestingly, the calculated affinity constant values for all agonists are comparable with those obtained in 1321N1 cells heterologously transfected with rat GPR17 by [35S]GTPγS binding (4). To determine whether UDP-glucose and LTD4 effects could be selectively ascribed to the activation of GPR17, we performed specific experiments with the GPR17 antagonists cangrelor and montelukast (4, 8, 11). As depicted in Fig. 6, both cangrelor, an antagonist of the purinergic binding site on GPR17, and montelukast, an antagonist of the cysLT binding site on GPR17, concentration-dependently counteracted the inhibition of cAMP formation elicited by 1 μm UDP-glucose and 10 nm LTD4, with half-maximal inhibition (IC50) values in the picomolar and nanomolar range, respectively. These results suggest that the UDP-glucose and LTD4-induced effects are indeed mediated by GPR17.
FIGURE 5.

Inhibition of forskolin-stimulated adenylyl cyclase activity in primary OPCs by GPR17 agonists. A and B, OPCs were plated in 24 wells, and after 6 days in culture they were treated with 10 μm forskolin, in the absence or presence of graded concentrations of UDP-glucose (50 nm–5 μm) and UDP (500 nm–50 μm) (A) or LTD4 (0.5 nm–250 nm) and LTE4 (0.05 nm–10 nm) (B). After 15 min, reactions were stopped by the addition of HCl, and the intracellular levels of cAMP in cell lysates were evaluated as described under “Experimental Procedures.” Results are expressed as percentage of forskolin-stimulated cAMP levels set to 100%. Data represent the mean ± S.E. (error bars) of three separate experiments, each performed in duplicate.
FIGURE 6.
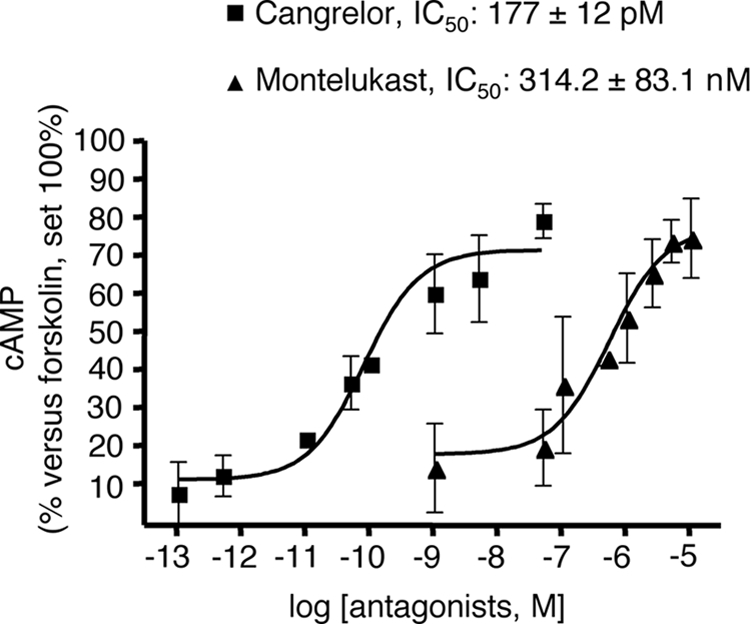
The GPR17 antagonists cangrelor and montelukast concentration-dependently counteract agonist-mediated inhibition of forskolin-stimulated adenylyl cyclase in primary OPCs. OPCs were plated in 24 wells, and after 6 days in culture they were treated with either the purinergic agonist UDP-glucose (1 μm) or the cysLT agonist LTD4 (10 nm) and 10 μm forskolin, in the absence or presence of graded concentrations of the indicated antagonists (5 pm–50 nm for cangrelor and 50 nm–10 μm for montelukast). After 15 min, reactions were stopped by the addition of HCl, and the intracellular levels of cAMP in cell lysates were evaluated as described under “Experimental Procedures.” Results are expressed as percentage of forskolin-stimulated cAMP levels set to 100%. Data represent the mean ± S.E. (error bars) of three separate experiments, each performed in duplicate.
Finally, because OPCs also express the mRNA for CysLT2 and various other P2Y receptors, including the uridine sugar nucleotide P2Y14 receptor (Fig. 3H), to prove unequivocally that the detected effects are due to GPR17, we performed silencing experiments. cAMP levels were thus determined in primary OPCs upon transfection of cells with siRNAs against rGPR17. The silencing efficiency of GPR17 was evaluated by RT-PCR experiments (Fig. 7A), immunocytochemistry (Fig. 7, B and C), and Western blotting (data not shown). Results demonstrate that, after selective GPR17 knock-down, the ability of UDP-glucose and LTD4 to inhibit forskolin-stimulated cAMP production was virtually abolished with respect to control cells exposed to randomly arranged siRNAs (Fig. 7D). These results confirm that the effects of these ligands are indeed due to the selective activation of the GPR17 receptor in OPCs.
FIGURE 7.

GPR17 knock-down in primary OPCs by specific siRNAs abolishes UDP-glucose-mediated inhibition of forskolin-stimulated adenylyl cyclase. OPCs were plated in 24 wells, and after 3–4 days in proliferating medium they were treated with either siRNAs (100 nm) specifically designed against rat GPR17 or ineffective randomly designed siRNA utilized as a negative control (neg). A, after 48–72 h, no specific amplification product for GPR17 was detected by RT-PCR in silenced samples (siRNA) with respect to controls (neg). B, immunocytochemical analysis showed a massive reduction of GPR17-positive cells (in green) in siRNA cultures with respect to negative controls (neg). In blue, cell nuclei stained with Hoechst 33258 are shown. Data from one typical experiment are shown; similar data were obtained in four independent experiments; appropriate controls for the knock-down of the GPR17 protein have been performed for each single silencing experiment. C, quantification of GPR17-expressing cells in control (neg) and silenced (siRNA) OPC cultures is shown. Fifty optical fields/coverslip were counted for a total of eight coverslips/group. Data are reported as percent of the total number of GPR17-expressing cells set to 100% and represent the mean of four independent experiments. D, UDP-glucose significantly and concentration-dependently inhibited forskolin-stimulated adenylyl cyclase in control OPCs (neg), whereas no significant inhibition was detected in GPR17 silenced cultures (siRNA) (Student's t test). Each point in graph is the mean ± S.E. (error bars) of six separate determinations from three independent experiments (left panel). In a similar way, LTD4 inhibited forskolin-stimulated adenlyl cyclase in control OPCs (neg), and this effect was completely lost in GPR17-silenced cells (siRNA). Each point in graph is the mean ± S.E. of three separate determinations from one experiment (right panel).
Cangrelor Inhibits and UDP-glucose Promotes OPC Differentiation in Culture
Having established that, in primary cultured OPCs, GPR17 is functional, we then asked whether its pharmacological modulation with agonists/antagonists had any effects on the final destiny of these cells. We reasoned that, if GPR17 is important for spontaneous OPC differentiation, then GPR17 antagonists should delay maturation by counteracting the effects mediated by endogenous GPR17 agonists; conversely, exogenous agonist ligands should accelerate OPC maturation by promoting receptor activation. Exposure of OPCs to cangrelor indeed significantly reduced the number of mature MBP+ or CNPase+ cells, whereas increasing the number of GPR17+ precursors (Fig. 8A), indicating a shift of cells toward a less differentiated stage, as also confirmed by prevalence of a morphologically undifferentiated phenotype (Fig. 8B). In contrast, the GPR17 activator UDP-glucose increased the number of MBP+ oligodendrocytes (Fig. 8A), suggesting acceleration of cell maturation, as also assessed by appearance of a myelinating phenotype in culture (Fig. 8B). In neither case were these effects due to changes in the total number of cells in culture because no changes in cell labeling with Hoechst 33258 were detected (Fig. 8A).
GPR17 Knock-down in Primary OPCs by Specific siRNAs Impairs the Normal Program of Oligodendrocyte Differentiation
Finally, to establish unequivocally a link between GPR17 activation and oligodendrocyte differentiation, we assessed the effect of GPR17 silencing on spontaneous OPC maturation. As expected, receptor knock-down significantly reduced the number of GPR17+ cells in culture; this was associated with a dramatic decrease in the number of terminally differentiated MBP+ cells (Fig. 9A). Nuclei labeling with Hoechst 33258 showed no significant changes in cell number, confirming that these effects are not due to toxicity, but are really related to GPR17 knockdown. In line with these data, in the absence of GPR17, the differentiating effects of UDP-glucose were completely lost (Fig. 9B). Thus, GPR17 is necessary for oligodendrocyte differentiation, and its silencing markedly interferes with OPC maturation. Moreover, maturation of GPR17+ OPCs is crucially driven by uracil nucleotides, suggesting a key role for these ligands in the normal differentiating program of these cells.
DISCUSSION
Here, we report the molecular characterization of GPR17 and its transduction system during the spontaneous in vitro differentiation and maturation of primary rodent NG2+ OPCs. To our knowledge, this is the first time that such a detailed description of the GPR17 signaling pathway is reported in a native system.
Our main findings are as follows. First, in cultured OPCs, the GPR17 transcript is first detected in bipolar NG2+ polydendrocytes. Receptor expression gradually increases with in vitro morphological differentiation in cells with more processes emerging from the cell body, is maximal in immature preoligodendrocytes, and then gradually decreases along with terminal maturation.
Second, in line with these findings, the GPR17 receptor protein decorates two subsets of slowly proliferating cells. The first one corresponds to early, morphologically immature and slowly proliferating NG2+ precursor cells that also express Olig2, PDGFRα, and the immature PLP isoform DM-20; the second one corresponds to more ramified, still immature preoligodendrocytes that are losing NG2 and PDGFRα immunoreactivity and already express O4, O1, and the two splicing variants of the myelin protein PLP (Fig. 3). After this differentiation stage, GPR17 expression is progressively turned down, and the GPR17 protein is never found in fully mature MAG+ (data not shown) or MBP+ oligodendrocytes. We thus propose GPR17 as a new marker that specifically labels two distinct early OPC stages characterized by the morphological features and immunophenotypes summarized in Fig. 3.
Third, in these cells, GPR17 is functional. Its activation by UDP-glucose and LTD4 did not affect intracellular calcium levels but resulted in marked inhibition of cAMP formation. Adenylyl cyclase thus represents the primary transduction signaling system of native GPR17 in OPCs.
Finally, GPR17 pharmacological inhibition or knock-down by siRNAs impaired the normal differentiation program of OPCs. Conversely, GPR17 activation with one of its endogenous ligands (UDP-glucose) accelerated OPC maturation. This effect was completely obliterated in GPR17-silenced cells.
Regarding the first and second findings, our data significantly contribute to defining the specific differentiation stage at which OPCs express GPR17. These findings significantly extend our in vitro data obtained in primary neuron-glia mixed cultures (8) and are in line with our previous and present in vivo results. In rodent cortex, GPR17 was found to be always associated with very early stages of oligodendrocyte differentiation in NG2+ or Olig2+ OPCs, and its expression was always segregated from that of mature myelinating markers such as MAG or MBP (8). Such a restricted temporal expression has been more recently confirmed by a developmental study in mice.4 Moreover, the presence of GPR17 in multifunctional NG2+ polydendrocytes suggests that it may be theoretically possible to exploit this receptor to address these cells to also generate new functional neurons and astrocytes under specific conditions (1).
Regarding the oligodendrocyte fate of the GPR17+-NG2+ precursors, we hypothesized that GPR17 has to be turned down to allow the terminal differentiation of immature oligodendrocytes (8). In line with our hypothesis, starting at postnatal week 2, transgenic mice overexpressing GPR17 under the control of the CNP1 promoter (and showing predominant transgene presence in oligodendrocytes after the precursor stage), displayed generalized tremors, hind limb paralysis reminiscent of those described for dysmyelinating mouse mutants, followed by precocious death at 3 weeks of age (10). These data confirm that the forced expression of GPR17 at advanced OPC differentiation stages (such as that of cells already expressing the mature oligodendrocyte marker CNPase) is associated with defective myelination during postnatal life. We are currently investigating the mechanisms involved in GPR17 down-regulation at specific stages of OPC differentiation (see also below).
Regarding the last two findings, this is the first demonstration that GPR17 is functionally active in native NG2+ neural progenitors and that the receptor is able to respond to endogenous GPR17 ligands, such as UDP, UDP-glucose, LTD4, and LTE4. Specifically, we identify inhibition of cAMP production as the main signaling pathway utilized by GPR17. The detected pharmacological profile for cAMP inhibition is comparable with that obtained in cells expressing the recombinant receptor (4, 8). Experiments with known GPR17 antagonists and, more important, receptor silencing via siRNAs, confirmed that these effects are selectively due to stimulation of GPR17. At variance from transfected systems, no coupling to intracellular calcium increases was detected. This suggests that, in native cells, GPR17 may be segregated from Gq proteins, which are necessary to activate PLC and calcium release from intracellular stores. Finally, GPR17 agonists promote and GPR17 antagonists delay spontaneous OPC differentiation in culture. These data, together with the demonstration that GPR17 silencing inhibits OPC maturation, unequivocally establish a mechanistic link between GPR17 and the final destiny of these cells.
GPR17 has been proposed as an intrinsic regulator of oligodendrogliogenesis (10). Although our data fully confirm the role of GPR17 in OPC specification, we propose that GPR17 is also extrinsically regulated by physiological ligands that accumulate in the extracellular milieu. The identification of inhibition of cAMP as a GPR17 main signaling pathway may help understanding the molecular mechanisms involved in the regulation of oligodendrocyte differentiation and terminal maturation and is in line with previous data implicating this signaling pathway in cell differentiation (23). In general, the activation of the cAMP pathway promotes neural precursor cell differentiation (24–26) that, in some cases, occurs through the regulation of the Id2/Id4 transcriptional factors (27, 28). We hypothesize that, by inhibiting cAMP formation at early differentiation stages, GPR17 keeps cells in an immature state, which is necessary to prepare them for myelination. When a critical stage of OPC differentiation is reached, GPR17 is down-regulated to allow cells to resume the appropriate cAMP levels necessary for their terminal maturation.
Our current hypothesis is that, at this critical stage of OPC differentiation, by binding to their receptor, GPR17 endogenous ligands induce receptor desensitization and removal from the membrane, with subsequent internalization and degradation, and that this is the key event necessary to allow OPCs to proceed to myelination. A similar process has been associated with specification of other cell lineages, where the down-regulation of membrane receptors for trophic or differentiation factors has been proposed to be necessary to allow cells to proceed toward terminal differentiation (29). For example, during erythrocyte maturation, stimulation of erythropoietin receptors by erythropoietin is necessary to induce erythroid precursor cells to proceed to the erythroblast stage; however, at this stage, erythropoietin receptors have to be removed from the cell membrane to allow precursors to become functional erythrocytes, a process that may be achieved by agonist-mediated degradation of erythropoietin receptors. Preliminary data from our group show that GPR17 ligands are indeed able to induce receptor desensitization and internalization,5,6 suggesting that, as other GPCRs, GPR17 is regulated following long time exposure to agonists (data not shown). Experiments are currently in progress to assess to what extent this is necessary for OPC terminal maturation.
Acknowledgments
We thank Dr. Enrica Boda (University of Turin) and Dr. Elisabetta Bonfanti for useful discussion and advice; and Dr. Federico Luzzati and Prof. Paolo Peretto, Dr. Paola Crociara and Prof. Luca Bonfanti (University of Turin) for providing the PDGFRα antibodies.
This work was supported by the Intramural Research Program of the NICHD, National Institutes of Health. This work was also supported by Italian Ministero della Salute RF-CNM-2007-662855 and PRIN-COFIN Project Prot. 2006059022 and 2008XFMEA3 and by FISM, Fondazione Italiana Sclerosi Multipla COD. 2010/R/2.

The on-line version of this article (available at http://www.jbc.org) contains supplemental Experimental Procedures and Figs. S1 and S2.
E. Boda, F. Viganò, P. Rosa, V. Labat-gest, F. Tempia, M. Götz, M. P. Abbracchio, L. Dimou, and A. Buffo, unpublished data.
S. Daniele, M. L. Trincavelli, P. Gabelloni, D. Lecca, M. P. Abbracchio, and C. Martini, unpublished data.
E. Parmigiani, A. Fratangeli, M. Fumagalli, D. Lecca, R. Benfante, M. Passafaro, M. P. Abbracchio, and P. Rosa, unpublished data.
- OPC
- oligodendrocyte precursor cell
- cysLT
- cysteinyl leukotriene
- GPCR
- G protein-coupled receptor
- GTPγS
- guanosine 5′-3-O-(thio)triphosphate
- MBP
- myelin basic protein
- PDGFRα
- PDGF receptor-α
- PH3
- phosphohistone PH3
- PLP1
- proteolipid protein 1
- Ta
- annealing temperature
- T3
- triiodothyronine
- CNPase
- 2′3′-cyclic nucleotide 3′-phosphodiesterase.
REFERENCES
- 1. Nishiyama A., Komitova M., Suzuki R., Zhu X. (2009) Nat. Rev. Neurosci. 10, 9–22 [DOI] [PubMed] [Google Scholar]
- 2. Rivers L. E., Young K. M., Rizzi M., Jamen F., Psachoulia K., Wade A., Kessaris N., Richardson W. D. (2008) Nat. Neurosci. 11, 1392–1401 [DOI] [PMC free article] [PubMed] [Google Scholar]
- 3. De Biase L. M., Nishiyama A., Bergles D. E. (2010) J. Neurosci. 30, 3600–3611 [DOI] [PMC free article] [PubMed] [Google Scholar]
- 4. Ciana P., Fumagalli M., Trincavelli M. L., Verderio C., Rosa P., Lecca D., Ferrario S., Parravicini C., Capra V., Gelosa P., Guerrini U., Belcredito S., Cimino M., Sironi L., Tremoli E., Rovati G. E., Martini C., Abbracchio M. P. (2006) EMBO J. 25, 4615–4627 [DOI] [PMC free article] [PubMed] [Google Scholar]
- 5. Temporini C., Ceruti S., Calleri E., Ferrario S., Moaddel R., Abbracchio M. P., Massolini G. (2009) Anal. Biochem. 384, 123–129 [DOI] [PubMed] [Google Scholar]
- 6. Daniele S., Lecca D., Trincavelli M. L., Ciampi O., Abbracchio M. P., Martini C. (2010) Cell. Signal. 22, 697–706 [DOI] [PubMed] [Google Scholar]
- 7. Calleri E., Ceruti S., Cristalli G., Martini C., Temporini C., Parravicini C., Volpini R., Daniele S., Caccialanza G., Lecca D., Lambertucci C., Trincavelli M. L., Marucci G., Wainer I. W., Ranghino G., Fantucci P., Abbracchio M. P., Massolini G. (2010) J. Med. Chem. 53, 3489–3501 [DOI] [PMC free article] [PubMed] [Google Scholar]
- 8. Lecca D., Trincavelli M. L., Gelosa P., Sironi L., Ciana P., Fumagalli M., Villa G., Verderio C., Grumelli C., Guerrini U., Tremoli E., Rosa P., Cuboni S., Martini C., Buffo A., Cimino M., Abbracchio M. P. (2008) PLoS One 3, e3579. [DOI] [PMC free article] [PubMed] [Google Scholar]
- 9. Ceruti S., Villa G., Genovese T., Mazzon E., Longhi R., Rosa P., Bramanti P., Cuzzocrea S., Abbracchio M. P. (2009) Brain 132, 2206–2218 [DOI] [PubMed] [Google Scholar]
- 10. Chen Y., Wu H., Wang S., Koito H., Li J., Ye F., Hoang J., Escobar S. S., Gow A., Arnett H. A., Trapp B. D., Karandikar N. J., Hsieh J., Lu Q. R. (2009) Nat. Neurosci. 12, 1398–1406 [DOI] [PMC free article] [PubMed] [Google Scholar]
- 11. Pugliese A. M., Trincavelli M. L., Lecca D., Coppi E., Fumagalli M., Ferrario S., Failli P., Daniele S., Martini C., Pedata F., Abbracchio M. P. (2009) Am. J. Physiol. Cell Physiol. 297, C1028–C1040 [DOI] [PubMed] [Google Scholar]
- 12. Stevens B., Porta S., Haak L. L., Gallo V., Fields R. D. (2002) Neuron 36, 855–868 [DOI] [PMC free article] [PubMed] [Google Scholar]
- 13. Ishibashi T., Dakin K. A., Stevens B., Lee P. R., Kozlov S. V., Stewart C. L., Fields R. D. (2006) Neuron 49, 823–832 [DOI] [PMC free article] [PubMed] [Google Scholar]
- 14. Chen Y., Balasubramaniyan V., Peng J., Hurlock E. C., Tallquist M., Li J., Lu Q. R. (2007) Nat. Protoc. 2, 1044–1051 [DOI] [PubMed] [Google Scholar]
- 15. Ceruti S., Fumagalli M., Villa G., Verderio C., Abbracchio M. P. (2008) Cell Calcium 43, 576–590 [DOI] [PubMed] [Google Scholar]
- 16. Fumagalli M., Trincavelli L., Lecca D., Martini C., Ciana P., Abbracchio M. P. (2004) Biochem. Pharmacol. 68, 113–124 [DOI] [PubMed] [Google Scholar]
- 17. Trincavelli M. L., Tonazzini I., Montali M., Abbracchio M. P., Martini C. (2008) J. Cell. Biochem. 104, 150–161 [DOI] [PubMed] [Google Scholar]
- 18. Colotta V., Catarzi D., Varano F., Lenzi O., Filacchioni G., Martini C., Trincavelli L., Ciampi O., Traini C., Pugliese A. M., Pedata F., Morizzo E., Moro S. (2008) Bioorg. Med. Chem. 16, 6086–6102 [DOI] [PubMed] [Google Scholar]
- 19. Cosimelli B., Greco G., Ehlardo M., Novellino E., Da Settimo F., Taliani S., La Motta C., Bellandi M., Tuccinardi T., Martinelli A., Ciampi O., Trincavelli M. L., Martini C. (2008) J. Med. Chem. 51, 1764–1770 [DOI] [PubMed] [Google Scholar]
- 20. Fumagalli M., Brambilla R., D'Ambrosi N., Volonté C., Matteoli M., Verderio C., Abbracchio M. P. (2003) Glia 43, 218–230 [DOI] [PubMed] [Google Scholar]
- 21. Bianco F., Fumagalli M., Pravettoni E., D'Ambrosi N., Volonte C., Matteoli M., Abbracchio M. P., Verderio C. (2005) Brain Res. Brain Res. Rev. 48, 144–156 [DOI] [PubMed] [Google Scholar]
- 22. Capra V., Ravasi S., Accomazzo M. R., Citro S., Grimoldi M., Abbracchio M. P., Rovati G. E. (2005) J. Cell Sci. 118, 5625–5636 [DOI] [PubMed] [Google Scholar]
- 23. Ravni A., Vaudry D., Gerdin M. J., Eiden M. V., Falluel-Morel A., Gonzalez B. J., Vaudry H., Eiden L. E. (2008) Mol. Pharmacol. 73, 1688–1708 [DOI] [PMC free article] [PubMed] [Google Scholar]
- 24. Cai Y., Wu P., Ozen M., Yu Y., Wang J., Ittmann M., Liu M. (2006) Neuroscience 138, 133–148 [DOI] [PubMed] [Google Scholar]
- 25. Stachowiak E. K., Fang X., Myers J., Dunham S., Stachowiak M. K. (2003) J. Neurochem. 84, 1296–1312 [DOI] [PubMed] [Google Scholar]
- 26. Joubert L., Foucault I., Sagot Y., Bernasconi L., Duval F., Alliod C., Frossard M. J., Pescini Gobert R., Curchod M. L., Salvat C., Nichols A., Pouly S., Rommel C., Roach A., Hooft van Huijsduijnen R. (2010) J. Neurosci. Res. 88, 2546–2557 [DOI] [PubMed] [Google Scholar]
- 27. Cheng X., Wang Y., He Q., Qiu M., Whittemore S. R., Cao Q. (2007) Stem Cells 25, 3204–3214 [DOI] [PMC free article] [PubMed] [Google Scholar]
- 28. Andres-Barquin P. J., Hernandez M. C., Israel M. A. (1999) Exp. Cell Res. 247, 347–355 [DOI] [PubMed] [Google Scholar]
- 29. Walrafen P., Verdier F., Kadri Z., Chrétien S., Lacombe C., Mayeux P. (2005) Blood 105, 600–608 [DOI] [PubMed] [Google Scholar]