

Summary
The explosion of sequence information in bacteria makes developing high-throughput, cost-effective approaches to matching genes with phenotypes imperative. Using E. coli as proof of principle, we show that combining large-scale chemical genomics with quantitative fitness measurements provides a high-quality data set rich in discovery. Probing growth profiles of a mutant library in hundreds of conditions in parallel yielded > 10,000 phenotypes that allowed us to study gene essentiality, discover leads for gene function and drug action, and understand higher-order organization of the bacterial chromosome. We highlight new information derived from the study, including insights into a gene involved in multiple antibiotic resistance and the synergy between a broadly used combinatory antibiotic therapy, trimethoprim and sulfonamides. This data set, publicly available at http://ecoliwiki.net/tools/chemgen/, is a valuable resource for both the microbiological and bioinformatic communities, as it provides high-confidence associations between hundreds of annotated and uncharacterized genes as well as inferences about the mode of action of several poorly understood drugs.
Introduction
Before the physical basis of genes was understood, associating phenotypes with a heritable unit laid the foundation of modern genetics. Following discovery of the genetic code, linking a phenotype to the responsible gene remained the most expeditious way to unravel gene function. With the explosion of sequence information, the balance has shifted. We now have many genes of unknown function. To capitalize on the burgeoning sequence bank, it is imperative to develop high-throughput technologies that link genes to phenotypes and expedite discovery of gene function. This is particularly true for prokaryotes, which represent a major fraction of the sequenced genomes and are in the forefront of metagenomic efforts (Qin et al., 2010).
Chemical and environmental perturbations have traditionally linked phenotypes to genotypes through forward genetic screens, but reverse genetic approaches are being increasingly utilized (Barker et al., 2010). Phenotype microarrays utilize a high-resolution readout of cellular respiration to evaluate fitness of a strain in hundreds of conditions (Bochner, 2009). This approach is appropriate for studying a few strains, but is difficult to expand to genome-scale screens. In pooled growth competitions, thousands of strains are assayed in a single culture environment. Fitness values are derived from measuring strain abundance in a test relative to control condition (Giaever et al., 2004; Girgis et al., 2009; Hillenmeyer et al., 2008; Hoon et al., 2008; Lee et al., 2005; Pan et al., 2004; Parsons et al., 2006; Warner et al., 2010; Xu et al., 2007). These approaches are very efficient, but competition between strains in each condition makes it difficult to determine relative strain growth across conditions (Girgis et al., 2009), especially for strains that grow slowly even in the absence of perturbation (Lee et al., 2005). Arraying mutant strains on solid media allows independent evaluation of strain fitness, but has been used only for low-resolution measurements of entire libraries (Liu et al., 2010; Tamae et al., 2008) or for essential genes (Pathania et al., 2009). High-throughput genetic interaction studies, pioneered in yeast (Schuldiner et al., 2005; Tong et al., 2001), are complementary to chemical genomics approaches. Such analyses quantitatively measure colony growth of double mutants in high-density format on agar surfaces, and have led to numerous successes in identifying gene function and network organization (Beltrao et al., 2010). Similar methodology has been developed for E. coli (Butland et al., 2008; Typas et al., 2008).
We use E. coli to illustrate the power of applying the high-resolution quantitative fitness measurements of genetic interaction analysis to high-throughput phenotypic analysis of culturable microbes. “Phenomic profiling” provides a quantitative description of the response of all single gene deletions to physiologically relevant stresses and drug challenges. By profiling ~4000 genes in >300 perturbations, we identified thousands of phenotypes and a diverse suite of conditionally essential genes. This approach provides new insights into the chromosome organization, functional landscape and evolutionary trajectory of E. coli. It facilitates high confidence association of genes of unknown function to those of known function, as highlighted by discovery of the role of a gene involved in multiple antibiotic resistance in this manuscript and identification of two novel lipoproteins essential for peptidoglycan synthesis (Typas et al. Cell, 2010). Finally, the degree to which various gene deletions alter toxic drug effects has lead to powerful insights regarding drug mode-of-action (Kohanski et al., 2008) and we demonstrate that our analysis generates numerous leads concerning drug function.
Results and Discussion
Phenomic Profiling of E. coli K12 yields a robust, high-quality dataset
We determined quantitative growth scores for the Keio single-gene deletion library (Baba et al., 2006); essential gene hypomorphs [C-terminally tandem-affinity tagged (Butland et al., 2005) or specific alleles]; and a small RNA/small protein knockout library (Hobbs et al., 2010) in conditions representing the range of stresses E. coli encounters. Mutant strains arrayed in high-density on agar plates (1536 colonies/plate) were grown in 324 conditions covering 114 unique stresses (Figs. 1A & S1A, Table S1). Colony sizes were analyzed and converted to a drug-gene score using an approach developed for quantifying genetic interactions (see Experimental Procedures). More than half of the conditions were antibiotic/antimicrobial treatments (Fig. 1A). By using a sub-inhibitory concentration series that maximally inhibited growth of the wildtype (wt) strain ≤50%, we were able to search for specific drug-gene interactions (Fig. S1A), and reduce the ability of spontaneous suppressor mutations to overtake the colony. Two independently derived clones of each mutant strain were analyzed (for sRNA mutants, a single isolate was arrayed twice) and screens were performed at least twice, enabling scores to be based on 4-6 independent measurements. Correlation between replicate colony size measurements was very high (r=0.77, Fig. 1B). The final dataset (Table S2) was comprised of scores for the 3979 mutant strains passing quality control (e.g. proper normalized colony size distribution and replicate reproducibility; see Experimental Procedures). The entire dataset is available in an interactive, searchable format and as a flat file on the E. coli wiki website (at http://ecoliwiki.net/tools/chemgen/).
Figure 1. Phenomic Profiling of the enhanced Keio Collection yields a robust and rich dataset.

(A) Classification of the 324 stresses screened (left), and cellular targets of the antibiotic/antimicrobial/drug classes (right). (B) Heat map representation of scatter plot comparing normalized colony sizes in pixels of plate replicates 1 and 2 across the entire dataset. Bins indicate the square root of the number of replicate pairs within a 10 × 10 pixel window as depicted by color scale. Note that the vast majority of the replicates have highly correlated colony sizes. (C) Clustergram of fitness scores for 3979 mutant strains in response to all 324 conditions. Zoomed insets demonstrate co-clustering of conditions (x-axis) and genes (y-axis) for a common pathway (rfa cluster), and protein complexes encoded in the same operon (nuo) or in different operons (dsbA and dsbB). Gray boxes indicate missing data. (D) High correlation between a pair of phenotypic signatures is predictive of shared protein interaction and/or operon membership.
The entire matrix (3979 mutants × 324 conditions) was subjected to 2-D hierarchical clustering (Fig. 1C). Drugs with similar effects cluster on the X-axis; mutants that behaved similarly cluster on the Y-axis. Notably, concentrations of the same drug, drugs of the same family and/or similar conditions clustered together as did mutants of genes known to be part of the same operon, biological pathway and/or protein complex. Zoomed insets of our clustergram illustrate examples. Genes in the rfa operon (rfaG, rfaP, rfaQ, rfaB and rfaI), which encodes enzymes that synthesize the inner and outer lipopolysaccharide (LPS) core strongly cluster together with 3/4 genes responsible for the synthesis of one of the sugar building blocks, ADP-L glycero-β-D-manno heptose (rfaD, rfaE, lpcA). Importantly, clustering reflects their shared sensitivities to a concentration series of compounds known to perturb the envelope integrity of the cell, consistent with the role of LPS. dsbA and dsbB, encoded in different operons, also cluster. The DsbA/DsbB complex generates disulfide bridges in the periplasm.
The response of each mutant strain across all conditions is denoted as its “phenotypic signature”. High correlation between two phenotypic signatures is highly predictive of known indicators of functional connection between genes. Gene pairs with correlation coefficients (r) between 0.6 and 0.8 (p-value <10−34) are more than 100-fold enriched for genes sharing common operon membership, and 150-fold enriched for genes with known protein interactions determined from low-throughput experiments (www.ecocyc.org, Fig. 1D). This benchmarking analysis indicates that our phenomics dataset is biologically meaningful. Correlated phenotypic signatures also reproduce connections between curated biological pathways (Fig. S1B). For example, electron transfer components cluster tightly (e.g. nuo genes encoding NADH dehydrogenase I complex; Fig. 1C). Their clustering reflects high sensitivity to membrane-perturbing stresses including detergents, dyes and metals, and increased resistance to aminoglycosides, in agreement with early studies that illustrate decreased aminoglycoside uptake in the absence of a fully functional electron transport chain (Girgis et al., 2009; Taber et al., 1987). All three examples described in Fig. 1C are consistent with the expectation that highly correlated phenotypic signatures are biologically meaningful (r≥ 0.6 -0.8).
Phenomic profiling defines Responsive and Conditionally-Essential Genes
A central goal of this study was to systematically evaluate the impact of every gene deletion on E. coli fitness in diverse environments, as few gene deletions in E. coli have robust reported growth phenotypes and only 8% of the genes are essential in rich media (Baba et al., 2006; Yamamoto et al., 2009). We used a statistical method to define a reliable phenotype. Briefly, we standardized the interquartile range of the distribution of scores for each screen and then determined the probability that each condition-gene interaction represented a true phenotype using a normal cumulative distribution function (see Experimental Procedures). Using a 5% probability that these phenotypes arose by chance as a cut-off (false discovery rate (FDR) ≤5%), 49% of all strains tested (1957/3979 strains; Fig. 2A) had one or more phenotypes. We refer to these genes as the “responsive genome”. This “responsive genome” is a work in progress, as it is limited to genes whose removal causes growth phenotypes in response to the stresses tested. Expanding the stresses tested and/or the readout (e.g. motility) will certainly increase this number (Girgis et al., 2007). A cumulative plot of the number of individual phenotypes per strain shows that very few genes have many phenotypes. Multi-Stress Responsive (MSR) strains (≥30 phenotypes; Table S3) participate in many cellular processes, suggesting that our stresses encompassed diverse cellular challenges (Fig. 2B). With a stringent cut-off of 5% FDR, the maximum number of phenotypes from a single screen was 173 (~4% strains; Fig. S2A), and the total number of phenotypes (13497) represent ~1% of all condition-gene pairs tested. Overall, 80% of the phenotypes were negative (gene deletion more sensitive) and 20% positive (gene deletion more resistant), consistent with recent genetic interaction analyses in S. cerevisiae (Fiedler et al., 2009) and S. pombe (Roguev et al., 2008). This suggests that removal of a gene product is more likely to decrease than enhance resistance to stress (Fig. S2B). In summary, our analysis captured numerous highly specific condition-gene responses. Clearly, this dataset can be used to assign more phenotypes at a lower confidence level. Indeed, a recent chemical genomics dataset in S. cerevisiae reported phenotypes for more than 95% of gene deletions tested, many stemming from a handful of severe stresses (Hillenmeyer et al., 2008).
Figure 2. Identification of responsive and conditionally-essential genes.

(A) Using a 5% false discovery rate (FDR), 49% of strains tested had at least one phenotype (open circle on the red line). As the FDR is relaxed, more phenotypes are identified (red line). At 5% FDR, some strains have several phenotypes (black) and very few (2.3%; 94 strains) have 30 or more phenotypes (green, Multi-Stress Responsive (MSR) genes). (B) MSR genes participate in a wide variety of cellular processes, particularly those related to metabolism and the cell envelope. Genes were manually curated to COG-based functions; each gene was allowed to belong only to a single function. (C) 196 genes are conditionally-essential (CE) in this study. Of these, roughly half have been previously described as CE due to auxotrophy. Note that some auxotrophic genes also display a no growth phenotype in at least one rich medium condition and are classified jointly as auxotroph and rich media CE. (D) Rich media CE gene products are enriched in the outer cell envelope (periplasm and outer membrane) relative to Keio essential genes (p=0.00026), highlighting the importance of this compartment in tolerating stress. The cytoplasmic gene category is not displayed here, but is not enriched for CE gene products.
Conditionally essential (CE) genes are essential for growth in a particular condition. Deletions of such genes show very small colony sizes and high confidence negative scores in particular conditions (see Experimental Procedures). We identified 197 CE genes, comprised of auxotrophs, which exhibit no growth in minimal media, and rich-media CE genes, which exhibit no growth in at least one rich media-based stress (Table S4). Importantly, our dataset had 70% overlap with a previous study of Keio Collection auxotrophs (Fig 2C, (Joyce et al., 2006) despite significant experimental differences (e.g. growth in liquid vs. solid media). Many of the remaining 30% were extremely sick, but above the stringent threshold we used to define no growth. We also identified 23 additional auxotrophs specific to alternative carbon/nitrogen sources not tested in the Joyce et al. study.
Genes essential for survival in natural environments are likely to extend beyond those required for laboratory growth, and could be targets for new antimicrobials (D’Elia et al., 2009). The 116 rich-media CE genes we identified (Fig. 2C) result from physiologically relevant stresses, and increase the current number of essential genes by roughly 30%. Interestingly, many of these gene products are located in the outer cell envelope (Fig 2D), a selective permeability barrier for gram-negative bacteria that is severely underrepresented for known essential genes (Fig. 2D). Many of the stresses generating CE phenotypes are part of the natural environment of E. coli, e.g. bile salts (Table S5), indicating that these genes are likely indispensable for E. coli to survive in vivo. Similarly, using the largest metagenomic dataset to date, Qin et al. reported that envelope-specific functions, such as adhesion, were commonly required for life in the gut (Qin et al., 2010).
Phenomic profiling helps assign function to uncharacterized genes
A key motivation for our study was to provide phenotypes for mutants of genes without functional annotation. Using a recently assembled compendium of such “orphan genes” in E. coli (Hu et al., 2009), we find that the fraction of mutant orphan genes with phenotypes is close to that of annotated genes (Fig. 3A), but the former tend to have fewer phenotypes, indicating the power of phenomic analysis for identifying their phenotypes. Importantly, the phenotypic profiles of >25% of all orphan genes correlate strongly with those of annotated genes (r ≥ 0.5; Fig. 3B & Table S6), providing high confidence leads (p-value <10−22) for discovery of their function. As these orphans are tied to a wide variety of cellular processes (Fig. 3C), the dataset will be of broad utility.
Figure 3. Phenomic profiling identifies phenotypes for orphan gene mutants.

(A) Cumulative distribution of phenotypes indicating the fraction of gene mutants in each class having at least the number of phenotypes shown on the X-axis. The plot reveals that orphan gene mutants have phenotypes, but tend to have fewer phenotypes than annotated gene mutants. The insert quantifies phenotype deficit of orphan mutants. (B) Cumulative distribution of highly correlated pairs identifies many orphan genes that correlate highly to an annotated gene, providing high confidence clues to the function of the orphan gene. Values shown above each pair of bars are the p-values associated with pairwise correlation of any two strains at the indicated correlation coefficients. (C) High confidence correlations between orphans and annotated genes (r≥ 0.5) provide leads related to many different cellular functions. Procedure for functional assignment is described in Fig. 2. Note that several “annotated genes” were classified as genes of “unknown function” or “general function prediction only” after manual curation. (D) Annotated genes responsible for many phenotypes tend to be broadly conserved, while the most responsive orphan genes tend to be restricted to γ-proteobacteria.
A small fraction of orphan gene knockouts have many phenotypes. Whereas annotated genes responsible for many phenotypes are broadly distributed among bacteria, the most responsive orphans tend to be narrowly distributed (Fig. 3D). This result suggests that evolutionary conservation is not a reliable indicator of the importance of an orphan gene to the organism, and that annotating them solely by homology has limitations. Such orphans may have evolved to fulfill an important but specialized function required by the niche of the organism. In support of this idea, a multi-responsive orphan identified in this study (lpoB) is restricted to enterobacteria and regulates peptidoglycan synthesis, a conserved process ubiquitous among bacteria (Typas et al.; Cell, 2010).
Using phenotypic signatures to identify gene function
Both correlated phenotypic signatures (Fig. 1C&D; Typas et al.; Cell, 2010) and anticorrelated phenotypic signatures have functional significance. For example, the phenotypic signatures of deletions of a transcriptional repressor and important target genes are likely to be anticorrelated. We find that marR− and marB− were highly anticorrelated with acrB−, whereas marR− and marB− were highly correlated (Fig. 4A). marB is a gene of unknown function in the multiple antibiotic resistance operon (marRAB), which also includes the operon repressor, marR, and its activator, marA. MarA also activates genes involved in antibiotic resistance, most importantly acrAB, encoding the major antibiotic efflux pump in E. coli (Fig. 4B; (Martin and Rosner, 2002). We explored whether MarB, like MarR, repressed MarA. Because of the inherent problems of high-throughput collections (suppressors, gene duplications, cross-contamination), we always apply stringent quality control procedures to any follow-up investigations including PCR-validation of Keio isolates, and verification that retransduced strains maintain their phenotype. As mar is a hotspot for adaptive mutations, we also sequenced the entire operon and promoter region of single deletions and the double mutants we constructed.
Figure 4. A function for marB.

(A) marR− and marB− phenotypic signatures are highly correlated with each other, and are highly anticorrelated with that of acrB− (top). The bottom graph positions these correlations in a histogram showing all pair-wise correlation coefficients between the 3979 mutants. (B) Schematic of the E. coli multiple antibiotic resistance (mar) operon. marB is a gene of unknown function, but our results suggest it encodes a protein that inhibits MarA. (C) RT-PCR analysis shows that marA transcription is derepressed in marB− cells. Derepression is independent of and additive with that of marR−.
Deletion of either marB or marR resulted in higher MarA levels, and the double marRB mutant showed additive effects on MarA transcript level (Fig. 4C) and protein level (data not shown). These effects were observed in both Kan-marked and clean deletions (Kan cassette excised, leaving an 82nt scar). The ΔmarR strain exhibits ~2X more increase in MarA transcript levels than marR::kan (data not shown), arguing for a small polar effect of the cassette. Both marB::kan and ΔmarB exhibit the same 2-fold increase in MarA levels (data not shown). These data suggest that MarB represses MarA independently of MarR. MarB does not have the signature of a DNA-binding protein, suggesting it acts post-transcriptionally. MarA level is controlled by the Lon protease (Griffith et al., 2004), but lon− and marB− effects are additive, indicating that MarB does not function through Lon (data not shown). MarA has been proposed to scan for activation sites while bound to RNA polymerase; by direct binding to either partner, MarB could disrupt complex formation. Aternatively, MarB may function in the periplasm. As MarB has a predicted periplasmic signal sequence, it could titrate an activating ligand for mar (e.g. salicylate).
Although mar is highly studied (~200 primary publications; Pubmed), our screen provided the first lead for MarB function. MarA targets approximately 40 genes, many of which are also co-regulated by the SoxS and Rob activators, with similar DNA-binding motifs as MarA (Martin et al., 2008; Martin and Rosner, 2002). The rules of engagement are poorly understood, but each activator responds to different environmental cues and overexpression of each leads to distinct phenotypes (Warner and Levy, 2010). It is likely that tight control of each activator impacts on the final gene expression output, which is crucial for cellular proliferation. MarB may be an important player in fine-tuning the expression of MarA, especially since it is a conserved member of the mar operon, which has only recently emerged in selected enterobacteria. Strong evidence for the importance of mar operon regulation in these organisms is that mar is a hotspot for mutations conferring higher drug resistance in E. coli (Nicoloff et al., 2007; Nicoloff et al., 2006).
Phenomic profiling reveals metabolic network behaviors under anti-folate drug stress
Tetrahydrofolate (THF) and its methyl/formylated derivatives are key molecules in all kingdoms of life for one-carbon metabolism. THF is used to synthesize glycine, methionine, purines and dTTP, in a process that leads to recycling of the THF species back to THF or dihydrofolate (DHF) (Fig. 5A). The bacterial THF biosynthesis pathway is targeted by two drugs: Sulfonamides (Sulfa) target FolP, and Trimethoprim (TMP) targets FolA (Fig. 5A). Dual inhibition by Sulfa and TMP is strongly synergistic, and therefore these drugs are almost exclusively administered in combination for treatment of ear, urinary tract and bronchial infections. Despite extensive clinical use and years of laboratory investigation, we lack a complete mechanistic understanding of why these drugs are strongly synergistic. A network feature identified by phenomic profiling could contribute to synergy.
Figure 5. A new network feature contributing to anti-folate drug synergy.

(A) Schematic of the E. coli tetrahydrofolate (THF) biosynthesis pathway and the enzymatic steps inhibited by Sulfa and TMP. (B) Clustergram of genes that respond to Sulfa, TMP, or the combination. Zoomed image indicates that gcv mutants are sensitive to Sulfa, glyA− is sensitive to TMP, and that these four mutants exhibit essentially wildtype growth in response to the drug combination. (C) glyA− and gcvP− are a synthetic lethal pair. Image of a plate mating between the donor Hfr gcvP::cat and 24 kanR recipients (arrayed in boxes of 8×8 colonies), grown on kanamycin/chloramphenicol medium to select for double mutant strains; position of the glyA::kan and gcvP::kan recipients is highlighted. (D) Liquid culture experiments verify growth phenotypes on agar plates shown in Fig.5B. The deviation of the observed from the expected value for the TMP/SMT combination denotes the degree of synergy of the two drugs, which is lower for glyA− and gcvP− cells compared to wild-type cells. Concentrations shown for TMP and SMT are in μg/mL. (E) Quantification of synergy in E. coli and S. pneumoniae, which lacks the branched pathway for generating 5,10-mTHF present in E. coli. Comparisons were performed using single drug concentrations giving equivalent inhibition of both organisms. S. pneumoniae has reduced synergy compared to E. coli.
We find that the two drug classes have major phenotypic differences. Sulfa and TMP treatments are highly correlated within their class (r=0.57 for Sulfa; 0.67 for TMP), but poorly correlated with each other (r=0.15 +/− 0.04), just slightly more than the correlation observed between all screens (r=0.025 +/− 0.12). Thus, subinhibitory TMP and Sulfa treatments have fundamentally different effects on the cell, even though both partially block THF biosynthesis. Importantly, removing enzymes acting directly downstream of THF production resulted in opposite drug sensitivities: the serine hydroxymethyltransferase mutant (glyA::kan) was sensitive only to TMP; conversely, glycine cleavage (GCV) mutants (gcvP::kan, gcvH::kan, gcvT::kan) were sensitive only to Sulfa (Fig 5B). The mutant results were reproduced in liquid culture (Fig. 5D), where glyA− TMP sensitivity is manifested as a growth rate phenotype (left panel), and gcvP− sulfamethizole (SMT) sensitivity is registered as a low stationary phase density (right panel).
GlyA and GCV lie on opposite sides of a branched pathway that converts THF to 5,10-methylene THF (5,10-mTHF; Fig 5A). As glyA and gcv mutants exhibit synthetic lethality, they are the only routes to production of this essential metabolite (Fig. 5C). A simple explanation for the differential responses of glyA− and gcvP− is that 5,10-mTHF is predominantly produced via different branches under each drug treatment. A corollary is that combination drug treatment inhibits both branches, resulting in synergistic limitation for 5,10-mTHF, before the pools of THF are depleted. In support of this idea, despite the increased sensitivity of glyA− and gcvP− to single drugs, these strains grew no more poorly than wt under the drug combination (Fig. 5D). Thus, genetically eliminating either branch of the pathway reduced but did not eliminate synergy. The downstream biosynthetic reactions are also differentially affected by TMP and Sulfa (Fig. S3A), and we are currently testing whether they partially account for the residual synergy. Streptococcus pneumoniae lacks the GCV system and exhibits significantly less drug synergy than E. coli across different growth conditions (Fig. 5E & data not shown). We performed our comparison using concentrations of TMP and SMT that caused the same relative growth defect in each species (Fig. 5E). These data together support the hypothesis that simultaneous inhibition of the branched pathway for production of 5,10-mTHF contributes to the observed anti-folate synergy in E. coli.
Our data do not indicate whether differential effects of TMP and Sulfa on GlyA and GCV result from differential inhibition of expression or activity, or the intrinsic properties of each enzyme. We favor the idea that differential metabolite accumulation and subsequent feed-forward enzymatic regulation make a contribution to the distinct cellular responses to these two drugs. Recent metabolomic flux analyses indicate that high doses of TMP lead to accumulation and depletion of select metabolites, as well as to protein-level regulation of portions of the network (Kwon et al., 2010; Kwon et al., 2008). Although a comparable analysis has not been performed for Sulfa drugs, deletion of the predicted 5-formyl-THF cycloligase, ygfA, which likely degrades 5-formyl-THF (Jeanguenin et al., 2010), clusters tightly with the gcv mutants, and exhibits sensitivity only to Sulfa drugs (Fig. S3A). That 5-formyl-THF degradation is critical only under Sulfa stress suggests differential accumulation (or requirement) of THF species under Sulfa and TMP treatments. 5-formyl-THF is a known inhibitor of several enzymes in the THF network of other organisms (Field et al., 2006; Stover and Schirch, 1993), and could act as an effective protein-level regulator. Similarly, a strain lacking a predicted alanine racemase, yggS, is sensitive only to Sulfa; D-alanine is known to inactivate GlyA (Schirch et al., 1985), and yggS− and glyA− form a synthetic lethal pair (Fig. S3B). Thus, the different cellular responses to these two drugs may be due in part to metabolite-based enzymatic regulation. An extension is that the synergy of combination therapy could rest primarily on complementary inhibition of different one-carbon biosynthesis reactions, and therefore recycling of THFs. This model would allow for synergy even with the expected additive limitation of THF production.
In summary, our results illustrate the power of phenomic profiling to yield insights into drug action and the ability of a networks view to provide new paradigms for analysis of drug interaction mechanisms, which can facilitate hypothesis-driven research on drug interactions (Bollenbach et al., 2009). This type of analysis may be generally useful in predicting drug synergies, and in explaining variable drug-drug interactions across species.
Phenomic profiling gives insights into genomic organization
The E. coli genome is encoded on a single, circular chromosome, with a single origin of replication, oriC. Essential genes are biased to the plus (+) strand, where transcription proceeds in the same direction as DNA replication. This may avert head-on collisions between RNA and DNA polymerases that would result in aborted transcripts, truncated, or frame-shifted proteins (Rocha and Danchin, 2003). Here we show that responsive and CE genes, which are important for optimal growth of the organism, also show + strand bias (Fig. 6A). Indeed, the weighted responsive genome (responsive genes weighted by number of phenotypes identified) is heavily biased to the + strand, indicating great selective pressure to place genes important for rapid growth on the + strand. Conversely, the non-responsive genome is biased to the minus (−) strand. As our approaches expand to incorporate additional phenotypic readouts more important for cells with reduced division and DNA replication (e.g. biofilm formation), the + strand bias of responsive genes will presumably be reduced.
Figure 6. Phenomic profiling generates insights into genome organization.
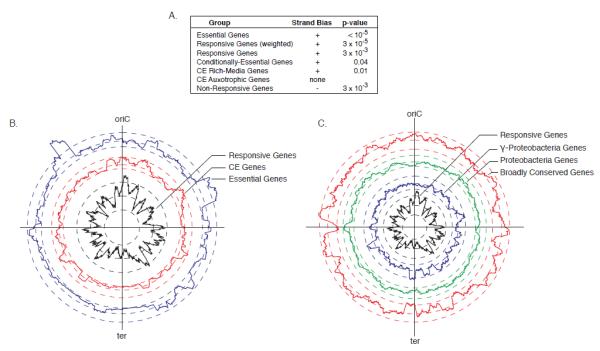
(A) Essential and responsive genes are biased to the plus strand of DNA (transcription direction coincident with replication) and the non-responsive genes are biased to the minus strand of DNA. (B-C) For each panel, circular plots depict gene position, adjusting coordinates so that the chromosome starts at the origin of replication (oriC = 0 bp); the terminus region (ter) is opposite the oriC. Each trace represents spatial enrichment for the variable plotted based on a 100kb sliding window. Three dashed lines of the same color accompany each trace indicating the minimum permutation threshold, the baseline representing zero enrichment, and the maximum permutation threshold (inside to outside). Permutation thresholds are the result of 1000 randomizations of gene class assignments (see Experimental Procedures), and indicate significant negative and positive spatial enrichment at a p-value of 0.05. (B) Responsive and CE genes are concentrated around the oriC, and scarce around the terminus. (C) The terminus is positively enriched for genes restricted to the γ-proteobacteria, and negatively enriched for broadly conserved genes.
The chromosome is massively compacted in the cell to create the nucleoid, which is thought to contribute significantly to the organization of gene expression (Travers and Muskhelishvili, 2005; Vora et al., 2009). Chromosomal loci have spatial addresses in the cell, corresponding closely to their chromosomal position (Toro and Shapiro, 2010). Additionally, highly expressed genes associated with transcription and translation are located near the origin of replication (oriC), presumably to benefit from the “gene dosage” effect created when rapidly growing cells initiate multiple rounds of DNA replication per division (Couturier and Rocha, 2006). Projecting the spatial distribution of the responsive genes onto the circular chromosome (Fig. 6B, black trace) provides us with a snapshot of the E. coli genome from a functional perspective. This projection is based on a 100kb sliding window and therefore captures organization above the operon level (Fig. S4A; Experimental Procedures). A pattern of alternating peaks and valleys is clearly evident, indicating that responsive genes cluster spatially into large chromosomal regions separated by regions generally devoid of responsive genes. “Valleys” are comprised of spatially separated operons often transcribed from different strands, indicating that low responsiveness is a regional characteristic rather than an artifact due to large non-responsive operons. Our finding of clustering above the operon level is in accord with other studies showing that gene expression is broadly correlated across certain regions of the chromosome (Carpentier et al., 2005; Jeong et al., 2004).
The responsive genome is most enriched around oriC, which has the highest concentration of responsive genes (Fig. 6B, black trace). This area is also enriched for the most responsive genes (Fig. S4B), and for conditionally essential (CE) genes (Fig. 6B, red trace), providing strong support for the idea that the E. coli chromosome tends to store genes of high functional importance near the oriC. In contrast, the terminus region is relatively devoid of responsive genes (Fig 6B, black trace), has a paucity of broadly conserved genes (Fig 6C, red trace) and a corresponding enrichment for genes restricted to γ-proteobacteria (Fig 6C, blue trace). We postulate that the terminus region contains newly acquired genes that have yet to fully integrate into the cellular network, and tend to lack phenotypes. This could enable cells to avoid unnecessarily high expression of such genes as a consequence of the gene-dosage effect. Should this result prove true across bacterial species, it could point to a general organizing principle of circular chromosomes.
Phenomic Profiling Describes Drug Action
“Drug-centric” analyses are more complex than “gene-centric” analyses. Whereas genes mostly participate in a single biological process, many parameters are required to describe drug action: uptake, primary/secondary targets, efflux. Therefore, pairwise relationships between drugs are more complex than those between genes. For example, two drugs may cluster based on drug uptake, even though their primary targets differ. In addition, drug signatures are an order of magnitude larger than gene signatures (3979 vs. 324). To reduce the complexity of drug signatures, we calculated Drug-Gene Ontology (GO) scores, which represent the probability that a given GO group specifically interacts with a given drug (i.e. number of phenotypes associated with genes in the GO group vs. across the entire dataset). We used these Drug-GO scores to explore drug mode-of-action through a network-based clustering strategy (see Experimental Procedures). The position of drugs in the network (Fig. 7A) is based both on the magnitude of their Drug-Gene Ontology (GO) scores (gray) and on Drug-Drug correlations (yellow). Of the 719 significant Drug-GO interactions (p-value ≤ 10−3), which include 64 drugs and 218 GO groups, 657 were negative and only 62 were positive. Thus, disrupting a linked biological process was very likely to increase drug sensitivity (Table S7). Drug-Drug correlations increased the resolution of the network and captured drug similarities that escaped the Drug-GO analysis.
Figure 7. Network view reveals new insights into drug action.

(A) Colored nodes represent all drugs profiled in this study found to have significant interactions with Gene Ontology (GO) biological process groups (gray nodes). Connections between nodes represent significant Drug-GO interactions (p-value ≤10−3, gray) or high Drug-Drug correlation (r≥0.32, p-value ≤10−97, yellow). Drug node size is based on the number of connections associated with that node, i.e. larger nodes have more Drug-GO interactions. Spatial clustering is driven by the p-values of Drug-GO interactions and Drug-Drug correlations, resulting in drugs with similar cellular action lying near each other in the network. Drugs with multiple, unknown, or poorly defined targets are shown in dark blue. (B) Zoomed view of subnetwork shadowed by light blue box in (A). All four quinolones screened (orange) interact negatively with xseAB (exonuclease VII) and are the only drugs that require the exonuclease, p-value=10−6. NTF is found to activate the SOS response, and create lesions requiring nucleotide-excision repair (Fig S5B).
We found that drugs with the same cellular target tend to cluster. For example, drugs targeting DNA (orange) fall in the lower right, those targeting THF-biosynthesis (light green) fall on the bottom edge and those targeting peptidoglycan (PG; purple) predominantly cluster in the upper left. Interestingly, β-lactams cover the center of the PG cluster, whereas drugs targeting other steps of PG synthesis are located at the periphery. The correlation coefficients between β-lactams reveal that the similarity of their phenotypic signatures is related to their respective primary target Penicillin Binding Proteins (Fig. S5A). Interestingly, known synergistic double drug combinations (TMP/sulfonamides and mecillinam/cefsulodin) occupy spaces distinct from either individual drug, arguing that the combination elicits a different cellular response from the individual drugs. It will be interesting to determine whether this holds true for antagonistic or neutral interactions or whether these combinations elicit responses closer to one or both drugs.
Importantly, specific Drug-GO interactions suggest hypotheses for mechanism of action even for well-studied drugs. Quinolones inhibit DNA gyrase by trapping it as a quinolone adduct, whose mechanism of resolution is poorly understood (Drlica et al., 2008). One GO category, “cellular DNA catabolic process” (xseAB) selectively and specifically (p-value=10−6) interacted negatively with all four quinolones screened (Fig 7B & S5B), expanding on a previous report of xseAB mutant sensitivity to fluoroquinolones (Tamae et al., 2008). We suggest that XseAB (exonuclease VII) is the enzyme that cleaves quinolone-bound DNA gyrase from the DNA to allow repair to proceed, a possibility we are currently exploring.
Our drug network also provides clues for the mode of action of poorly described drugs, and, conversely suggests that additional factors are required to explain the action of other drugs. Nitrofurantoin (NTF; Fig. 7B) is reported to have a multi-faceted impact on cells (McOsker and Fitzpatrick, 1994; Tu and McCalla, 1975), but our data suggests its cytotoxic effects reflect DNA damage, as it causes lesions requiring nucleotide-excision repair (NER) and activates the SOS response. NTF is the only DNA-targeting drug requiring NER, but not double-strand break repair, suggesting that its primary toxic lesion is associated with the replication fork (Fig. S5B). Additionally, our network analysis validates the idea that indolicidin, a neutrophil antimicrobial peptide, mediates its effects by compromising the inner membrane permeability of E. coli in a manner similar to the proton motive force uncoupler, CCCP (Falla et al., 1996). Finally, phleomycin and bleomycin do not cluster with DNA response drugs, suggesting they have broader cellular impact (Hecht, 2000; Yeh et al., 2006), from inducing DNA scissions (Giloni et al., 1981). These insights suggest that this phenomic dataset is a rich source for discovery of drug function and interrelationships.
Perspectives
To keep pace with exploding sequence information, cost-effective, high-throughput phenotyping technologies must be developed. Here we show that phenomic profiling in E. coli fulfills this goal. Our dataset is of great utility in identifying the function of orphan genes. Three cases (marB, lpoA, lpoB) were investigated here or in a study based on this dataset (Typas et al., Cell, 2010), and we are actively pursuing functional discovery of numerous (>20) orphan genes, as well as annotated genes with previously unsuspected roles in collaboration with others. Since >25% of the orphan genes are highly correlated to an annotated gene (r≥ 0.5), this dataset provides a rapid method for function discovery.
An important finding is that the most responsive orphan genes tend to be narrowly distributed among bacteria. Interestingly, our results mirror initial observations from human microbiome studies. These studies found that: a) roughly half of the functions encoded in the minimal gut metagenome (ubiquitously present in all 124 individuals screened) are both unknown and of limited evolutionary conservation (Qin et al., 2010); b) across 4 pan-genome species analyzed, the vast majority of non-common genes were of either unknown function (~70%) or unique family members of functions that were part of the core gene set (Nelson et al., 2010). The latter are probably species-specific additions to conserved biological processes of the pan-genome. Together these studies argue that when computational methods based on gene conservation fail, large-scale phenomic analyses can be a second tier for assigning function. To make this approach a reality, low cost methods for developing deletion libraries must be developed (Goodman et al., 2009). Single-gene deletion ordered libraries are currently available for only a handful of organisms [(Cameron et al., 2008; de Berardinis et al., 2008; Gallagher et al., 2007; Goodman et al., 2009; Kim et al., 2010; Liu et al., 2008; Noble et al., 2010) and references in (Barker et al., 2010)], but advances in transposon mutagenesis make it feasible to create ordered mutant libraries in most organisms. In E. coli, expansion of this work will rest on the ability to assess additional phenotypes through deeper exploration of phenotypic space. The greatest potential resides at the intersection of screening more diverse stresses and incorporating additional cellular readouts. Colorimetric readouts would enable measurement of transcriptional activity or biofilm formation on solid agar surfaces, and represent an immediate potential advance for phenomic profiling. High-throughput microscopy would provide a new avenue for such approaches (Werner et al., 2009).
Our dataset provides information on a substantial collection of antibiotics/antimicrobial compounds that cover a broad spectrum of drug targets, structural classes and drug generations, providing a platform for future studies focused on natural products or antimicrobials with unknown targets. Our dataset can also provide a platform for studying the mechanism behind drug interactions (Yeh et al., 2009), as shown here for the case of sulfonamides and TMP. Understanding the mechanism underlying known drug interactions may help to predict novel interactions and manipulate existing drug combinations to increase their effectiveness in the clinic.
In summary, we have generated a valuable resource for microbiologists studying a wide range of biology, and demonstrated the numerous and diverse applications of this dataset to infer information both on gene and drug function. As the most comprehensive prokaryotic chemical genomic study to date (3979 strains × 324 conditions), our dataset will serve as a base for future studies that aim to increase information and/or resolution on both the gene and drug fronts. We hope that the usefulness of this resource will trigger analogous studies in other organisms, bringing us a step nearer to closing the gene sequence-function gap.
Experimental procedures
Experimental procedures are partially elaborated in the text and figure legends, and are fully explicated in supplementary material.
Supplementary Material
Acknowledgements
We thank R. Kishony, J. Weissman, A. Hochschild and RG Martin for critically reading this manuscript; J. Hu and P. Thomas for hosting these data on E. coli Wiki; C. Raetz for CHIR-090 and M. Gottesman for Bicyclomycin; H. Mori for the Keio Collection; G. Storz for sharing the sRNA deletion library prior to publication; J.Greenblatt and A. Emili for SPA-tagged alleles; W. Margolin, R. Misra, T. Silhavy and B. Palsson for mutants; T. Baker and R. Sauer for controllable degradation plasmids. This work was supported by NIH R01 GM085697 & ARRA GM085697-01S1 to CAG and NJK; NIH R01 GM036278 to CAG, NIH K99GM092984 to AT, NIH AI060744 to MEW, and NIH GM078338 to SS; NIH F31 DE020206-01 and NIH T32 DE007306 (RJN support); European Molecular Biology Organization long-term fellowship (to AT); and Human Frontier Science Program Long-Term Postdoctoral Fellowship (to PB).
Footnotes
Publisher's Disclaimer: This is a PDF file of an unedited manuscript that has been accepted for publication. As a service to our customers we are providing this early version of the manuscript. The manuscript will undergo copyediting, typesetting, and review of the resulting proof before it is published in its final citable form. Please note that during the production process errors may be discovered which could affect the content, and all legal disclaimers that apply to the journal pertain.
References
- Baba T, Ara T, Hasegawa M, Takai Y, Okumura Y, Baba M, Datsenko KA, Tomita M, Wanner BL, Mori H. Construction of Escherichia coli K-12 in-frame, single-gene knockout mutants: the Keio collection. Mol Syst Biol. 2006;2:0008. doi: 10.1038/msb4100050. 2006. [DOI] [PMC free article] [PubMed] [Google Scholar]
- Barker CA, Farha MA, Brown ED. Chemical genomic approaches to study model microbes. Chem Biol. 2010;17:624–632. doi: 10.1016/j.chembiol.2010.05.010. [DOI] [PubMed] [Google Scholar]
- Beltrao P, Cagney G, Krogan NJ. Quantitative genetic interactions reveal biological modularity. Cell. 2010;141:739–745. doi: 10.1016/j.cell.2010.05.019. [DOI] [PMC free article] [PubMed] [Google Scholar]
- Bochner BR. Global phenotypic characterization of bacteria. FEMS Microbiol Rev. 2009;33:191–205. doi: 10.1111/j.1574-6976.2008.00149.x. [DOI] [PMC free article] [PubMed] [Google Scholar]
- Bollenbach T, Quan S, Chait R, Kishony R. Nonoptimal microbial response to antibiotics underlies suppressive drug interactions. Cell. 2009;139:707–718. doi: 10.1016/j.cell.2009.10.025. [DOI] [PMC free article] [PubMed] [Google Scholar]
- Butland G, Babu M, Diaz-Mejia JJ, Bohdana F, Phanse S, Gold B, Yang W, Li J, Gagarinova AG, Pogoutse O, et al. eSGA: E. coli synthetic genetic array analysis. Nat Methods. 2008;5:789–795. doi: 10.1038/nmeth.1239. [DOI] [PubMed] [Google Scholar]
- Butland G, Peregrin-Alvarez JM, Li J, Yang W, Yang X, Canadien V, Starostine A, Richards D, Beattie B, Krogan N, et al. Interaction network containing conserved and essential protein complexes in Escherichia coli. Nature. 2005;433:531–537. doi: 10.1038/nature03239. [DOI] [PubMed] [Google Scholar]
- Cameron DE, Urbach JM, Mekalanos JJ. A defined transposon mutant library and its use in identifying motility genes in Vibrio cholerae. Proc Natl Acad Sci U S A. 2008;105:8736–8741. doi: 10.1073/pnas.0803281105. [DOI] [PMC free article] [PubMed] [Google Scholar]
- Carpentier AS, Torresani B, Grossmann A, Henaut A. Decoding the nucleoid organisation of Bacillus subtilis and Escherichia coli through gene expression data. BMC Genomics. 2005;6:84. doi: 10.1186/1471-2164-6-84. [DOI] [PMC free article] [PubMed] [Google Scholar]
- Couturier E, Rocha EP. Replication-associated gene dosage effects shape the genomes of fast-growing bacteria but only for transcription and translation genes. Mol Microbiol. 2006;59:1506–1518. doi: 10.1111/j.1365-2958.2006.05046.x. [DOI] [PubMed] [Google Scholar]
- D’Elia MA, Pereira MP, Brown ED. Are essential genes really essential? Trends Microbiol. 2009;17:433–438. doi: 10.1016/j.tim.2009.08.005. [DOI] [PubMed] [Google Scholar]
- de Berardinis V, Vallenet D, Castelli V, Besnard M, Pinet A, Cruaud C, Samair S, Lechaplais C, Gyapay G, Richez C, et al. A complete collection of single-gene deletion mutants of Acinetobacter baylyi ADP1. Mol Syst Biol. 2008;4:174. doi: 10.1038/msb.2008.10. [DOI] [PMC free article] [PubMed] [Google Scholar]
- Drlica K, Malik M, Kerns RJ, Zhao X. Quinolone-mediated bacterial death. Antimicrob Agents Chemother. 2008;52:385–392. doi: 10.1128/AAC.01617-06. [DOI] [PMC free article] [PubMed] [Google Scholar]
- Falla TJ, Karunaratne DN, Hancock RE. Mode of action of the antimicrobial peptide indolicidin. J Biol Chem. 1996;271:19298–19303. doi: 10.1074/jbc.271.32.19298. [DOI] [PubMed] [Google Scholar]
- Fiedler D, Braberg H, Mehta M, Chechik G, Cagney G, Mukherjee P, Silva AC, Shales M, Collins SR, van Wageningen S, et al. Functional organization of the S. cerevisiae phosphorylation network. Cell. 2009;136:952–963. doi: 10.1016/j.cell.2008.12.039. [DOI] [PMC free article] [PubMed] [Google Scholar]
- Field MS, Szebenyi DM, Stover PJ. Regulation of de novo purine biosynthesis by methenyltetrahydrofolate synthetase in neuroblastoma. J Biol Chem. 2006;281:4215–4221. doi: 10.1074/jbc.M510624200. [DOI] [PubMed] [Google Scholar]
- Gallagher LA, Ramage E, Jacobs MA, Kaul R, Brittnacher M, Manoil C. A comprehensive transposon mutant library of Francisella novicida, a bioweapon surrogate. Proc Natl Acad Sci U S A. 2007;104:1009–1014. doi: 10.1073/pnas.0606713104. [DOI] [PMC free article] [PubMed] [Google Scholar]
- Giaever G, Flaherty P, Kumm J, Proctor M, Nislow C, Jaramillo DF, Chu AM, Jordan MI, Arkin AP, Davis RW. Chemogenomic profiling: identifying the functional interactions of small molecules in yeast. Proc Natl Acad Sci U S A. 2004;101:793–798. doi: 10.1073/pnas.0307490100. [DOI] [PMC free article] [PubMed] [Google Scholar]
- Giloni L, Takeshita M, Johnson F, Iden C, Grollman AP. Bleomycin-induced strand-scission of DNA. Mechanism of deoxyribose cleavage. J Biol Chem. 1981;256:8608–8615. [PubMed] [Google Scholar]
- Girgis HS, Hottes AK, Tavazoie S. Genetic architecture of intrinsic antibiotic susceptibility. PLoS One. 2009;4:e5629. doi: 10.1371/journal.pone.0005629. [DOI] [PMC free article] [PubMed] [Google Scholar]
- Girgis HS, Liu Y, Ryu WS, Tavazoie S. A comprehensive genetic characterization of bacterial motility. PLoS Genet. 2007;3:1644–1660. doi: 10.1371/journal.pgen.0030154. [DOI] [PMC free article] [PubMed] [Google Scholar]
- Goodman AL, McNulty NP, Zhao Y, Leip D, Mitra RD, Lozupone CA, Knight R, Gordon JI. Identifying genetic determinants needed to establish a human gut symbiont in its habitat. Cell Host Microbe. 2009;6:279–289. doi: 10.1016/j.chom.2009.08.003. [DOI] [PMC free article] [PubMed] [Google Scholar]
- Griffith KL, Shah IM, Wolf RE., Jr. Proteolytic degradation of Escherichia coli transcription activators SoxS and MarA as the mechanism for reversing the induction of the superoxide (SoxRS) and multiple antibiotic resistance (Mar) regulons. Mol Microbiol. 2004;51:1801–1816. doi: 10.1046/j.1365-2958.2003.03952.x. [DOI] [PubMed] [Google Scholar]
- Hecht SM. Bleomycin: new perspectives on the mechanism of action. J Nat Prod. 2000;63:158–168. doi: 10.1021/np990549f. [DOI] [PubMed] [Google Scholar]
- Hillenmeyer ME, Fung E, Wildenhain J, Pierce SE, Hoon S, Lee W, Proctor M, St Onge RP, Tyers M, Koller D, et al. The chemical genomic portrait of yeast: uncovering a phenotype for all genes. Science. 2008;320:362–365. doi: 10.1126/science.1150021. [DOI] [PMC free article] [PubMed] [Google Scholar]
- Hobbs EC, Astarita JL, Storz G. Small RNAs and small proteins involved in resistance to cell envelope stress and acid shock in Escherichia coli: analysis of a bar-coded mutant collection. J Bacteriol. 2010;192:59–67. doi: 10.1128/JB.00873-09. [DOI] [PMC free article] [PubMed] [Google Scholar]
- Hoon S, Smith AM, Wallace IM, Suresh S, Miranda M, Fung E, Proctor M, Shokat KM, Zhang C, Davis RW, et al. An integrated platform of genomic assays reveals small-molecule bioactivities. Nat Chem Biol. 2008;4:498–506. doi: 10.1038/nchembio.100. [DOI] [PubMed] [Google Scholar]
- Hu P, Janga SC, Babu M, Diaz-Mejia JJ, Butland G, Yang W, Pogoutse O, Guo X, Phanse S, Wong P, et al. Global functional atlas of Escherichia coli encompassing previously uncharacterized proteins. PLoS Biol. 2009;7:e96. doi: 10.1371/journal.pbio.1000096. [DOI] [PMC free article] [PubMed] [Google Scholar]
- Jeanguenin L, Lara-Nunez A, Pribat A, Mageroy M. Hamner, Gregory JF, 3rd, Rice KC, de Crecy-Lagard V, Hanson AD. Moonlighting glutamate formiminotransferases can functionally replace 5-formyltetrahydrofolate cycloligase. J Biol Chem. 2010 doi: 10.1074/jbc.M110.190504. [DOI] [PMC free article] [PubMed] [Google Scholar]
- Jeong KS, Ahn J, Khodursky AB. Spatial patterns of transcriptional activity in the chromosome of Escherichia coli. Genome Biol. 2004;5:R86. doi: 10.1186/gb-2004-5-11-r86. [DOI] [PMC free article] [PubMed] [Google Scholar]
- Joyce AR, Reed JL, White A, Edwards R, Osterman A, Baba T, Mori H, Lesely SA, Palsson BO, Agarwalla S. Experimental and computational assessment of conditionally essential genes in Escherichia coli. J Bacteriol. 2006;188:8259–8271. doi: 10.1128/JB.00740-06. [DOI] [PMC free article] [PubMed] [Google Scholar]
- Kim DU, Hayles J, Kim D, Wood V, Park HO, Won M, Yoo HS, Duhig T, Nam M, Palmer G, et al. Analysis of a genome-wide set of gene deletions in the fission yeast Schizosaccharomyces pombe. Nat Biotechnol. 2010;28:617–623. doi: 10.1038/nbt.1628. [DOI] [PMC free article] [PubMed] [Google Scholar]
- Kohanski MA, Dwyer DJ, Wierzbowski J, Cottarel G, Collins JJ. Mistranslation of membrane proteins and two-component system activation trigger antibiotic-mediated cell death. Cell. 2008;135:679–690. doi: 10.1016/j.cell.2008.09.038. [DOI] [PMC free article] [PubMed] [Google Scholar]
- Kwon YK, Higgins MB, Rabinowitz JD. Antifolate-induced depletion of intracellular glycine and purines inhibits thymineless death in E. coli. ACS Chem Biol. 2010;5:787–795. doi: 10.1021/cb100096f. [DOI] [PMC free article] [PubMed] [Google Scholar]
- Kwon YK, Lu W, Melamud E, Khanam N, Bognar A, Rabinowitz JD. A domino effect in antifolate drug action in Escherichia coli. Nat Chem Biol. 2008;4:602–608. doi: 10.1038/nchembio.108. [DOI] [PMC free article] [PubMed] [Google Scholar]
- Lee W, St Onge RP, Proctor M, Flaherty P, Jordan MI, Arkin AP, Davis RW, Nislow C, Giaever G. Genome-wide requirements for resistance to functionally distinct DNA-damaging agents. PLoS Genet. 2005;1:e24. doi: 10.1371/journal.pgen.0010024. [DOI] [PMC free article] [PubMed] [Google Scholar]
- Liu A, Tran L, Becket E, Lee K, Chinn L, Park E, Tran K, Miller JH. Antibiotic sensitivity profiles determined with an Escherichia coli gene knockout collection: generating an antibiotic bar code. Antimicrob Agents Chemother. 2010;54:1393–1403. doi: 10.1128/AAC.00906-09. [DOI] [PMC free article] [PubMed] [Google Scholar]
- Liu OW, Chun CD, Chow ED, Chen C, Madhani HD, Noble SM. Systematic genetic analysis of virulence in the human fungal pathogen Cryptococcus neoformans. Cell. 2008;135:174–188. doi: 10.1016/j.cell.2008.07.046. [DOI] [PMC free article] [PubMed] [Google Scholar]
- Martin RG, Bartlett ES, Rosner JL, Wall ME. Activation of the Escherichia coli marA/soxS/rob regulon in response to transcriptional activator concentration. J Mol Biol. 2008;380:278–284. doi: 10.1016/j.jmb.2008.05.015. [DOI] [PMC free article] [PubMed] [Google Scholar]
- Martin RG, Rosner JL. Genomics of the marA/soxS/rob regulon of Escherichia coli: identification of directly activated promoters by application of molecular genetics and informatics to microarray data. Mol Microbiol. 2002;44:1611–1624. doi: 10.1046/j.1365-2958.2002.02985.x. [DOI] [PubMed] [Google Scholar]
- McOsker CC, Fitzpatrick PM. Nitrofurantoin: mechanism of action and implications for resistance development in common uropathogens. J Antimicrob Chemother. 1994;33(Suppl A):23–30. doi: 10.1093/jac/33.suppl_a.23. [DOI] [PubMed] [Google Scholar]
- Nelson KE, Weinstock GM, Highlander SK, Worley KC, Creasy HH, Wortman JR, Rusch DB, Mitreva M, Sodergren E, Chinwalla AT, et al. A catalog of reference genomes from the human microbiome. Science. 2010;328:994–999. doi: 10.1126/science.1183605. [DOI] [PMC free article] [PubMed] [Google Scholar]
- Nicoloff H, Perreten V, Levy SB. Increased genome instability in Escherichia coli lon mutants: relation to emergence of multiple-antibiotic-resistant (Mar) mutants caused by insertion sequence elements and large tandem genomic amplifications. Antimicrob Agents Chemother. 2007;51:1293–1303. doi: 10.1128/AAC.01128-06. [DOI] [PMC free article] [PubMed] [Google Scholar]
- Nicoloff H, Perreten V, McMurry LM, Levy SB. Role for tandem duplication and lon protease in AcrAB-TolC- dependent multiple antibiotic resistance (Mar) in an Escherichia coli mutant without mutations in marRAB or acrRAB. J Bacteriol. 2006;188:4413–4423. doi: 10.1128/JB.01502-05. [DOI] [PMC free article] [PubMed] [Google Scholar]
- Noble SM, French S, Kohn LA, Chen V, Johnson AD. Systematic screens of a Candida albicans homozygous deletion library decouple morphogenetic switching and pathogenicity. Nat Genet. 2010;42:590–598. doi: 10.1038/ng.605. [DOI] [PMC free article] [PubMed] [Google Scholar]
- Pan X, Yuan DS, Xiang D, Wang X, Sookhai-Mahadeo S, Bader JS, Hieter P, Spencer F, Boeke JD. A robust toolkit for functional profiling of the yeast genome. Mol Cell. 2004;16:487–496. doi: 10.1016/j.molcel.2004.09.035. [DOI] [PubMed] [Google Scholar]
- Parsons AB, Lopez A, Givoni IE, Williams DE, Gray CA, Porter J, Chua G, Sopko R, Brost RL, Ho CH, et al. Exploring the mode-of-action of bioactive compounds by chemical-genetic profiling in yeast. Cell. 2006;126:611–625. doi: 10.1016/j.cell.2006.06.040. [DOI] [PubMed] [Google Scholar]
- Pathania R, Zlitni S, Barker C, Das R, Gerritsma DA, Lebert J, Awuah E, Melacini G, Capretta FA, Brown ED. Chemical genomics in Escherichia coli identifies an inhibitor of bacterial lipoprotein targeting. Nat Chem Biol. 2009;5:849–856. doi: 10.1038/nchembio.221. [DOI] [PubMed] [Google Scholar]
- Qin J, Li R, Raes J, Arumugam M, Burgdorf KS, Manichanh C, Nielsen T, Pons N, Levenez F, Yamada T, et al. A human gut microbial gene catalogue established by metagenomic sequencing. Nature. 2010;464:59–65. doi: 10.1038/nature08821. [DOI] [PMC free article] [PubMed] [Google Scholar]
- Rocha EP, Danchin A. Essentiality, not expressiveness, drives gene-strand bias in bacteria. Nat Genet. 2003;34:377–378. doi: 10.1038/ng1209. [DOI] [PubMed] [Google Scholar]
- Roguev A, Bandyopadhyay S, Zofall M, Zhang K, Fischer T, Collins SR, Qu H, Shales M, Park HO, Hayles J, et al. Conservation and rewiring of functional modules revealed by an epistasis map in fission yeast. Science. 2008;322:405–410. doi: 10.1126/science.1162609. [DOI] [PMC free article] [PubMed] [Google Scholar]
- Schirch V, Hopkins S, Villar E, Angelaccio S. Serine hydroxymethyltransferase from Escherichia coli: purification and properties. J Bacteriol. 1985;163:1–7. doi: 10.1128/jb.163.1.1-7.1985. [DOI] [PMC free article] [PubMed] [Google Scholar]
- Schuldiner M, Collins SR, Thompson NJ, Denic V, Bhamidipati A, Punna T, Ihmels J, Andrews B, Boone C, Greenblatt JF, et al. Exploration of the function and organization of the yeast early secretory pathway through an epistatic miniarray profile. Cell. 2005;123:507–519. doi: 10.1016/j.cell.2005.08.031. [DOI] [PubMed] [Google Scholar]
- Stover P, Schirch V. The metabolic role of leucovorin. Trends Biochem Sci. 1993;18:102–106. doi: 10.1016/0968-0004(93)90162-g. [DOI] [PubMed] [Google Scholar]
- Taber HW, Mueller JP, Miller PF, Arrow AS. Bacterial uptake of aminoglycoside antibiotics. Microbiol Rev. 1987;51:439–457. doi: 10.1128/mr.51.4.439-457.1987. [DOI] [PMC free article] [PubMed] [Google Scholar]
- Tamae C, Liu A, Kim K, Sitz D, Hong J, Becket E, Bui A, Solaimani P, Tran KP, Yang H, et al. Determination of antibiotic hypersensitivity among 4,000 single-gene-knockout mutants of Escherichia coli. J Bacteriol. 2008;190:5981–5988. doi: 10.1128/JB.01982-07. [DOI] [PMC free article] [PubMed] [Google Scholar]
- Tong AH, Evangelista M, Parsons AB, Xu H, Bader GD, Page N, Robinson M, Raghibizadeh S, Hogue CW, Bussey H, et al. Systematic genetic analysis with ordered arrays of yeast deletion mutants. Science. 2001;294:2364–2368. doi: 10.1126/science.1065810. [DOI] [PubMed] [Google Scholar]
- Toro E, Shapiro L. Bacterial chromosome organization and segregation. Cold Spring Harb Perspect Biol. 2010;2:a000349. doi: 10.1101/cshperspect.a000349. [DOI] [PMC free article] [PubMed] [Google Scholar]
- Travers A, Muskhelishvili G. DNA supercoiling - a global transcriptional regulator for enterobacterial growth? Nat Rev Microbiol. 2005;3:157–169. doi: 10.1038/nrmicro1088. [DOI] [PubMed] [Google Scholar]
- Tu Y, McCalla DR. Effect of activated nitrofurans on DNA. Biochim Biophys Acta. 1975;402:142–149. doi: 10.1016/0005-2787(75)90032-5. [DOI] [PubMed] [Google Scholar]
- Typas A, Banzhaf M, van den Berg van Saparoea B, Verheul J, Biboy J, Nichols RJ, Zietek M, Beilharz K, Kannenberg K, von Rechenberg M, Breukink E, den Blaauwen T, Gross CA, Vollmer W. Regulation of peptidoglycan synthesis by outer-membrane proteins. Cell. 2010 Dec 23;143(7):1097–109. doi: 10.1016/j.cell.2010.11.038. PMID: 21183073. [DOI] [PMC free article] [PubMed] [Google Scholar]
- Typas A, Nichols RJ, Siegele DA, Shales M, Collins SR, Lim B, Braberg H, Yamamoto N, Takeuchi R, Wanner BL, et al. High-throughput, quantitative analyses of genetic interactions in E. coli. Nat Methods. 2008;5:781–787. doi: 10.1038/nmeth.1240. [DOI] [PMC free article] [PubMed] [Google Scholar]
- Vora T, Hottes AK, Tavazoie S. Protein occupancy landscape of a bacterial genome. Mol Cell. 2009;35:247–253. doi: 10.1016/j.molcel.2009.06.035. [DOI] [PMC free article] [PubMed] [Google Scholar]
- Warner DM, Levy SB. Different effects of transcriptional regulators MarA, SoxS and Rob on susceptibility of Escherichia coli to cationic antimicrobial peptides (CAMPs): Rob-dependent CAMP induction of the marRAB operon. Microbiology. 2010;156:570–578. doi: 10.1099/mic.0.033415-0. [DOI] [PMC free article] [PubMed] [Google Scholar]
- Warner JR, Reeder PJ, Karimpour-Fard A, Woodruff LB, Gill RT. Rapid profiling of a microbial genome using mixtures of barcoded oligonucleotides. Nat Biotechnol. 2010;28:856–862. doi: 10.1038/nbt.1653. [DOI] [PubMed] [Google Scholar]
- Werner JN, Chen EY, Guberman JM, Zippilli AR, Irgon JJ, Gitai Z. Quantitative genome-scale analysis of protein localization in an asymmetric bacterium. Proc Natl Acad Sci U S A. 2009;106:7858–7863. doi: 10.1073/pnas.0901781106. [DOI] [PMC free article] [PubMed] [Google Scholar]
- Xu D, Jiang B, Ketela T, Lemieux S, Veillette K, Martel N, Davison J, Sillaots S, Trosok S, Bachewich C, et al. Genome-wide fitness test and mechanism-of-action studies of inhibitory compounds in Candida albicans. PLoS Pathog. 2007;3:e92. doi: 10.1371/journal.ppat.0030092. [DOI] [PMC free article] [PubMed] [Google Scholar]
- Yamamoto N, Nakahigashi K, Nakamichi T, Yoshino M, Takai Y, Touda Y, Furubayashi A, Kinjyo S, Dose H, Hasegawa M, et al. Update on the Keio collection of Escherichia coli single-gene deletion mutants. Mol Syst Biol. 2009;5:335. doi: 10.1038/msb.2009.92. [DOI] [PMC free article] [PubMed] [Google Scholar]
- Yeh P, Tschumi AI, Kishony R. Functional classification of drugs by properties of their pairwise interactions. Nat Genet. 2006;38:489–494. doi: 10.1038/ng1755. [DOI] [PubMed] [Google Scholar]
- Yeh PJ, Hegreness MJ, Aiden AP, Kishony R. Drug interactions and the evolution of antibiotic resistance. Nat Rev Microbiol. 2009;7:460–466. doi: 10.1038/nrmicro2133. [DOI] [PMC free article] [PubMed] [Google Scholar]
Associated Data
This section collects any data citations, data availability statements, or supplementary materials included in this article.