

Abstract
Quantitative analyses of the 5′ end of gal transcripts indicate that transcription from the galactose operon P1 promoter is higher during cell division. When cells are no longer dividing, however, transcription is initiated more often from the P2 promoter. Escherichia coli cells divide six times before the onset of the stationary phase when grown in LB containing 0.5% galactose at 37°C. Transcription from the two promoters increases, although at different rates, during early exponential phase (until the third cell division, OD600 0.4), and then reaches a plateau. The steady-state transcription from P1 continues in late exponential phase (the next three cell divisions, OD600 3.0), after which transcription from this promoter decreases. However, steady-state transcription from P2 continues 1 h longer into the stationary phase, before decreasing. This longer steady-state P2 transcription constitutes the promoter transition from P1 to P2 at the onset of the stationary phase. The intracellular cAMP concentration dictates P1 transcription dynamics; therefore, promoter transition may result from a lack of cAMP-CRP complex binding to the gal operon. The decay rate of gal-specific transcripts is constant through the six consecutive cell divisions that comprise the exponential growth phase, increases at the onset of the stationary phase, and is too low to be measured during the stationary phase. These data suggest that a regulatory mechanism coordinates the synthesis and decay of gal mRNAs to maintain the observed gal transcription. Our analysis indicates that the increase in P1 transcription is the result of cAMP-CRP binding to increasing numbers of galactose operons in the cell population.
Introduction
Genetic studies have demonstrated that the galactose operon of Escherichia coli has two promoters, P1 and P2, which are separated by five nucleotides [1], [2]. These promoters are responsible for transcription of the four structural genes, galE, galT, galK, and galM (Fig. 1). Three trans-acting proteins, GalR (the gal repressor), cAMP receptor protein (CRP)-cAMP complex, and the histone-like protein HU, control transcription from these two promoters. Biochemical assays with purified components have shown that GalR binds to the two operator sequences, OE and OI, (Fig. 1) with equal affinity [3], [4]. In the presence of HU, GalR bound to OE and OI brings the two operators together to form a DNA loop, which simultaneously represses P1 and P2 [5]. When the gal operon is induced, the CRP-cAMP complex activates the P1 promoter through direct contact between CRP and the N-terminal domain of the alpha subunit of the RNA polymerase (RNAP) holoenzyme [1], [6]. This contact increases the promoter-binding activity of RNA polymerase or facilitates open-complex formation, or may achieve both effects [7]. The CRP-cAMP complex appears to repress the P2 promoter [1], [2].
Figure 1. The galactose operon.

Transcription initiation sites of the P1 and P2 promoters are indicated by arrows. The numbers indicate nucleotide position relative to the P1 transcription initiation site (+1). The CRP-binding site is represented by an empty box labeled “CRP”. The two operator sites to which GalR binds are represented by black boxes labeled “OE” and “OI”. The black oval labeled “hbs” indicates an HU-binding site. The four structural genes of the gal operon are represented as E, T, K, and M, designating genes for epimerase (GalE), transferase (GalT), kinase (GalK), and mutarotase (GalM), respectively. The gal specific mRNA species are presented as arrows. Note that these mRNA species establish mRNA concentration gradient that is higher at the promoter-proximal region [9].
Transcription of the gal operon produces the same gene products regardless of the promoter used. Despite the detailed understanding of this complex two-promoter system, the purpose of having two promoters for a single operon remains unclear. The gal operon must be transcribed under all growth conditions because Gal proteins are involved not only in galactose catabolism but also in the glycosylation of lipopolysaccharides in the outer membrane of Escherichia coli [8]. Thus, the two-promoter system may be needed to ensure continuous synthesis of Gal proteins under various external or internal conditions. In our previous study [9], we described an mRNA concentration gradient that is higher in the promoter proximal cistron than the distal region, and showed that transcription from the P2 promoter generates a steeper mRNA concentration gradient than the P1 promoter. We suggested that the steeper mRNA concentration gradient may account for the observation that a cAMP-deficient strain in which P2 is known to be more active than P1 [10] showed severe polarity in expression of the operon [11], [12], [13].
We reasoned that the amount and speed of transcription from the two promoters would be different. Thus, we evaluated P1 and P2 promoter usage in vivo and found that P1 produces 70% of the total gal transcripts during exponential growth phase. However, during stationary phase, the promoter usage is reversed; 70% of the gal transcripts are produced from the P2 promoter. To understand the observed promoter transition from P1 to P2 at the beginning of the stationary phase in molecular terms, we measured synthesis and decay rates of transcripts from the P1 and P2 promoters, and found that P1 transcription was down regulated earlier than P2 transcription at the end of the exponential growth phase.
Results
Promoter usage differs in growth and stationary phases
The relative number of transcripts initiated at the galactose operon P1 and P2 promoters were determined during different growth phases. To distinguish transcripts originating from P1 and P2, which differ by only five bases at the 5′ end, we employed a modified 5′-RACE assay [14]. Briefly, total RNA was prepared from a fixed number of cells, usually 1×10⁸ cells (as determined by optical density and colony forming unit measurement). The 3′ hydroxyl ends of 5S rRNAs were ligated to the 5′-phosphate ends of mRNAs before reverse transcription, which enabled amplification of P1-specific and P2-specific cDNAs. After primer extension of a P32-labeled DNA primer, the 5′-ends of the P1-specific and P2-specific transcripts were visualized by electrophoresis on a DNA sequencing gel (Fig. 2A). These assays were performed using total RNA isolated from E. coli MG1655 (WT) grown in LB medium containing 0.5% galactose. Thus, we measured P1-initiated and P2- initiated transcripts in a fixed number of cells at different time points under gal-inducing conditions. Quantitative analysis of the P1-initated and P2- initiated transcripts with a PhosphorImager™ indicated that 70% of gal-specific transcripts were initiated from the P1 promoter during the exponential growth phase, and 30% were initiated from the P2 promoter (Fig. 2A, lanes 1–3). At the onset of stationary phase, however, 70% of the transcripts were generated from the P2 promoter and 30% from the P1 promoter (Fig. 2A, lane 4). This transition from P1 to P2 as the major promoter occurred at the transition to stationary phase (Fig. 2B).
Figure 2. The ratio of P1-initiated and P2-initiated transcripts during different growth phases.

The gal transcripts were analyzed by 5′-RACE and primer extension followed by 8% DNA sequencing gel electrophoresis (A). MG1655 (WT strain) was grown in LB containing 0.5% galactose. Total RNA was isolated from 1×10⁸ cells at different time points, indicated by vertical arrows in the growth curve (B) and analyzed by 5′-RACE. Each lane in (A) corresponds to the time point indicated in (B).
Cause of promoter usage transition from P1 to P2
To explore the mechanism(s) that causes promoter transition at onset of stationary phase, we performed the same experiments in two mutant strains: CH1106, which lacks the stationary phase-specific RNAP sigma factor RpoS [15], [16], and CF10237, which is deficient in guanosine tetraphosphate (ppGpp), a small molecule that redirects transcription to genes for starvation and survival [17], [18]. Promoter transition in the two mutant strains was identical to that of the WT strain (data not shown), suggesting that promoter transition is not due to preferential recognition of the P2 promoter by the RNAP holoenzyme containing RpoS or by the increasing ppGpp concentration in the stationary phase.
We then performed 5′-RACE experiments using total RNA isolated from mutant strains that lack the CRP-cAMP and GalR transcription factors (Fig. 3). The CRP-deficient and cAMP-deficient strains both used P2 as the major promoter throughout the growth phases, instead of switching from P1 to P2 at the transition to stationary phase (Fig. 3A and 3B). These data suggest that the CRP-cAMP complex is required for P1 transcription in the exponential growth phase [2] and may be involved in promoter transition. In contrast, promoter transition of the galR-deficient strain (Fig. 3C) was similar to that of the WT strain, suggesting that GalR is not involved in promoter transition.
Figure 3. Effect of CRP, cAMP, and GalR on gal operon transcription dynamics.

The ratio of P1-initiated and P2-initiated transcripts during different growth phases was evaluated in (A) MG1655 (WT), (B) MG1655crp (CRP-deficient), (C) MG1655cya (cAMP-deficient), and (D) MG1655galR (GalR-deficient) strains. The gal transcripts were analyzed by 5′-RACE and primer extension assay followed by 8% DNA sequencing gel electrophoresis. Amount of the transcripts from P1 and P2 promoters is shown in percent of the total gal transcripts.
Real-time RT-PCR analysis of the P1 and P2 promoter transcription dynamics
To compare the relative number of transcripts of samples taken at different time points, real-time RT-PCR is a better method than 5′-RACE because 5′-RACE is based on end-point PCR reactions. The range of cDNA concentrations that correspond to the linear range of real-time PCR amplification is 4 to 5 orders of magnitude higher than that of end-point PCR [19]. Thus, we used real-time RT-PCR to make more sensitive measurements of changes in gal transcription during different growth stages.
To distinguish between transcripts that differed by only five bases in their 5′ ends by real-time RT-PCR, we used one reverse primer that annealed to the 3′ ends of both P1 and P2 transcripts, in combination with one of two forward primers: P2only-for, which annealed only to the P2 transcript, and P1-P2-for, which annealed to both transcripts (Fig. 4A) [20]. The relative number of P1-initiated transcripts was calculated by subtracting the number of P2 transcripts from the total number of transcripts.
Figure 4. Analysis of P1-specific and P2-specific transcription dynamics during different growth phases.

The relative number of P1 and P2 transcripts were determined by real-time RT-PCR using the DNA primers shown in (A) in the wild type strain MG1655. The primers anneal to the 5′ end of the gal operon and the numbers indicate nucleotide position relative to the transcription initiation site (+1) of the P1 promoter. Thus, the resulting PCR products are about 100 bp long. (B) For real-time RT-PCR analysis, total RNA was prepared from equal numbers of cells (1×10⁸) for each time point (rectangles). Transcript levels are expressed relative to the first time point of wild type P1 transcription. The error bars indicate standard deviation from three independent experiments (B).
Promoter transition is due to differential transcription dynamics of P1 and P2 transcription
The relative number of P1 and P2 transcripts was plotted at time points during the exponential and stationary growth phases (Fig. 4B), revealing that gal transcription consists of three distinct periods we named INCREASE, STEADY-STATE, and DECREASE. The INCREASE and STEADY-STATE periods comprise the entire exponential growth phase. Transcription from both P1 and P2 promoters increases exponentially during the INCREASE period, which begins with the start of incubation (OD600 0.05) and ends 90 min after the start of incubation (OD600 0.4). Although the STEADY-STATE period of P1 and P2 transcription both begin at 90 min, STEADY-STATE P1 transcription ends at 175 min (OD600 3.0), which is the onset of the stationary phase. In contrast, STEADY-STATE P2 transcription extends into the stationary phase, ending at 240 min (OD600 4.6). The STEADY-STATE periods of P1 and P2 transcription lasted 85 and 150 min, respectively. Transcription decreases during the DECREASE period, which starts at 175 min for the P1 transcription. Due to the longer STEADY-STATE period of P2 transcription, however, the DECREASE period starts at 240 min, when cells are in early stationary phase.
The ratio of the relative number of P1 and P2 transcripts is 70/30 (P1 transcript 70%, P2 transcript 30%) throughout the entire exponential growth phase, as determined by real-time RT-PCR, but is reversed to 30/70 during the stationary growth phase (Fig. 4B). This result is consistent with results of the 5′-RACE assay, which suggested a promoter transition from P1 to P2 at the onset of the stationary growth phase (Fig. 2A). The real-time RT-PCR findings indicate that the longer STEADY-STATE period of P2 transcription compared with that of P1 transcription constitutes the promoter transition.
Kinetic analysis of gal transcription during the INCREASE and STEADY-STATE periods
The exponential increase in transcription during the INCREASE period (Fig. 4B) indicated first-order kinetics. The first-order rate equation fits the data obtained from the first four time points (10, 40, 60, and 90 min) (R2>0.95). The rate constants for P1 and P2 transcription were 0.0372±0.0025 min−1 and 0.0312±0.0028 min−1, respectively, indicating that the number P1 transcripts increased faster than the number of P2 transcripts, resulting in the number of P1 transcripts doubling every 18.7±1.2 min and the number of P2 transcripts doubling every 22.3±1.9 min.
Since accumulation rate (observed rate) = synthesis rate – degradation rate, we measured the decay rate (degradation rate) of the gal transcripts to determine the actual transcription rate (synthesis rate). The rapid degradation of E. coli mRNAs [21] required measurement of gal mRNA decay rates during the different growth phases. We measured the decay rate of P1 and P2 transcripts separately. MG1655 cells were cultured in LB with 0.5% galactose, and rifampicin was added to stop transcription at various time points. The cells were analyzed 0, 2, 4, 6, and 8 min after adding rifampicin. To determine the decay rate and mRNA half-life, the relative number of P1 and P2 transcripts in each sample were determined by real-time RT-PCR.
As shown in Fig. 5, the half-lives of P1 and P2 transcripts were constant from 65 min to 175 min (OD600 3.0): 1.37±0.22 min for P1-initiated transcription and 1.71±0.27 min for P2-initiated transcription. Therefore, the difference in the relative number of transcripts in the INCREASE and STEADY-STATE periods (Fig. 4B) are therefore due to changes in P1- and P2-transcription rate. Note that cells are still dividing at the same rate when the gal transcription rates are being changed.
Figure 5. Half-life of the gal transcripts during different growth phases.

Half-life of mRNA at each time point was determined by real-time RT-PCR. *decay rate was too low measure. The standard deviation from three independent experiments at time point of 65 min was too small to be represented in the scale of the figure.
Analyses based on decay rates suggest that actual transcription in vivo doubles every 1.28±0.01 min from the P1 promoter and every 1.60±0.01 min from the P2 promoter during the INCREASE period. The observed number of P1 and P2 transcripts (Fig. 4B) doubles every 18.7 and 22.3 min, respectively, indicating that the actual transcription during the INCREASE period is 15 to 16 times faster than the observed increase in transcript number to compensate for the rapid mRNA degradation. In vivo transcription during the STEADY-STATE period occurs at the same rate as mRNA decay. Thus, during the STEADY-STATE period, the number of P1 transcripts doubles every 1.37 min and the number of P2 transcripts doubles every 1.71 min. This rate of transcription from the P1 promoter continues to 175 min, but continues to 240 min from the P2 promoter, indicating differential regulation of the P1 and P2 promoters.
Transcription during the DECREASE period
The linear decrease of transcription in the semi-log scale plot (Fig. 4B) during the DECREASE period indicated that the number gal transcripts decreased exponentially, suggesting first-order kinetics. To more accurately determine the decrease rate constant, we measured the relative number of P1 and P2 transcripts at 240, 300, 360, and 420 min (Fig. 6). The rate constant for P1 was calculated as −0.017 min−1 and the rate constant for P2 transcription as −0.013 min−1, indicating that the transcripts decrease by half every 40 and 53 min, respectively. At 240 min, the half-lives of the P1 and P2 transcript were 3.35 min, and 5.52 min, respectively, indicating that the decay was almost twice (P1) and three times (P2) slower than those of the exponential phase (Fig. 5). After 300 min, mRNA half-lives were too long to be measured; after rifampicin treatment, the number of mRNA transcripts changed very little, indicating that mRNA decay of the gal transcripts almost came to a halt after 300 min.
Figure 6. Transcription dynamics of P1-initiated and P2-initiated transcription during the DECREASE period.

Relative numbers of P1 and P2 transcripts were determined at 240, 300, 360, and 420 min. Rate constants were determined from the slope, and fitted curves are presented. The error bars indicate standard deviation from two independent experiments
The DECREASE period was further divided into DECREASE I, in which the mRNA decay slows, and DECREASE II, in which there is virtually no mRNA decay. These mRNA decay dynamics showed that in the DECREASE I period, the number of transcripts initiated from P1 doubled every 5.2 min (175–300 min) and the number of transcripts initiated from P2 doubled every 7.1 min (240–300 min), demonstrating that transcription slowed down significantly compared with the STEADY-STATE period (Table 1). However, actual transcription slowed down even further during the DECREASE II period: reducing the number P1 and P2 transcripts by half required 40 min and 53 min, respectively (Table 1).
Table 1. Time required to double or reduce by half the number of gal transcripts during different growth phases.
| Time (growth phase) | Transcription period | P1 transcription rate (min) | P2 transcription rate (min) | ||
| Observed rate1 | Actual rate2 | Observed rate | Actual rate | ||
| 0–90 (early exponential) | INCREASE | 18.7 (±1.2) | 1.28 (±0.01) | 22.3 (±1.9) | 1.60 (± 0.01) |
| 90–175 (late exponential) | STEADY-STATE | 0 | 1.37 (±0.22) | 0 | 1.71 (±0.22) |
| 175–300 (early stationary) | DECREASE I | −40a | 5.2 | −53 | 7.1 |
| >300 (stationary) | DECREASE II | −40 | −40 | −53 | −53 |
Observed rate: rate of mRNA accumulation.
Actural rate: rate of actual transcription.
negative sign (-) represents the time required to reduce the number of gal transcripts by half.
Transcription from the P1 promoter is likely regulated by DNA binding of CRP-cAMP
The P2 transcription dominance during exponential growth in strains lacking CRP or cAMP (Fig. 3) suggested that the CRP-cAMP complex regulates P1 transcription. To understand the role of the CRP-cAMP complex on P1 transcription dynamics, we measured changes in the amount of CRP protein and cAMP during different growth phases in MG1655 (Figs. 7 and 8). As shown in Fig. 7, CRP concentration gradually increases with time, peaks at 175 min, and then decreases during the stationary phase. However, cAMP initially increases to four times its initial concentration, followed by a more or less steady-state period (Fig. 8). At 175 min, cAMP concentration starts to decrease, declining to 25% of peak levels by 240 min. The concentration dynamics of cAMP, rather than CRP, appear to be more closely related to P1 transcription dynamics. The initial increase of both CRP and cAMP suggests that increased binding of the CRP-cAMP complex to the gal operon promoter region caused the initial increase in P1 transcripts during the INCREASE period (Fig. 4B). Dissociation of the CRP-cAMP complex from the gal operon due to lower cAMP concentrations at the onset of the stationary phase may have decreased P1 transcription, resulting in promoter transition.
Figure 7. Dynamics of CRP concentration in different growth phases.

Amount of CRP at different time points was determined by Western blot analysis (A), and plotted as a function of growth (B).
Figure 8. Dynamics of cAMP concentration at different growth phases.

Intracellular cAMP concentrations at different time points were determined by an enzyme-linked immunoassay.
Rsd and 6S RNA do not affect gal transcription during the DECREASE period
The kinetic analysis of the gal transcription in vivo showed that transcription from both promoters is down regulated (Fig. 4B). We were interested if there is any transcription factors (other than CRP-cAMP) involved in down regulation of the gal transcription in stationary phase. Recently, 6S RNA was shown to specifically down-regulate promoters with a weak -35 element and an extended -10 element such as the gal promoters [22] during stationary phase. The E. coli protein Rsd [23] inhibits transcription initiated by sigma70 during the stationary phase [24], [25]. We determined the transcription dynamics of the gal operon in strains deficient in 6S RNA (ssrS1) or the Rsd protein (rsd) to assess whether these factors are involved the down-regulation of gal transcription during the DECREASE period. We expected to see little or no decrease in gal transcription during the DECREASE period if these factors affected gal transcription during the stationary phase. However, decreasing transcription rates from both promoters was similar to that of WT (Fig. 6, data not shown). We concluded that these factors are not involved in down-regulating gal transcription, at least not during the early stationary phase.
Discussion
Physiological consequences of the promoter transition
It has been known that the genes proximal to the promoter produce more proteins than the ones distal to the promoter, a phenomenon known as “polarity” in gene expression [26], [27], [28]. The fundamental cause of the polarity effect seems to reside on what has been defined as “mRNA concentration gradient”, in which the concentration of the promoter-proximal mRNA is greater than that of the promoter-distal mRNA [9]. The mRNA concentration gradient could be established because different species of the gal transcripts bear their 3′-ends at the end of each cistron of the gal operon (Fig. 1). Interestingly, the severity of mRNA gradient depends on which promoter the transcription initiates; transcription from P1 generates steeper mRNA gradient than that from P2 [9]. Thus, one of the reasons as to why P2 becomes a dominant promoter during stationary phase might be that cells need more proteins from the front part of the operon, specifically GalE, UDP-galactose epimerase that catalyzes UDP-galactose to UDP-glucose. Indeed, the relationship between P2 transcription and GalE production has been elegantly demonstrated in a recent report by Lee et al. [29]. The P2 promoter is specifically derepressed (by low concentration of UTP, not by the conventional derepression mechanism by galactose) to produce more GalE protein when UDP-galactose concentration in the cell becomes high [29]. Another interesting previous result regarding P2 transcription and GalE production is that the P2 transcript can produce 3 times more of GalE protein than the P1 transcript [13]. Thus, it is likely that one of the physiological consequences of the P2 becoming the major promoter in gal transcription at the beginning of stationary phase is to maintain a certain level of GalE in a situation where the overall gal transcription decreases as shown in Fig. 4. Indeed, the amount of GalE measured by Western blot analysis stayed almost the same starting from late exponential to stationary phase while those of GalT and GalK decreased (unpublished result, HM Lim), supporting our notion that cells need to maintain a certain concentration of GalE against decreasing mRNA level during stationary phase.
The actual transcription rates of the two promoters
The transcription dynamics shown in Fig. 4B represent changes in the relative number of gal transcripts from the P1 and P2 promoters during different growth phases. By measuring mRNA degradation, we were able to show the actual transcription rate required to account for these observed transcript levels. The actual transcription rates during different growth phases along with the observed changes in transcript levels are summarized in Table 1. The actual and observed transcription rates are expressed as time (min) required for the number of gal transcripts to double or be reduced by half. For example, the time required to double the number of transcripts initiated from P1 was 1.28 min during the INCREASE period, 1.37 min during the STEADY-STATE period, and 5.2 min during the DECREASE I period. During the DECREASE II period, however, it required 40 min to reduce the amount of P1 transcripts by half, and 53 min to reduce the number of P2 transcripts by half. Because the decay rates of transcripts from both promoters were too low to be measured during this period (Fig. 5), it is likely that transcription from the both promoters ceased during the DECREASE II period.
The actual transcription rates from the two promoters show that transcription from P1 is faster than transcription from P2 throughout exponential growth. Our findings also suggested that the binding kinetics of the CRP-cAMP complex to the gal operon DNA may account for differences between transcription rates from the two promoters. Thus, the faster transcription of P1 during the INCREASE period appears to be due to the activity of cAMP-CRP on the P1 promoter during that time.
Increased number of gal operons transcribed in the cell population
Because the mRNA decay rate remains constant throughout the exponential growth phase, we investigated the reason for the increased number of transcripts during the INCREASE period. This result could be achieved by increased RNAP initiation from a single gal operon over time. Alternatively, more gal operons within the cell population may be transcribed. The CRP-cAMP complex enhances transcription from the P1 promoter by recruiting RNAP to a single gal operon [30] and promoting more rapid open complex formation [31]. At the same time, CRP-cAMP complexes may bind to more gal operons in the cell population. The increased levels of CRP protein and cAMP during the INCREASE period (Figs. 6 and 7) support both possibilities. Stochastic gene expression models [32] suggest that during early exponential growth (OD600 0.05), few gal operons in the cell population are engaged in transcription.
The INCREASE period of P1 transcription is followed by the STEADY-STATE period from 90 min (OD600 0.4) to 175 min (OD600 3.0), during which the transcript doubling time increases slightly from 1.28 min to 1.37 min, and there is no net increase in P1 transcripts. We hypothesize that the number of P1 transcripts reached a plateau because the number of activated gal operons did not change during this time. This hypothesis fails to explain why the transcription rate has changed during the STEADY-STATE period, but may explain the decrease in P1 transcription during the DECREASE period.
Although CRP-cAMP appears to control P1 transcription dynamics, the regulation of P2 transcription is unclear. Results of in vitro experiments suggest GalR as a transcriptional activator for the P2 promoter [33], but the binding dynamics of sigma70-RNAP to the P2 promoter may also be involved.
Models describing RNA polymerase on gal operon DNAs
We demonstrated that under conditions that induce the gal operon, 70% of gal transcripts are initiated from the P1 promoter in exponentially growing E. coli cells, and the remaining 30% are from the P2 promoter. Two possible explanations exist for this distribution of transcripts. In the first model, 70% of the transcriptionally active gal operons in the population produce only P1 transcripts (P1-initiating operons), and 30% produce only P2 transcripts (P2-initiating operons). Thus, RNAPs transcribing a gal operon during a given period used either the P1 or the P2 transcription start site (Fig. 9A). An alternative possibility is that a gal operon produces 70% P1 transcripts and 30% P2 transcripts. In this second model, 70% of the RNAPs initiated transcription at P1 and 30% of the RNAPs initiated transcription at P2 in the same operon (Fig. 9B). The single initiation site model predicts that once a transcription factor binds to its DNA binding site, it remains bound for a long period of time, probably until an intracellular signal induces detachment [34]. In contrast, if P1 and P2 are both used on the same operon DNA, then transcription factors would be expected to transiently bind the DNA and fall off repeatedly. The single initiation model suggests that transcription from the two promoters is likely to occur in different gal operons in different cells or different gal operons within a single cell during exponential replication when multiple chromosome copies exist. We are currently testing these two models using the GFP gene cloned under the gal promoter control.
Figure 9. Models describing RNA polymerase on gal operon DNAs in the cell population.

(A) Single initiation site model: each gal operon in the cell population is transcribed from the P1 promoter only or from the P2 promoter only. (B) Mixed initiation site model: each gal operon in the population is transcribed from both promoters, but at a different frequency from each promoter.
Materials and Methods
Bacterial strains
The bacterial strains used in this study were MG1655, MG1655galR, MG1655crp, MG1655cya, MG1655rsd, and MG1655ssrS. These mutant strains were generated by deleting the corresponding gene from MG1655 by λ red-mediated recombination [35]. The rpoS mutant strain CH1106 (GN122 katF::Tn10) and the ppGpp-deficient strain CF10237 (MG1655 relA spoT) were provided by H. E. Choy (Chonnam National University, Korea).
Cell and RNA preparation
E. coli cells were grown in LB containing 0.5% galactose at 37°C with shaking (250 rpm). A fresh 100-ml culture was started by 1∶100 dilution of an overnight culture in LB with 0.5% galactose. To analyze the same number of cells (1×10⁸) at various time points during the exponential growth phase, the aliquot taken from the bacterial culture was halved at every doubling time (as assessed by optical density): at 10 min, 8 ml cells were taken; at 40 min, 4 ml cells were sampled, and so on until the end of the exponential growth phase (175 min). After 175 min, a volume corresponding to 108 cfu was taken. Cells were harvested by centrifugation and resuspended in 50 µl protoplasting buffer (15 mM Tris-HCl [pH 8.0], 0.45 M sucrose, 8 mM EDTA). Lysozyme (5 µl, 50 mg/ml) was added, and the cells were incubated for 5 min at 25°C. A phenolic detergent (500 µl, TRI Reagent, Molecular Research Center) was added, and the sample was mixed by vortexing for 20 sec and then incubated for 5 min at 25°C. Samples were stored at -70°C overnight. The next day, the samples were thawed at room temperature, and RNA was purified from all samples simultaneously. Chloroform (100 µl, Sigma) was added to the samples, which were vortexed vigorously for 20 sec. After incubation for 10 min at 25°C, the samples were centrifuged at 12 000×g for 15 min at 4°C. The aqueous phase (250 µl) was then transferred to a new tube and mixed with 250 µl isopropanol (Sigma). After the samples were incubated for 10 min at 25°C, the RNA was collected by centrifugation at 12 000 × g for 8 min at 4°C and washed with 1 ml 75% cold ethanol. The precipitated RNA was dissolved in 50 µl of RNA storage buffer (Ambion). RNA concentration was determined by measuring absorbance at 260 nm using the NanoDrop™ spectrophotometer.
Rapid amplification of cDNA ends of gal mRNA
Rapid amplification of cDNA ends (5′-RACE) was initiated by treating total RNA with tobacco acid pyrophosphatase (Epicentre, USA). To ligate the 3′-hydroxyl end of 5S rRNA to the 5′ phosphate end of gal mRNA, a 25-µl reaction containing 10 µl total RNA, 2.5 µl 10× reaction buffer (Ambion), 10 units T4 RNA ligase (Ambion), and 20 units RNasin (Promega) was incubated at 37°C for 4 h. This RNA was purified with a G-50 column (Amersham Biosciences). Using this RNA preparation, real-time reverse transcription-polymerase chain reaction (RT-PCR) and primer extension were performed as previously described [20]. The 5′ RACE assay was used to distinguish mRNAs transcribed from P1 (70-bp) from those transcribed from P2 (75-bp), which differs by five bases at the 5′ end.
Real-time RT-PCR and quantification of P1 and P2 transcripts
Genomic DNA was removed from the RNA samples by Turbo DNA-free™ (Ambion) according to the manufacturer's protocol. The cDNA template was synthesized in a 20-µl reaction containing 2 µg DNase-treated RNA, 4 µl 5X reaction buffer (Toyobo, Japan), 1 µl primer mix, and 1 µl enzyme mix containing ReverTra Ace® reverse transcriptase and RNase inhibitor. After incubating at 37°C for 1 h, the reaction was stopped by heating at 98°C. Primers were designed by Primer 3 software [36]: P1+P2-for, 5′-ATA CCA TAA GCC TAA TGG-3′; P2only-for, 5′-ATT TCA TAC CAT AAG CCT-3′; P1+P2-rev, 5′-ATC ATG ACC GTT TTG CAG-3′. PCR conditions were optimized and all PCR primer sets had same amplification efficiencies. The 10-µl PCR reactions contained 5 µl iQ™ SYBR® Green Supermix (Bio-Rad), 3.6 µl nuclease-free water, 0.2 µl each forward primer (10 µM) and reverse primer (10 µM), and 1 µl cDNA template. Amplification was carried in a CFX96™ system (Bio-Rad) under the following conditions: initial denaturation at 95°C for 3 min, and 35 cycles of denaturation for 10 sec of at 95°C, annealing for 20 sec of at 55.5°C, and elongation for 15 sec at 72°C.
Measurement of mRNA decay
To measure the decay rate of gal transcripts at different growth phases, MG1655 cells were grown as described above. At each sampling time, rifampicin was added to stop the initiation of transcription (final concentration, 500 µg/ml), and cells were analyzed 0, 2, 4, 6, and 8 min after rifampicin treatment. Harvested cells (108 at each time point) were mixed immediately with 10% buffer-saturated phenol in ethanol (1/10 volume) and chilled rapidly to 4°C [21]. RNA preparation, cDNA synthesis, and real-time PCR were performed as described above. The amount of mRNA was plotted against time to determine the decay rate.
Western blot analysis- The CRP antibody was kindly provided by H. Aiba (Nagoya University, Japan). For Western blots, harvested cells (1×10⁹ cells) were resuspended in 300 µl SDS gel-loading buffer (50 mM Tris-Cl [pH 6.8], 100 mM dithiothreitol, 2% (w/v) SDS, 0.1% (w/v) bromophenol blue, 10% (v/v) glycerol, 8 mM MgCl2) and placed in a boiling-water bath for 3 min. The resulting crude cell lysate (10 µl) was separated by 10% polyacrylamide gel electrophoresis. Western blotting was performed as described in the standard cloning manual [37] using the ECL kit (Amersham Biosciences). The film was analyzed with the Gel Doc imaging system (Bio-Rad).
Determination of intracellular cAMP concentration
To determine intracellular cAMP concentrations at different time points, cells were harvested by centrifugation at 12 000×g for 1 min at 4°C. The cells were then resuspended in 20 µl distilled water and boiled for 5 min. The samples were centrifuged at 12 000×g for 5 min at 4°C, and the supernatant (20 µl) was transferred to a new tube and mixed with 60 µl ethanol (Merck, Germany). The mixture was stored at −20°C. Before analysis, the mixture was dried completely by a centrifugal concentrator and resuspended in 200 µl cAMP assay buffer (GE Healthcare, USA). Determination of cAMP concentration was performed with the cAMP Biotrak enzyme immunoassay system (GE Healthcare).
Transcription Kinetics
Kinetics of P1 and P2 transcription showed linear time dependence in the semi-log plot, indicating first-order kinetics. Rate constants were determined from the slope of the semi-log plot, and half-lives were calculated from the rate constants. The change in the number of transcripts (R) over time was:
where kobs is the observed first-order rate constant. However, the observed rate is not the actual increase in transcription because the first-order decay of transcripts during this period was not taken into account. The actual rate constants are given by:
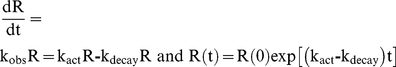 |
where kact is the actual transcription rate constant and kdecay is the actual decay rate constant. The transcript half-life is related to the rate constant as τ = (ln2)/k. The actual doubling time during the INCREASE period was calculated as 1/τact = 1/τobs + 1/τdecay. The actual doubling time and half-life during the STEADY-STATE and DECREASE period were calculated in the same way.
Footnotes
Competing Interests: The authors have declared that no competing interests exist.
Funding: This work was supported by the Korea Science and Engineering Foundation (KOSEF) grant funded by the Korean government (MOST R01-2006-000-10902-0) and by the Korea Research Foundation grant (KRF-2008-2581). The funders had no role in study design, data collection and analysis, decision to publish, or preparation of the manuscript.
References
- 1.Adhya S, Miller W. Modulation of the two promoters of the galactose operon of Escherichia coli. Nature. 1979;279:492–494. doi: 10.1038/279492a0. [DOI] [PubMed] [Google Scholar]
- 2.Musso RE, Di Lauro R, Adhya S, de Crombrugghe B. Dual control for transcription of the galactose operon by cyclic AMP and its receptor protein at two interspersed promoters. Cell. 1977;12:847–854. doi: 10.1016/0092-8674(77)90283-5. [DOI] [PubMed] [Google Scholar]
- 3.Fritz HJ, Bicknase H, Gleumes B, Heibach C, Rosahl S, et al. Characterization of two mutations in the Escherichia coli galE gene inactivating the second galactose operator and comparative studies of repressor binding. EMBO J. 1983;2:2129–2135. doi: 10.1002/j.1460-2075.1983.tb01713.x. [DOI] [PMC free article] [PubMed] [Google Scholar]
- 4.Irani MH, Orosz L, Adhya S. A control element within a structural gene: the gal operon of Escherichia coli. Cell. 1983;32:783–788. doi: 10.1016/0092-8674(83)90064-8. [DOI] [PubMed] [Google Scholar]
- 5.Aki T, Adhya S. Repressor induced site-specific binding of HU for transcriptional regulation. EMBO J. 1997;16:3666–3674. doi: 10.1093/emboj/16.12.3666. [DOI] [PMC free article] [PubMed] [Google Scholar]
- 6.Belyaeva TA, Rhodius VA, Webster CL, Busby SJ. Transcription activation at promoters carrying tandem DNA sites for the Escherichia coli cyclic AMP receptor protein: organisation of the RNA polymerase alpha subunits. J Mol Biol. 1998;277:789–804. doi: 10.1006/jmbi.1998.1666. [DOI] [PubMed] [Google Scholar]
- 7.Roy S, Garges S, Adhya S. Activation and repression of transcription by differential contact: two sides of a coin. J Biol Chem. 1998;273:14059–14062. doi: 10.1074/jbc.273.23.14059. [DOI] [PubMed] [Google Scholar]
- 8.Adhya S. The galactose operon. In: Neidhardt FC, editor. Escherichia coli and Salmonella typhimurium: Cellular and Molecular Biology. Washington DC: American Society for Microbiology; 1987. pp. 1503–1512. [Google Scholar]
- 9.Lee HJ, Jeon HJ, Ji SC, Yun SH, Lim HM. Establishment of an mRNA gradient depends on the promoter: an investigation of polarity in gene expression. J Mol Biol. 2008;378:318–327. doi: 10.1016/j.jmb.2008.02.067. [DOI] [PubMed] [Google Scholar]
- 10.Irani M, Musso R, Adhya S. Cyclic-AMP-dependent switch in initiation of transcription from the two promoters of the Escherichia coli gal operon: identification and assay of 5′-triphosphate ends of mRNA by GTP:RNA guanyltransferase. J Bacteriol. 1989;171:1623–1630. doi: 10.1128/jb.171.3.1623-1630.1989. [DOI] [PMC free article] [PubMed] [Google Scholar]
- 11.Guidi-Rontani C, Danchin A, Ullmann A. Transcriptional control of polarity in Escherichia coli by cAMP. Mol Gen Genet. 1984;195:96–100. doi: 10.1007/BF00332730. [DOI] [PubMed] [Google Scholar]
- 12.Joseph E, Danchin A, Ullmann A. Regulation of galactose operon expression: glucose effects and role of cyclic adenosine 3′,5′-monophosphate. J Bacteriol. 1981;146:149–154. doi: 10.1128/jb.146.1.149-154.1981. [DOI] [PMC free article] [PubMed] [Google Scholar]
- 13.Queen C, Rosenberg M. Differential translation efficiency explains discoordinate expression of the galactose operon. Cell. 1981;25:241–249. doi: 10.1016/0092-8674(81)90249-x. [DOI] [PubMed] [Google Scholar]
- 14.Frohman MA, Dush MK, Martin GR. Rapid production of full-length cDNAs from rare transcripts: amplification using a single gene-specific oligonucleotide primer. Proc Natl Acad Sci U S A. 1988;85:8998–9002. doi: 10.1073/pnas.85.23.8998. [DOI] [PMC free article] [PubMed] [Google Scholar]
- 15.Hengge-Aronis R. Signal transduction and regulatory mechanisms involved in control of the sigma(S) (RpoS) subunit of RNA polymerase. Microbiol Mol Biol Rev. 2002;66:373–395, table of contents. doi: 10.1128/MMBR.66.3.373-395.2002. [DOI] [PMC free article] [PubMed] [Google Scholar]
- 16.Tanaka K, Takayanagi Y, Fujita N, Ishihama A, Takahashi H. Heterogeneity of the principal sigma factor in Escherichia coli: the rpoS gene product, sigma 38, is a second principal sigma factor of RNA polymerase in stationary-phase Escherichia coli. Proc Natl Acad Sci U S A. 1993;90:3511–3515. doi: 10.1073/pnas.90.8.3511. [DOI] [PMC free article] [PubMed] [Google Scholar]
- 17.Jain V, Kumar M, Chatterji D. ppGpp: stringent response and survival. J Microbiol. 2006;44:1–10. [PubMed] [Google Scholar]
- 18.Svitil AL, Cashel M, Zyskind JW. Guanosine tetraphosphate inhibits protein synthesis in vivo. A possible protective mechanism for starvation stress in Escherichia coli. J Biol Chem. 1993;268:2307–2311. [PubMed] [Google Scholar]
- 19.Schmittgen TD, Zakrajsek BA, Mills AG, Gorn V, Singer MJ, et al. Quantitative reverse transcription-polymerase chain reaction to study mRNA decay: comparison of endpoint and real-time methods. Anal Biochem. 2000;285:194–204. doi: 10.1006/abio.2000.4753. [DOI] [PubMed] [Google Scholar]
- 20.Ji SC, Wang X, Jeon HJ, Yun SH, Lee HJ, et al. Quantification of the galactose-operon mRNAs 5 bases different in their 5′-ends. BMB Rep. 2010;43:474–479. doi: 10.5483/bmbrep.2010.43.7.474. [DOI] [PubMed] [Google Scholar]
- 21.Bernstein JA, Khodursky AB, Lin PH, Lin-Chao S, Cohen SN. Global analysis of mRNA decay and abundance in Escherichia coli at single-gene resolution using two-color fluorescent DNA microarrays. Proc Natl Acad Sci U S A. 2002;99:9697–9702. doi: 10.1073/pnas.112318199. [DOI] [PMC free article] [PubMed] [Google Scholar]
- 22.Cavanagh AT, Klocko AD, Liu X, Wassarman KM. Promoter specificity for 6S RNA regulation of transcription is determined by core promoter sequences and competition for region 4.2 of sigma70. Mol Microbiol. 2008;67:1242–1256. doi: 10.1111/j.1365-2958.2008.06117.x. [DOI] [PubMed] [Google Scholar]
- 23.Jishage M, Ishihama A. A stationary phase protein in Escherichia coli with binding activity to the major sigma subunit of RNA polymerase. Proc Natl Acad Sci U S A. 1998;95:4953–4958. doi: 10.1073/pnas.95.9.4953. [DOI] [PMC free article] [PubMed] [Google Scholar]
- 24.Sharma UK, Chatterji D. Differential mechanisms of binding of anti-sigma factors Escherichia coli Rsd and bacteriophage T4 AsiA to E. coli RNA polymerase lead to diverse physiological consequences. J Bacteriol. 2008;190:3434–3443. doi: 10.1128/JB.01792-07. [DOI] [PMC free article] [PubMed] [Google Scholar]
- 25.Yuan AH, Gregory BD, Sharp JS, McCleary KD, Dove SL, et al. Rsd family proteins make simultaneous interactions with regions 2 and 4 of the primary sigma factor. Mol Microbiol. 2008;70:1136–1151. doi: 10.1111/j.1365-2958.2008.06462.x. [DOI] [PMC free article] [PubMed] [Google Scholar]
- 26.Adhya S. Suboperonic regulatory signals. Sci STKE. 2003;2003:pe22. doi: 10.1126/stke.2003.185.pe22. [DOI] [PubMed] [Google Scholar]
- 27.Ullmann A, Joseph E, Danchin A. Cyclic AMP as a modulator of polarity in polycistronic transcriptional units. Proc Natl Acad Sci U S A. 1979;76:3194–3197. doi: 10.1073/pnas.76.7.3194. [DOI] [PMC free article] [PubMed] [Google Scholar]
- 28.Welply JK, Fowler AV, Beckwith JR, Zabin I. Positions of early nonsense and deletion mutations in lacZ. J Bacteriol. 1980;142:732–734. doi: 10.1128/jb.142.2.732-734.1980. [DOI] [PMC free article] [PubMed] [Google Scholar]
- 29.Lee SJ, Trostel A, Le P, Harinarayanan R, Fitzgerald PC, et al. Cellular stress created by intermediary metabolite imbalances. Proc Natl Acad Sci U S A. 2009;106:19515–19520. doi: 10.1073/pnas.0910586106. [DOI] [PMC free article] [PubMed] [Google Scholar]
- 30.Ptashne M, Gann A. Transcriptional activation by recruitment. Nature. 1997;386:569–577. doi: 10.1038/386569a0. [DOI] [PubMed] [Google Scholar]
- 31.Roy S, Lim HM, Liu M, Adhya S. Asynchronous basepair openings in transcription initiation: CRP enhances the rate-limiting step. EMBO J. 2004;23:869–875. doi: 10.1038/sj.emboj.7600098. [DOI] [PMC free article] [PubMed] [Google Scholar]
- 32.Elowitz MB, Levine AJ, Siggia ED, Swain PS. Stochastic gene expression in a single cell. Science. 2002;297:1183–1186. doi: 10.1126/science.1070919. [DOI] [PubMed] [Google Scholar]
- 33.Choy HE, Adhya S. Control of gal transcription through DNA looping: inhibition of the initial transcribing complex. Proc Natl Acad Sci U S A. 1992;89:11264–11268. doi: 10.1073/pnas.89.23.11264. [DOI] [PMC free article] [PubMed] [Google Scholar]
- 34.Yu J, Xiao J, Ren X, Lao K, Xie XS. Probing gene expression in live cells, one protein molecule at a time. Science. 2006;311:1600–1603. doi: 10.1126/science.1119623. [DOI] [PubMed] [Google Scholar]
- 35.Datsenko KA, Wanner BL. One-step inactivation of chromosomal genes in Escherichia coli K-12 using PCR products. Proc Natl Acad Sci U S A. 2000;97:6640–6645. doi: 10.1073/pnas.120163297. [DOI] [PMC free article] [PubMed] [Google Scholar]
- 36.Rozen S, Skaletsky H. Primer3 on the WWW for general users and for biologist programmers. Methods Mol Biol. 2000;132:365–386. doi: 10.1385/1-59259-192-2:365. [DOI] [PubMed] [Google Scholar]
- 37.Sambrook J, Fritsch EF, Maniatis T, Irwin N. Cold Spring Harbor, N.Y.: Cold Spring Harbor Laboratory Press; 1989. Molecular cloning: a laboratory manual. [Google Scholar]