

Abstract
FAS (TNF receptor superfamily member 6, also known as CD95) plays a major role in T-cell apoptosis and is often dysregulated in CTCL. We searched for structural alterations of the FAS gene with the potential to affect its function. Although several heterozygous FAS promoter single nucleotide polymorphisms (SNPs) were detected, the only homozygous one was the -671 GG SNP present in 24/80 CTCL cases (30%). This SNP maps to an interferon response element activated by STAT-1. EMSA and supershift EMSA showed decreased CTCL nuclear protein/STAT-1 binding to oligonucleotides bearing this SNP. Luciferase reporters showed significantly less interferon-alfa responsive expression by FAS promoter constructs containing this SNP in multiple CTCL lines. Finally, FAS was upregulated by interferon-alfa in wildtype CTCL cells but not those bearing the -671 GG SNP. These findings indicate that many CTCL patients harbor the homozygous FAS promoter -671 GG SNP capable of blunting its response to interferon. This may have implications for CTCL pathogenesis, racial incidence and the response of patients to interferon-alfa therapy. In contrast, functionally significant mutations in FAS coding sequences were detected uncommonly. Among CTCL lines with the potential to serve as models of FAS regulation, FAS-high MyLa had both FAS alleles, FAS-low HH was FAS-hemizygous and FAS-negative SeAx was FAS-null.
Keywords: T-cell lymphoma, mycosis fungoides, Sézary syndrome, SNPs, FAS gene
INTRODUCTION
Cutaneous T cell lymphoma (CTCL) is a neoplasm of well differentiated CD4+ memory T cells belonging to the skin associated lymphoid tissue (SALT) [1]. It includes mycosis fungoides (MF) and its erythrodemic and leukemic variant, the Sézary syndrome (SS). There are multiple lines of evidence supporting the hypothesis that early CTCL is primarily a lymphoaccumulative disorder rather than a lymphoproliferative disorder, i.e., that tumor cells persist and accumulate primarily due to defective apoptosis rather than enhanced proliferation. This evidence includes the indolent clinical behavior of early CTCL, its resistance to therapy that targets rapidly proliferating cells, its relatively low proliferative rate as assessed by mitotic index or Mib-1/Ki-67 expression, and its low apoptotic rate as assessed by terminal dUTP nick-end labeling (TUNEL) assay [2,3].
One of the major systems mediating apoptotic activity in T cells is the FAS pathway [4]. FAS dysregulation by CTCL tumor cells has been reported in a variable proportion of cases using a variety of immunohistological, flow cytometric and PCR techniques [3,5-13]. In prior studies of CTCL, we determined that there is a mechanistic connection among FAS transcript level, expression of FAS protein on the cell surface, and functional sensitivity to FAS-mediated apoptosis in vitro [3]. However, structural factors affecting FAS transcript level and integrity in CTCL are largely unexplored. This set the stage for the current study in which we analyzed the primary structure of the FAS gene (see Supplemental Figure 1) in order to search for alterations with the potential to influence FAS expression.
MATERIALS AND METHODS
Cells and Lesional Tissues
CTCL- derived (MyLa, HH, Hut-78, SeAx, SZ4, MJ) and other T-cell lines (Jurkat, JFL) were obtained from multiple sources and cultured as reported previously [3]. CTCL lesional skin and involved blood samples were obtained from our local cutaneous lymphoma tissue bank. Seven blood samples from SS were generously provided by Dr. Alain Rook (University of Pennsylvania). Specimens were collected with informed consent and Institutional Review Board approval.
Flow Cytometry
Surface FAS expression by T-cell lines was determined by staining with FITC or PE conjugated anti-FAS monoclonal antibody DX2 (Becton Dickinson, San Jose, CA). Isotype-matched monoclonal antibodies of irrelevant specificity were used as negative controls as described previously [3]. For interferon experiments, 2 × 10⁵ cells were treated with 100u/ml of interferon-α2b (Merck & Co., Inc., Whitehouse Station, NJ) for 48 hours before staining for surface detection.
Immunohistology
We used a 3-stage murine monoclonal antibody/biotinylated goat anti-mouse IgG/avidin-HRP immunoperoxidase method applied to acetone-fixed frozen sections to assess FAS expression by CTCL and inflammatory skin disease controls. Two different anti-FAS monoclonal antibodies were used: clone APO-1-1 (Alexis, Farmingdale, NY) and clone DX2 (Dako, Carpinteria, CA) [3].
Cytogenetic and FISH Analysis
Cytogenetic analysis was performed as described previously [10,14]. Fluorescence in situ hybridization (FISH) analysis was performed according to the ACT Cytogenetics Laboratory Manual [14,15]. FAS probe was made using established procedures [16] by labeling the BAC Clone RP11-399O19 (chr10:90,718,801-90,775,625), which spans 56.8 kb including FAS promoter, all of the FAS exons/introns but not the nearby gene PTEN. The control probes for the 10 centromere and PTEN were purchased from Vysis (Des Plaines, IL). The 10 centromere probe hybridizes to alpha satellite sequences specific for the chromosome 10 centromere, while the PTEN probe contains sequences that span the PTEN gene at both the 5′ and 3′ ends.
Sequencing of FAS Exons and Promoter
As described previously [3], we used genomic DNA to amplify and sequence the FAS promoter and coding regions (Supplemental Figure 1). Nucleotide numbering of the polymorphisms in the FAS promoter was based on GenBank (accession # X87625) and related reports [17,18]. Coding region and promoter primers are shown in Supplemental Tables 1a, 1b and 1c, respectively. Some samples showing heterozygous FAS promoter polymorphisms by direct sequencing were further confirmed by DNA cloning and subsequent re-sequencing.
Electrophoresis Mobility Shift Assay (EMSA) and Supershift EMSA
Nuclear extracts were prepared from MyLa cells (5 × 10⁶/ml) using the NE-PER nuclear and cytoplasmic extraction reagents kit (Pierce, Rockford, IL). Double-stranded oligonucleotide FAS promoter probes (-663 to -683) were chemically synthesized with wildtype A or SNP G at the -671 site. Probes were labeled using the Biotin 3’ end DNA labeling kit (Pierce, Rockford, IL). The sequence of this oligonucleotide, 5′-TGTCCATTCCAGA/GAACGTCTG-3′, contains a GAS binding site. EMSA was performed using the LightShift Chemiluminescent EMSA kit (Pierce, Rockford, IL). DNA-bound protein was identified by supershift EMSA with an anti-STAT-1 antibody (α-p91 and β-p84, Santa Cruz Biotechnology, Santa Cruz, CA).
Luciferase Reporter Constructs
Generation of DNA fragments with SNPs was performed using the QuikChange II site-directed mutagenesis kit (Stratagene, La Jolla, CA). The constructs and primers used to generate them are shown in Supplemental Table 2. Wildtype and SNP constructs were sequenced to confirm the appropriate promoter and transcription initiator sequences were present and then ligated into pGL3 luciferase basic vector. Plasmid carrying the β-galactosidase gene (2ug/sample) was co-transfected as an internal control. Cells were stimulated by PMA (100ng/ml) immediately after transfection. For interferon stimulation assays, 2 × 10⁶ cells were treated with interferon-α2b (IFN) (100 U/ml) at the time of transfection.
Statistical Analysis
Statistical analysis for the luciferase assays was performed using Student’s t-test. A two-tailed p-value <0.05 was considered statistically significant and is represented as (*) in the figures. Analyses utilized SAS statistical software version 9.2 (SAS Institute, Inc. Cary, NC). Statistical analysis of FAS promoter genotypes among CTCL patients compared to controls was performed using the Chi-square method and two-tailed p values.
RESULTS
Molecular analysis of the FAS promoter region in CTCL demonstrates frequent germline single nucleotide polymorphisms (SNPs)
To search for mutations in regulatory regions of the FAS gene in CTCL, we used automated nucleotide sequencing of genomic PCR products to detect alterations of the 1781 bp FAS promoter immediately upstream of the start codon. We analyzed this region in 29 CTCL cases including 9 early MF (stages IB-IIA), 7 advanced MF and 10 SS (stages IIB-IVA), and 3 CTCL-derived cell lines: MyLa, HH and SZ4. PCR of FAS targets was negative in the SeAx CTCL line, consistent with absence of the FAS gene by FISH analysis (see below). As shown in Table 1, several single nucleotide polymorphisms (SNPs) at known germline SNP sites were detected among 24/29 CTCL cases (83%). Interestingly, each of these SNPs involved a transcription factor binding site including SP1 (-1378, RefSNP ID: rs2234767), AP1 (-1092, RefSNP ID: rs9658675), YY1 (-691, RefSNP ID: rs2234768), GAS (-671, RefSNP ID: rs1800682) and TEF (-436, RefSNP ID: rs9658676). All of these SNPs were heterozygous except for 8/29 CTCL cases (28%) that contained the homozygous -671 GG SNP. Other than these SNPs, no other mutations of the FAS promoter were identified by PCR. This indicates that somatic FAS promoter mutations are absent or rare in CTCL and do not accumulate with disease progression or in response to therapy. Consistent with our results using primarily lesional skin samples, a study of leukemic Sézary cells detected somatic mutations in the FAS promoter only very rarely [9].
Table 1.
Genotypic Frequencies of FAS Promoter SNPs in CTCL
| Nucleotide position (TFBS)1 | CTCL Genotypic Frequencies N = 29 | ||
|---|---|---|---|
| -1378 (Sp1) | GG 76% | GA 24% | AA 0% |
| -1092 (AP1) | GG 97% | GA 3% | AA 0% |
| -691 (YY1) | TT 90% | TC 10% | CC 0% |
| -671 (GAS) | AA 34% | AG 38% | GG4 28% |
| -436 (TEF) | CC 97% | CA 3% | AA 0% |
TFBS: transcription factor binding site.
TFBS were searched using search tools: TESS (Transcription Element Search System: http://www.cbil.upenn.edu/cgi-bin/tess/tess) and TRANSFAC® Public database (http://www.generegulation.com).
In addition to searches of GenBank for FAS promoter polymorphisms, we also scanned the NCBI dsSNP database. This includes SNP maps from the Human Genome Project and SNP frequency data from the Allele Frequency Project of The SNP Consortium. Based on these searches, ten germline SNPs have been mapped within the FAS promoter, ranging from 0.5-50% in allelic frequency within the general population. In addition to the two commonest polymorphisms registered in GenBank (-1378, -671), the three other mutations we detected in CTCL are also reported germline SNPs (-1092, -691, -436), consistent with the interpretation that these are all germline polymorphisms rather than acquired somatic mutations in the CTCL tumor clone.
To assess further the true prevalence of the homozygous -671 GG SNP, we used genomic PCR and automated nucleotide sequencing to determine the genotype of the -671 site in another 51 CTCL cases. These included 10 early MF (stages IA-IIA), 10 advanced MF and 29 SS (stages IIB-IVA), and two CTCL lines (Hut-78 and MJ). To best match our initial data set of 29 cases (27 of which were Caucasian), all additional patients were also Caucasian. In aggregate, the -671 GG SNP was detected in 24/80 CTCLs (30%). The genotypic distribution among the 80 CTCL cases was 23 AA, 33 AG and 24 GG.
Some of our CTCL cases exhibited more than one FAS promoter SNP. All of these multiple SNPs were heterozygous. Four cases had the -1378A/-671G combination. One case each had the -1092A/-671G or -1378A/-671G/-436A combination. Interestingly, the FAS promoter in the Jurkat T cell line was heterozygous for C/T within the YY1 element at nt -691, as confirmed by cloning and sequencing (Supplemental Figure 2a). Although not previously reported in Jurkat, this is a known SNP found in approximately 20% of the general population.
The -671 G SNP reduces STAT-1 binding to the FAS promoter
We used electrophoretic mobility shift assays (EMSA) to determine the effect of the -671 G SNP on the binding of nuclear proteins extracted from the MyLa CTCL line. As shown in Figure 1, FAS promoter oligonucleotide probe containing the G SNP binds less nuclear protein than the wildtype A probe. Furthermore, anti-STAT-1 antibody supershifted the protein-probe complex, indicating that the bound nuclear protein is rich in STAT-1.
Figure 1. EMSA and supershift EMSA show reduced CTCL nuclear protein/STAT-1 binding to FAS promoter oligonucleotide probe bearing the -671 G SNP.
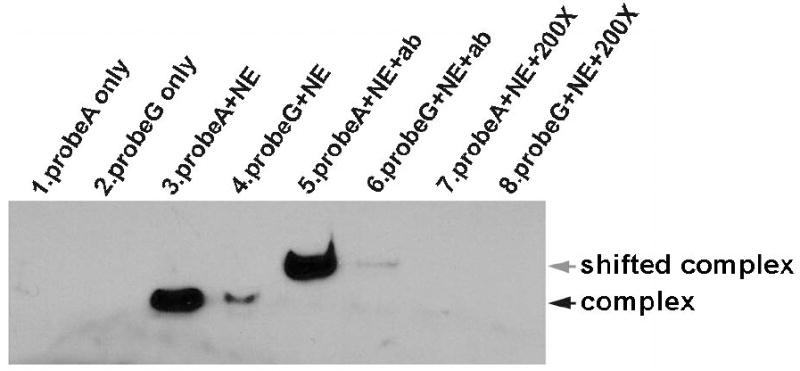
Lanes 3 and 4 show that labeled wildtype FAS promoter oligonucleotide probe A forms complexes better with CTCL (MyLa) nuclear protein extract (NE) than does labeled oligonucleotide probe G bearing the -671 G SNP. Lanes 5 and 6 show that anti-STAT-1 antibody (ab) supershifts these same complexes, consistent with the presence of STAT-1 transcription factor. Lanes 1 and 2 are controls containing only labeled probes that are much smaller and migrate off bottom of gel. Lanes 7 and 8 are also controls that show 200-fold excess of unlabeled probes (200X) can block binding of labeled probes A and G to nuclear protein extracts.
Luciferase reporter constructs demonstrate that the FAS promoter SNPs detected in CTCL can reduce FAS promoter function
To determine if FAS promoter mutations can affect FAS transcription (and thereby FAS protein expression and apoptotic sensitivity), luciferase reporter constructs containing the homozygous equivalent of the FAS promoter SNPs detected among our CTCL samples were tested for transcriptional activity in CTCL and other T-cell tumor lines. Reporter activity was compared to the homozygous equivalent of the wild-type promoter sequence. As shown in Figure 2, the wild-type sequence generally showed the greatest activity except for constructs containing the -436A SNP which exhibited enhanced activity. This confirmed the ability of our assay to detect both increases and decreases in reporter activity. The -1378 solitary SNP had little impact on promoter function. Otherwise, constructs containing individual SNPs trended toward lower luciferase activity with statistically significant (p < 0.05) reductions relative to wild-type promoter in 5/5 CTCL and 2/2 Jurkat cell lines for constructs containing the -671 G SNP, and in 3/4 CTCL lines for the -1092 A SNP.
Figure 2. FAS promoter SNPs can alter basal promoter activity.
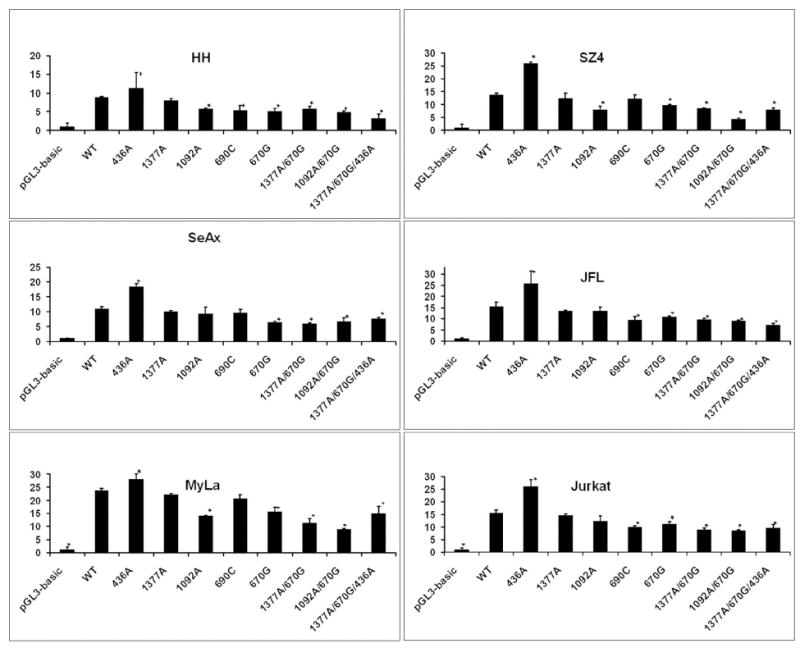
Luciferase reporter constructs show that most individual SNPs and SNP combinations resulted in decreased promoter function. Y axis shows luciferase levels. Asterisks (*) mark results that were statistically significant relative to wildtype.
The -671 G SNP reduces the response of the FAS promoter to interferon-alfa
The T-cell lines used in this study have the following -671 FAS promoter genotype: AA (Jurkat, JFL), AG (MyLa, Hut-78, SZ4), GG (MJ), hemizygous A (HH) and FAS-null (SeAx). As shown in Figure 3, there is no simple correlation between these genotypes and the level of basal FAS expression. However, the -671 SNP lies within a “gamma activating site” (GAS) that is responsive to interferons that act through the JAK/STAT pathway to activate STAT transcription factors that bind to this site and regulate FAS promoter function. To determine the impact of the -671 G SNP on FAS promoter function, multiple CTCL lines were transfected with luciferase reporter constructs containing either -671 wildtype A or SNP G in the FAS promoter (Figure 4). Confirming our earlier experiments shown in Figure 2, baseline promoter function was significantly reduced in the -671 G constructs relative to the wildtype construct in all five CTCL lines (p < 0.04). Furthermore, relative to wildtype, the -671 G construct also showed a significantly reduced response to interferon-alfa in all five CTCL lines (p < 0.03).
Figure 3. No simple correlation between basal FAS protein expression and -671 SNP genotype.
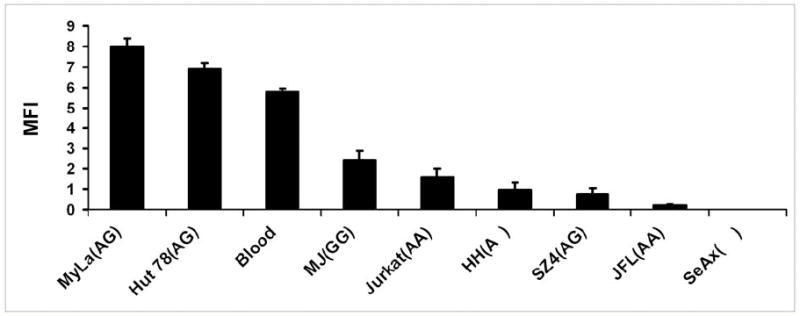
Flow cytometric analysis of neoplastic T cell lines with different -671 SNP genotypes: AA (Jurkat, JFL), AG (MyLa, Hut-78, SZ4), GG (MJ), hemizygous A (HH) and FAS null (SeAx) as well as pooled mononuclear blood cells from three normal donors. Y axis shows cell surface FAS protein levels.
Figure 4. Luciferase reporter constructs bearing the FAS promoter -671 G SNP exhibit reduced response to interferon-alfa.

Asterisks (*) show that both baseline and interferon-stimulated activity of the -671 G SNP reporter were significantly less than that of the wildtype (-671 A) reporter. Y axis shows luciferase levels.
The -671 GG genotype correlates with resistance to interferon-alfa induced upregulation of FAS protein
To confirm that the reporter data were relevant to actual FAS protein expression, we determined the effect of interferon-alfa on cell surface FAS expression by neoplastic T cells bearing either the homozygous -671 GG SNP or the homozygous -671 AA wildtype genotype. As shown in Figure 5, CTCL line MJ (-671 GG) had no response to interferon while freshly isolated SS blood cells from patient LM (-671 AA) and the Jurkat line (-671 AA) showed significant FAS upregulation (p < 0.05). Even CTCL line HH (hemizygous for -671A) was able to respond significantly to interferon, underscoring the importance of even a single wildtype allele for interferon responsiveness.
Figure 5. CTCL cell bearing the FAS promoter -671 GG SNP do not upregulate FAS protein in response to interferon-alfa.
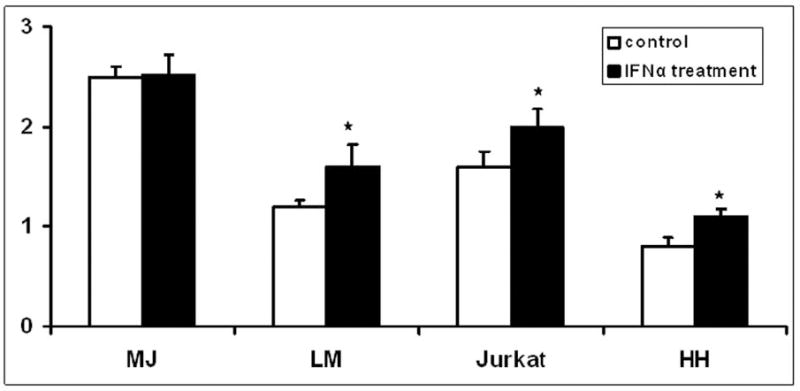
Flow cytometric analysis of neoplastic T cells with the homozygous -671 GG SNP (MJ CTCL line) compared to -671 AA wildtype (LM Sezary cells and Jurkat cell line) and -671 A hemizygous CTCL line HH. Presence of the -671 A wildtype allele but not the -671 GG genotype correlated with interferon responsiveness. Y axis shows cell surface FAS protein levels. Asterisks (*) mark results that were statistically significant relative to no-treatment controls.
Molecular analysis of the FAS coding region in CTCL demonstrates significant mutations in only a small minority of cases
A schematic diagram of the FAS gene is shown in Supplemental Figure 1. We used a combination genomic PCR, cDNA PCR and nucleotide sequencing to screen for mutations in all nine FAS exons in 20 cases of CTCL (9 early MF (stages IB-IIA), 7 advanced MF and 1 SS (stages IIB-IVA), and 3 CTCL cell lines: MyLa, HH, SZ4). Genomic DNA was sequenced in each case to maximize detection of exon mutations that might be under-represented in cDNA due to surveillance mechanisms such as nonsense modulated mRNA decay. The tolerability of amino acid substitutions was calculated using the SIFT score which represents the normalized probability that the amino acid change will be tolerated functionally [19]. Based on this analysis, we found functionally significant mutations in only 2/20 samples (Table 2 and Supplemental Figure 2b). These involved Exon 9 frameshifts that led to a truncated FAS protein lacking an intact death domain and an Exon 8 amino acid substitution predicted to interfere with FAS function. The few other amino acid substitutions detected were not predicted to be functionally significant (Table 2).
Table 2.
Exon mutations found in 3/20 CTCL cases.
| Case | Exon | Mutation 1 | Consequence |
|---|---|---|---|
| 5 | 9 | Ins A at nt 1055 | Frameshift (truncated) |
| Ins T at nt 1081 | Frameshift (truncated) | ||
| 6 | 8 | A to T at nt 1018 | Leu to Phe (SIFT 0.07) 2 Borderline tolerated |
| 9 | C to A at nt 1116 | Ala to Asp (SIFT 0.47) Tolerated | |
| 7 | 6 | C to G at nt 865 | Asn to Lys (SIFT 0.92) Tolerated |
| T to A at nt 878 | Cys to Ser (SIFT 0.44) Tolerated | ||
The mutation positions were designated from FAS mRNA sequence (GenBank access# NM_000043).
The SIFT score is the normalized probability that the amino acid change is tolerated. Not tolerated (<0.05); borderline tolerated (0.05-0.1); tolerated (>0.1).19
Cytogenetic and FISH analyses demonstrate chromosome 10 losses in CTCL lines with low or absent FAS expression
In order to better utilize existing CTCL lines as models for future studies of FAS regulatory pathways, we performed an in-depth characterization of FAS gene copy number in selected CTCL lines. Cytogenetic analysis indicated the presence of the chromosome 10 pair and FAS gene (10q24.1) in FAS-high MyLa, absence of one 10q region in FAS-low HH, and absence of the chromosome 10 pair in FAS-negative SeAx (see Figure 6). Fluorescent in situ hybridization (FISH) analysis was performed on two hundred interphase nuclei from each T-cell line using a probe specific for FAS together with control probes. There was complete absence of FAS genes in SeAx. Nevertheless, FISH analysis of SeAx detected signals for the chromosome 10 centromere and the PTEN gene (10q23) which is situated near the FAS gene locus. None of the SeAx nuclei showed signals for the FAS gene while positive control cells demonstrated two FAS gene signals in each cell. Therefore, PTEN signals are from disrupted chromosome 10 material retained in SeAx. SeAx cells were often tetraploid with four PTEN and four chromosome 12q control signals. HH demonstrated only one copy of FAS together with two control signals in 133 cells (66.5%), and two copies of FAS with four copies of the control gene in 67 tetraploid cells. These results indicate that one copy of FAS has been lost, and that tetraploidy is about 33%. MyLa demonstrated two copies of FAS and 2 control signals in 184 cells, while 10 cells had 4 FAS and 4 control signals, consistent with minor tetraploidy. Six cells had only a single control signal but still 2 copies of the FAS gene. These results are consistent with presence of two copies of the FAS gene overall.
Figure 6. Karyotyping and FISH analysis of CTCL lines.
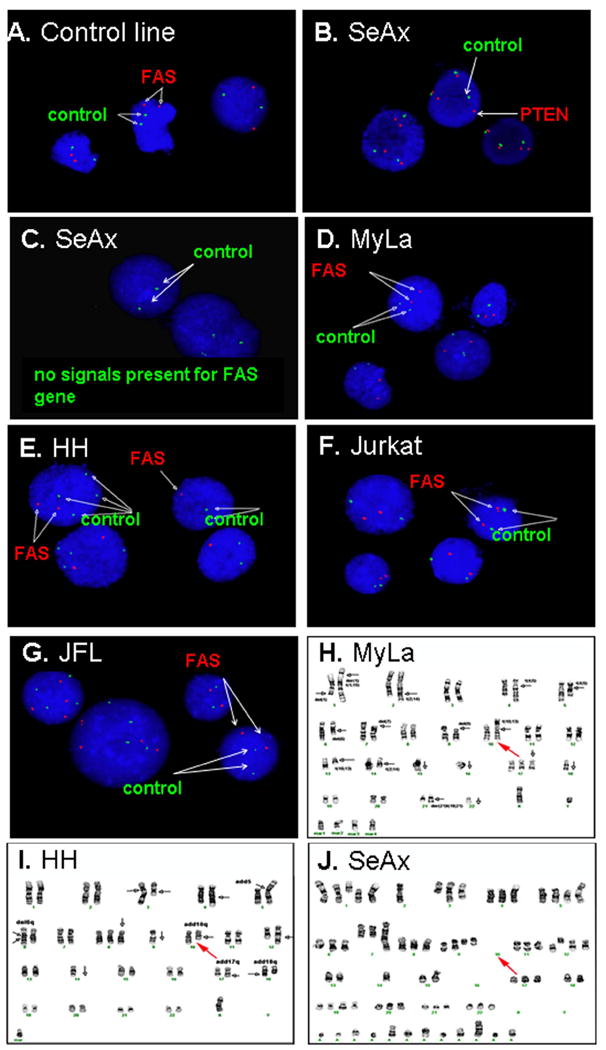
FAS targeted FISH analysis of multiple T-cell lines, and karyotypic analysis of MyLa, HH and SeAx CTCL lines. A shows FISH results of a FAS-positive control cell line CLG 2144, both FAS (red) and Chromosome12q control (green) signals are present. B and C show the FISH results of SeAx cell line. Although signals are detectable for PTEN (red) (B) and control Chromosome 12q (green) (B and C), there is no FAS signal (red) (C). D, E, F and G show FISH results for MyLa, HH, Jurkat and JFL, respectively. H, I and J are karyotyping results for MyLa, HH and SeAx, respectively. As indicated by the red arrows, Chromosome 10 is complete in MyLa; one of the long arms of Chromosome 10 is deleted in HH; and the intact chromosome 10 pair containing FAS is absent in SeAx.
Jurkat (which expresses FAS at moderate levels) demonstrated two copies of FAS in 194 cells, 4 of which had lost the control signal, as well as 6 tetraploid cells with four copies of both FAS and the 12q control. JFL (a FAS-low variant of Jurkat) demonstrated two copies of FAS together with two control signals in 155 cells (77.5%) and 4 copies of each in 45 tetraploid cells (22.5%). There were 3 tetraploid cells that lost either one copy of the control (1 cell) or one copy of FAS (2 cells). Therefore, there was generally no evidence of FAS loss in either Jurkat or JFL.
In aggregate, these findings indicate that existing CTCL lines can serve as models for roughly normal (MyLa, Jurkat, JFL), hemizygous (HH) and null (SeAx) FAS gene complements. In particular, the FAS-null SeAx line has the potential to serve as a substrate for functional studies of transfected FAS gene variants.
DISCUSSION
Because most promoter mutations result in reduced or lost function, we hypothesized that germline SNPs involving the FAS promoter in CTCL could potentially contribute to FAS dysregulation via their impact on FAS transcription, especially since all the SNPs we detected were within transcription factor binding sites. Although CTCL has not been studied previously, prior work has shown that mutations in AP1, GABP and GAS elements of the FAS promoter in other cell types can influence FAS promoter function and consequent levels of tumor cell FAS transcript and protein as well as circulating soluble FAS protein [4,20-27]. As shown in Figure 2, we used CTCL lines to provide proof of principle for this concept in CTCL by demonstrating decreased FAS promoter function in luciferase reporter constructs corresponding to homozygous versions of the actual transcription factor binding site SNPs we detected among our CTCL samples. When combined with the reduced STAT-1 binding (Figure 1), the blunted response of both FAS reporters and FAS protein expression to interferon-alfa (Figures 4 and 5) and a similarly diminished response to interferon-gamma reported previously [20-22,26,27], it is likely that FAS promoter SNPs like the homozygous -671 GG are relevant to the tumor response to endogenous and therapeutic interferons whose mechanism of action involves the regulation of FAS expression via STAT transcription factor binding. Furthermore, as shown in Figure 5, the presence of even one copy of the wildtype allele in the hemizygous HH CTCL line was sufficient to maintain sensitivity to upregulation of FAS by interferon-alfa.
MyLa and Hut-78 (both heterozygous for the -671 SNP) expressed high levels of FAS transcript and protein (Figure 3). This suggests that the functional impact of a single copy of the -671 G SNP found in several heterozygous CTCL cases is likely to be minimal. Furthermore, although the level of FAS protein expressed by MJ (which is homozygous for the -671 G SNP) was well below that of normal blood lymphoid cells (Figure 3), it was still greater than that of other T-cell lines containing one or both wildtype alleles (Jurkat, HH and SZ4). Therefore, the status of the -671 SNP is unlikely to control basal FAS expression which is probably the net result of a multiplicity of factors impacting promoter function. A case in point is the JFL line which is a very FAS-low variant of Jurkat (Figure 3) yet shares the same -671 AA genotype. This interpretation is consistent with our prior immunohistologic and flow cytometric studies which have shown that FAS protein expression is low in a larger proportion of CTCL cases and lines than the 30% that bear the homozygous -671 GG SNP [3]. It is clear from our own work [28] and others [9] that additional factors such as DNA methylation can affect basal FAS expression in CTCL. Therefore, the -671 GG SNP, which does not involve CpG islands subject to regulation by methylation, is likely more important for governing responses to interferons than governing basal FAS expression in general.
Because the -671 GG SNP appears to reduce the responsiveness of the FAS promoter to interferons, it may promote a TH1/TH2 imbalance favoring TH2 cells which are normally down-regulated by interferon produced by TH1 and other cells. CTCL has been postulated to arise from the TH2 T-cell subset, so this imbalance might provide fertile soil for the development of CTCL. The -671 GG SNP may also help explain racial differences in CTCL incidence. Relative to Caucasians, African Americans have an increased incidence of CTCL (~1.5-fold) and also an increased frequency of the -671 GG SNP (~ 4-fold) [29,30] (African American frequencies at: http://www.ncbi.nlm.nih.gov/projects/SNP/snp_ref.cgi?rs=1800682). Given these observations, it will be important to perform follow-up studies to determine the prevalence of the -671 GG SNP among both Caucasians and African-Americans with CTCL relative to controls, the impact of this SNP on the clinical response of CTCL patients to treatment with interferons, and the impact of this SNP on the response of normal T cells, melanomas and other tumors to interferons and other factors that act through STAT transcription factors. For example, among Caucasian CTCL patients in our current study, the 30% prevalence of the -671 GG SNP (24/80) was significantly higher (p < 0.03) than its 20% prevalence among Caucasian controls aggregated from multiple sources (217/1097) [31] (and NCBI-SNP database: http://www.ncbi.nlm.nih.gov/projects/SNP/snp_ss.cgi?subsnp_id=24084001,id=66857087,andid=13453099).
As shown in Table 2, functionally significant mutations (presumably somatic rather than germline) affecting the FAS coding region were relatively uncommon (2/20 CTCLs). The low prevalence of these FAS exon mutations is consistent with a few prior studies and suggests that overall they are relatively uncommon in CTCL [32,33]. This indicates that while FAS coding region mutations causing abnormal protein structure might account for reduced FAS protein detection and/or resistance to apoptosis in a small minority of CTCL cases, they cannot explain the phenomenon generally. Nevertheless, treatments aimed at restoration of silenced but otherwise normal FAS could prove problematic in this subset of CTCL cases.
Cytogenetic and FISH analysis showed gross FAS gene abnormalities in 2/3 CTCL lines. Presumably, these major genetic defects were somatic alterations restricted to the donors’ CTCL tumor cells. Nevertheless, there was an interesting correlation between these genetic abnormalities and the level of FAS cell surface protein expression. In contrast to the presence of the chromosome 10 pair and its FAS alleles (10q24.1) in FAS-high MyLa, there was absence of one 10q region in FAS-low HH, and complete absence of FAS genes in FAS-negative SeAx (see Figure 3 for FAS levels of these lines). These data provide one potential explanation for the low and absent FAS protein expression characteristic of HH and SeAx, respectively [3]. They also define key features of these cell lines that will make them useful models for future studies of the FAS pathway. Their potential clinical relevance is underscored by recent studies that have used comparative genomic hybridization arrays to document recurrent loss of heterozygosity of the chromosome 10q24 region containing the FAS gene in SS tumor cells [34,35]. Of particular relevance to our current findings, loss of heterozygosity could convert a tumor with a heterozygous -671 AG FAS promoter genotype into one with a hemizygous -671 G genotype that would acquire interferon-alfa resistance due to loss of its only wildtype allele.
Conclusions
Our study shows that many CTCL patients harbor the homozygous FAS promoter -671 GG SNP capable of blunting the promoter’s response to interferon mediated by STAT1. In contrast, functionally significant mutations in FAS coding sequences were detected uncommonly. Among CTCL lines with the potential to serve as models of FAS regulation, FAS-high MyLa had both FAS alleles, FAS-low HH was FAS-hemizygous and FAS-negative SeAx was FAS-null.
Supplementary Material
Acknowledgments
none.
Funding for this project was provided by Merit Review funding from the Department of Veterans Affairs (Dr. Wood), and the UW Institute for Clinical and Translational Research and by grant 1UL1RR025011 from the Clinical and Translational Science Award (CTSA) program of the NCRR, NIH.
Abbreviations and acronyms
- CTCL
cutaneous T-cell lymphoma
- SNP
single nucleotide polymorphisms
- SS
Sézary syndrome
Footnotes
Disclosure/Duality of Interest: The authors state no conflict of interest.
Publisher's Disclaimer: This is a PDF file of an unedited manuscript that has been accepted for publication. As a service to our customers we are providing this early version of the manuscript. The manuscript will undergo copyediting, typesetting, and review of the resulting proof before it is published in its final citable form. Please note that during the production process errors may be discovered which could affect the content, and all legal disclaimers that apply to the journal pertain.
References
- 1.Wood GS. The Benign and Malignant Cutaneous Lymphoproliferative Disorders Including Mycosis Fungoides. Williams and Wilkins; Baltimore: 2001. [Google Scholar]
- 2.Meech SJ, Edelson R, Walsh P, Norris DA, Duke RC. Ann NY Acad Sci. 2001;941:46–58. doi: 10.1111/j.1749-6632.2001.tb03710.x. [DOI] [PubMed] [Google Scholar]
- 3.Wu J, Nihal M, Siddiqui J, Vonderheid EC, Wood GS. J Invest Dermatol. 2009;129:1165–73. doi: 10.1038/jid.2008.309. [DOI] [PubMed] [Google Scholar]
- 4.Li XR, Chong AS, Wu J, Roebuck KA, Kumar A, Parrillo JE, Rapp UR, Kimberly RP, Williams JW, Xu X. J Biol Chem. 1999;274:35203–10. doi: 10.1074/jbc.274.49.35203. [DOI] [PubMed] [Google Scholar]
- 5.Braun FK, Fecker LF, Schwarz C, Walden P, Assaf C, Dürkop H, Sterry W, Eberle J. J Invest Dermatol. 2007;127:2425–37. doi: 10.1038/sj.jid.5700868. [DOI] [PubMed] [Google Scholar]
- 6.Contassot E, Kerl K, Roques S, Shane R, Gaide O, Dupuis M, Rook AH, French LE. Blood. 2008;111:4780–87. doi: 10.1182/blood-2007-08-109074. [DOI] [PubMed] [Google Scholar]
- 7.Debusscher C, Simonart T. Br J Dermatol. 2001;144:903. doi: 10.1046/j.1365-2133.2001.04156.x. [DOI] [PubMed] [Google Scholar]
- 8.Dereure O, Llanos F, Portales P, Clot J, Guilhou JJ. J Invest Dermatol. 2001;118:949–56. doi: 10.1046/j.1523-1747.2002.17373.x. [DOI] [PubMed] [Google Scholar]
- 9.Jones CL, Wain EM, Chu CC, Tosi I, Foster R, McKenzie RC, Whittaker SJ, Mitchell TJ. J Invest Dermatol. 2010;130:1116–25. doi: 10.1038/jid.2009.301. [DOI] [PubMed] [Google Scholar]
- 10.Meisner LF, Johnson JA. Methods. 2008;45:133–41. doi: 10.1016/j.ymeth.2008.03.005. [DOI] [PubMed] [Google Scholar]
- 11.Osella-Abate S, Zaccagna A, Savoia P, Quaglino P, Salomone B, Bernengo MG. J Am Acad Dermatol. 2001;44:40–47. doi: 10.1067/mjd.2001.108376. [DOI] [PubMed] [Google Scholar]
- 12.van Doorn R, Dijkman R, Vermeer MH, Starink TM, Willemze R, Tensen CP. Cancer Res. 2002;62:5389–92. [PubMed] [Google Scholar]
- 13.Zoi-Toli O, Vermeer MH, DeVries E, Van Beek P, Meijer CJ, Willemze R. Br J Dermatol. 2000;143:313–19. doi: 10.1046/j.1365-2133.2000.03656.x. [DOI] [PubMed] [Google Scholar]
- 14.Barch MJ. ACT Cytogenetics Laboratory Manual. 2. Raven Press; New York: 1991. [Google Scholar]
- 15.Richards SC. American College of Medical Genetics, Standards and Guidelines for Clinical Genetics Laboratories. 2006 [Google Scholar]
- 16.Cox WG, Singer VL. Biotechniques. 2004;36:114–22. doi: 10.2144/04361RR02. [DOI] [PubMed] [Google Scholar]
- 17.Cappellesso S, Valentin JF, Giraudeau B, Boulanger MD, Al-Najjar A, Büchler M, Halimi JM, Nivet H, Bardos P, Lebranchu Y, Watier H. Nephrol Dial Transplant. 2004;19:439–43. doi: 10.1093/ndt/gfg548. [DOI] [PubMed] [Google Scholar]
- 18.Bolstad AI, Wargelius A, Nakken B, Haga HJ, Jonsson RJ. J Rheumatol. 2000;27:2397–405. [PubMed] [Google Scholar]
- 19.Ng PC, Henikoff S. Nucleic Acids Research. 2003;13:3812–3814. doi: 10.1093/nar/gkg509. [DOI] [PMC free article] [PubMed] [Google Scholar]
- 20.Farre L, Bittencourt AL, Silva-Santos G, Almeida A, Silva AC, Decanine D, Soares GM, Alcantara LC, Van Dooren S, Jr, Galvão-Castro B, Vandamme AM, Van Weyenbergh J, Leukoc J. Biol. 2008;83:220–22. doi: 10.1189/jlb.0407198. [DOI] [PubMed] [Google Scholar]
- 21.Huang QR, Manolios NI. Pathology. 2000;32:126–30. doi: 10.1080/003130200104376. [DOI] [PubMed] [Google Scholar]
- 22.Kanemitsu S, Ihara K, Saifddin A, Otsuka T, Takeuchi T, Nagayama J, Kuwano M, Hara T. J Rheumatol. 2002;29:1183–88. [PubMed] [Google Scholar]
- 23.Li C, Larson D, Zhang Z, Liu Z, Strom SS, Gershenwald JE. Pharmacogenet Genomics. 2006;16:253–63. doi: 10.1097/01.fpc.0000199501.54466.de. [DOI] [PubMed] [Google Scholar]
- 24.Mahfoudh W, Bel Hadj Jrad B, Romdhane A, Chouchane L. Int J Immunogenet. 2007;34:209–12. doi: 10.1111/j.1744-313X.2007.00676.x. [DOI] [PubMed] [Google Scholar]
- 25.Nolsøe RL, Kelly JA, Pociot F, Moser KL, Kristiansen OP, Mandrup-Poulsen T, Harley JB. Genes Immun. 2005;6:699–706. doi: 10.1038/sj.gene.6364259. [DOI] [PubMed] [Google Scholar]
- 26.Park JY, Lee WK, Jung DK, Choi JE, Park TI, Lee EB, Cho S, Park JY, Cha SI, Kim CH, Kam S, Jung TH, Jheon S. Clin Cancer Res. 2009;5:1794–800. doi: 10.1158/1078-0432.CCR-08-1770. [DOI] [PubMed] [Google Scholar]
- 27.Sibley K, Rollinson S, Allan JM, Smith AG, Law GR, Roddam PL, Skibola CF, Smith MT, Morgan GJ. Cancer Res. 2003;63:4327–30. [PubMed] [Google Scholar]
- 28.Wu J, Wood GS. Arch Dermatol. In press. [Google Scholar]
- 29.Bolstad AI, Wargelius A, Nakken B, Haga HJ, Jonsson R. Blood. 2009;113:5064–73. [Google Scholar]
- 30.Criscione VD, Weinstock MA. Arch Dermatol. 2007;143:854–9. doi: 10.1001/archderm.143.7.854. [DOI] [PubMed] [Google Scholar]
- 31.Scott K, Adamson PJ, Willett EV, Worrillow LJ, Allan JM. Haematologica. 2008;93:1597–600. doi: 10.3324/haematol.13159. [DOI] [PubMed] [Google Scholar]
- 32.Dereure O, Levi E, Vonderheid EC, Kadin ME. J Invest Dermato. 2002;118:895–96. doi: 10.1046/j.1523-1747.2002.01794.x. [DOI] [PubMed] [Google Scholar]
- 33.Nagasawa T, Takakuwa T, Takayama H, Dong Z, Miyagawa S, Itami S, Yoshikawa K, Aozasa K. Oncology. 2004;67:30–34. doi: 10.1159/000080999. [DOI] [PubMed] [Google Scholar]
- 34.Caprini E, Cristofoletti C, Arcelli D, Fadda P, Citterich MH, Sampogna F, Magrelli A, Censi F, Torreri P, Frontani M, Scala E, Picchio MC, Temperani P, Monopoli A, Lombardo GA, Taruscio D, Narducci MG, Russo G. Cancer Res. 2009;69:8438–46. doi: 10.1158/0008-5472.CAN-09-2367. [DOI] [PubMed] [Google Scholar]
- 35.Laharanne E, Oumouhou N, Bonnet F, Carlotti M, Gentil C, Chevret E, Jouary T, Longy M, Vergier B, Beylot-Barry M, Merlio JP. J Invest Dermatol. 2010;130:1707–18. doi: 10.1038/jid.2010.8. [DOI] [PubMed] [Google Scholar]
Associated Data
This section collects any data citations, data availability statements, or supplementary materials included in this article.