Abstract
A label free immunosensor for detection of Fc receptors expressed on cell surface was developed and characterized by Quartz Crystal Microbalance (QCM) transducer. Taking advantage of the characteristics of single chain fragment variable (scFv) recombinant antibody and the multivalency of an antibody, the engineered recombinant scFv was immobilized onto pre-formed functionalized self-assembled monolayers (SAMs) template surface. The monomeric ScFv can bind with the CH1 region of any rabbit IgG to form a highly oriented IgG layer with its Fc portion pointing toward solution phase. This results in a highly oriented Fc sensor that can be used to study the thermodynamics and kinetics of binding between Fc portion of immunoglobulin and cell surface Fc receptor (FcR), an important area of the immune system. The Fc sensor was used to study the binding between Staphylococcus aureus (S. aureus) and Macrophage with Fc receptor. Parallel characterization of cell surface Fc receptors in the same samples by ELISA was also performed.
Keywords: Quartz Crystal Microbalance (QCM), Single chain fragment variable (ScFv), Fc receptor, Staphylococcus aureus, Macrophage, ELISA
INTRODUCTION
Fc receptor (FcR) is a protein present on a variety of cells, such as natural killer cells, macrophages, neutrophils, dendritic cells and mast cells, for the binding with Fc domain of immunoglobulins. The binding between FcR and immunoglobulins plays important roles in the initiation and regulation of numerous immunological and inflammatory processes.1 Protein A (M.W. 40 – 60 KDa) is a well-known FcR that can specifically bind to Fc portion of various classes and subclasses of immunoglobulins, especially immunoglobulin G (IgG), through interaction with the heavy chain of IgG. Protein A , was originally found in the cell wall of the S. aureus, a gram-positive bacterium. All but 1 of 143 strains of S. aureus were positive for protein A, whereas all 34 strains of Staphylococcus hyicus and 123 of 127 strains of Staphylococcus intermedius were devoid of this cell wall component.2, 3 Similarly, the Fc receptors that exist on macrophages and many lymphocytes can specifically bind with Fc domain of IgG. The binding site on IgG is localized within the Cγ3 homology regions of the heavy chains. The intrinsic affinity of the Fc receptor for IgG ranges from 106 to 108 M−1 depending on species and subclass of IgG. The most definitive studies on mouse macrophages indicate that IgG2a rapidly associates and dissociates from the receptor.4 The overall reaction is exothermic; increasing temperature lowers the intrinsic affinity. The Fc receptor, in common with many other membrane components, may be capped by polyvalent ligands under permissive conditions and capping is inhibited by azide. The unique binding of macrophage FcR with IgG not only can mediate a variety of activities such as endocytosis, cellular cytotoxicity5–7 but also can regulate the formation of several important inflammatory agents, such as, leukotrienes and proteases.8–10 Therefore, the Fc receptor presence on the cell surface is an accepted criterion for the study and identification of cells such as S. aureus and macrophage, and also can be used for profiling cell surface antigen expression.
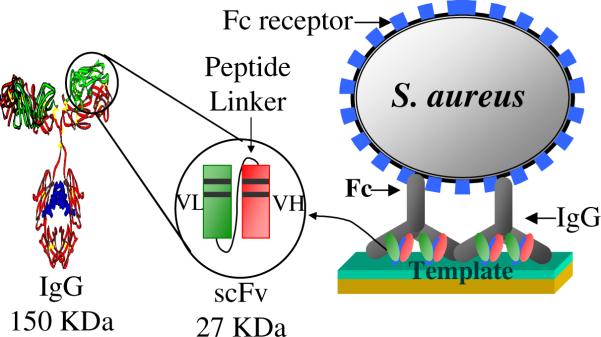
The monomeric A10B scFv can be use to form a uniform 2:1 binding with rabbit IgG CH1 region,11 this results in a highly oriented IgG Fc portion pointing toward solution phase for their binding with the Fc receptor (e.g. protein A). Thus, this bio-interface can be used to detect and measure cell surface Fc receptors. Among the A10B scFvs engineered with various linker sequences, A10B scFv-RG3 showed the most efficient immobilization via electrostatic interaction on a SAM template with anionic functional group and exhibited the highest sensitivity and selectivity.12 Therefore, A10B scFv-RG3 immobilized via anionic template 11-mercaptoundecanoic acid (MUA) was selected to demonstrate the feasibility of this new Fc immunosensor approach.
As illustrated in Scheme 1, A10B scFv-RG3 was immobilized onto preformed anionic SAM template which bound with rabbit IgG. This allows oriented immobilization of Fc portion of IgG to bind with cell surface Fc receptors. This sandwich antibody assay ensured the specific orientation of Fc portion of an IgG that can consistently increase the analyte-binding capacity.
Scheme 1.
Schematic presentation of Fc sensor for the detection of cell's surface Fc receptor
MATERIALS AND METHODS
Chemicals and Materials
Rabbit IgG (I-5006), bovine serum albumin (BSA, A-4503), goat anti-rabbit IgG (R-2004), protein A (P-6031), mouse anti protein A biotin conjugate (B-4931) and 11-mercaptoundecanoic acid (MUA, cat# 450561) were purchased from Sigma Inc. Streptaviding-HRP conjugate (0160130084) was purchased from Jackson Immuno-Research Laboratories. The peroxidase conjugated Anti-E tag monoclonal antibody (27941301) was obtained from Amersham Biosciences. Phosphate buffered saline (PBS), pH 7.2 (Gibco BRL #20012-027), fetal bovine serum (FBS) (Gibco BRL #16000-044). All other chemicals (Aldrich) are reagent grade and used as received.
Bacterial strain, culture and sample preparations
To validate a new assay, one of the important criteria is to have controlled samples. Bacterial Staphylococcus aureus serotype I (Cowan's serotype I contains protein A) was purchased from ATCC (#12598) and cultured in Nutrient broth medium (Difco. Cat. 233000) at 37 °C overnight. The bacterial were harvested and centrifuged at 4,000 rpm. The cell pellet was washed three times with PBS and then divided into two parts for preparing sample A, B, C and D.
Acid-treated sample A and B
cultured bacterial were treated with 0.1M Na-citric buffer pH 2.8, and then washed with PBS, pelletized. This is sample A. Half of the sample A were then treated with lysis buffer and being kept on ice for 30 minutes, followed by repeatedly frozen in liquid nitrogen and thawed at 37 °C in water bath five times then centrifugation at 4,000 rpm for 30 minutes. The supernatant is sample B.
Non-acid-treated sample C and D
cultured bacteria were washed with PBS and pelletized. This is sample C. Half sample C were then treated with lysis buffer as above. This supernatant is sample D.
Enzyme-linked immunosorbent assay (ELISA) protocol for characterization of S. aureus
Protein A in S. aureus lysate captured by rabbit IgG detected by A10B RG3 ScFv (Indirect method) or mouse anti protein A antibody (Direct method)
The microtiter plates were coated with sample B or sample D or commercial purified protein A in PBS. The wells were emptied and washed, then blocked by PBS containing 0.1% Tween 20 and incubated for 15–30 min at room temperature (RT). Or by 3% BSA in PBS. After washing, serial diluted rabbit IgG at concentration of 20, 10, 5, 2.5, and 1.25 μg/mL or mouse anti protein A biotin conjugate at 1: 2,000 in 0.05% Tween 20 PBS were added to designed wells and incubated for one hour at RT to capture protein A on wells. The plate was washed once again and an anti rabbit IgG scFv, A10B RG3 at 5 μg/mL (Indirect method) was added and incubated for 1 hour at RT. The plates were washed three times followed by adding of HRP/anti-E-tag monoclonal antibodies at 1:5,000 in 0.05% PBS-T or streptavidin – HRP conjugate (direct method). The plates washed once again after one-hour incubation and then with the substrate ABTS (2,2'-azino-bis (3-ethylbenzo-thiazoline-6-sulfonic acid) diammonium salt plus hydrogen peroxide) to each well. The result was read at 405 nm by an ELISA reader (BioTek Instrument Inc.).
ELISA protocol for characterization of FcR on Macrophage
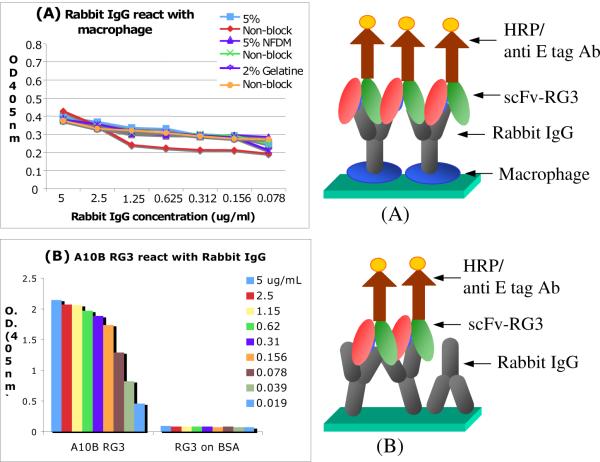
Bovine macrophage was cultured in serum free medium in plate (Costar, Cat. 3595) in a CO2 incubator at 37 °C. The culture supernatants were gently discarded when cell became confluent. The macrophage on plate was rinsed with washing buffer (WB) gently and then fixed with 5% buffered formalin for ten minutes and the plate was rinsed again very gently. Three blocking solutions (5% BSA, 5% NFDM and 2% gelatin in PBS) and control PBS were added to designed wells, incubated at 37 °C for 30 minutes. The macrophages in wells were rinsed with WB. Serial diluted Rabbit IgG (from 5 to 0.078 μg/mL) were added to designed wells, then incubated for 1 hour at 37 °C for rabbit IgG Fc portion to react with the Fc receptor on the surface of macrophages. A mixed solution of A10B scFv-RG3 and anti E-tag monoclonal antibody was added to each well and then incubated for another hour at 37 °C in a humid chamber. After gently washing, substrate ABTS was added to each well for color monitor as above method. (Figure 2 A) Three control assays to validate each step of scFv Fc sensors were performed using the basic protocol described previously with several modifications (Figure 2 B, Table 2). The detailed experiments for these three control assays could be found in Supporting Information.
Figure 2.
ELISA detection of Fc receptor on macrophage. (A) Fc receptor on macrophage reacted with rabbit IgG detected by A10B RG3 ScFv and anti-E-tag HRP; (B) Control: Standard rabbit IgG reacted with ScFv A10B RG3 and detected by anti E-tag HRP.
Quartz Crystal Microbalance
A non-polished gold quartz crystal (International Crystal Manufacturing Co. Inc.) was mounted in a custom-made Kel-F cell. It was cleaned three times using a mixture of concentrated nitric acid and sulfuric acid (1:1 v/v), biograde water and ethanol in series, and then the cell was dried using a nitrogen stream. The frequency of the electrode was measured in PBS (pH 7.2). One side of the gold quartz crystal was incubated in a solution of 4 mM MUA solution overnight to form anionic charged layer. The anionic charged sensor surface was then immersed into A10B scFv-RG3 solution for 8 hours, followed by the treatment of blocking reagent, 0.1% BSA, for 0.5 hour. After the incubation, the excess scFvs on the surface of QCM was washed away with PBS buffer and biograde water. Agilent Network Impedance Analyzer (HP4395A) was used to measure the frequency and damping resistance changes of the Fc immunosensors during various characterization experiments.
RESULTS AND DISCUSSION
ELISA Characterization of S. aureus and Macrophage cell surface Fc receptor
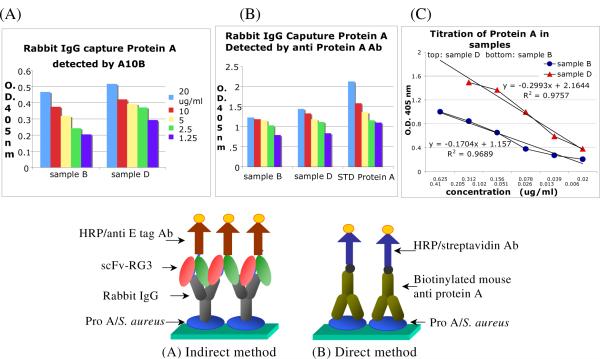
ELISA was used to semi-quantify the concentration ranges of the S. aureus and Macrophage cell surface Fc receptors. Figure S1 in Supporting Information is the calibration curve of Protein A that was used to analyze protein A concentration in S. aureus samples B and D by ELISA methods. Sample A and C are whole cells which are difficult to be coated on the ELISA plate. No ELISA data was obtained for these two samples. As shown in Figure 1A, Protein A in either sample B or sample D can be captured by normal rabbit IgG through Fc regions and detected by an anti rabbit scFv, A10B RG3 and anti E-tag antibody indirectly. There is no big difference between two treatment methods as expected. The slightly higher signals in sample D than that in sample B were likely due to the denaturing of some of the protein A by repeated freeze in liquid nitrogen and thaw in 37 °C water bath and the acidic treatment. Figure 1B was obtained by a direct method to detect protein A in samples prepared from S. aureus or commercial sample. Protein A in three different samples can be captured by a mouse anti protein A antibody detected by streptavidin – HRP conjugate. Again, there is no big difference between the two samples but ODs in sample D is slightly higher than that of sample B. These results cross validate the direct and indirect ELISA assay. Figure 1C showed the results of quantification of protein A in sample B and D via biotinylated anti protein A antibody and streptavidin - HRP colored by substrate ABTS . The protein A in both samples can be titrated and the ODs decreased followed by serial dilution from 0.625 μg/ml to 0.02 μg/ml in sample B and from 0.41 μg/ml to 0.006 μg/ml. The R2 are 0.9757 and 0.9689 respectively.
Figure 1.
ELISA Detection of protein A in samples B and D from S. aureus. Samples were coated on plate. (A) Indirect method. Sample was captured by rabbit IgG, detected by A10B RG3 ScFv and anti E-tag HRP. (B) Direct method. Sample was captured by mouse anti protein A biotinylated IgG and detected by streptavidin – HRP conjugate. ABTS substrates were used in both methods. (C) Calibration curves for quantitative analysis of protein A in sample B and D.”
ELISA Characterization of Macrophage Cell Surface Fc Receptors
Macrophages possess a surface receptor specific for the Fc region of certain subclasses of IgG. Literature data on the chemistry of the receptor is both sparse and conflicting. As shown in Figure 2, ELISA assay was used to analyze the Fc receptor concentration in bovine macrophage samples described in details in the earlier section. Experimental studies were designed to first prove that there is IgG Fc receptor on the surface of macrophage. The Fc receptors on the macrophage samples were characterized using immobilized rabbit IgG. As shown in Figure 2A, the cultured macrophage on plate can capture rabbit IgG through its Fc receptor and the signal can be detected by anti rabbit A10B ScFv RG3 and then anti E tag HRP conjugate antibody. Additionally, we used three general blocking reagents as controls to test if the binding is non-specific and can be blocked away. Results in Figure 2A shows that this reaction is a specific immune reaction. Two control assays are designed as summarized in Table S1 in Supporting Information. In the upper part of Table S1, Fc receptors on the surface of macrophage specifically react with rabbit IgG, detected by goat anti rabbit IgG –HRP conjugate. This reaction was specific and concentration dependent. In the lower part of Table S1, it was designed to test whether there is any non-specific binding generated by ScFv A10B RG3 or anti E-tag mouse monoclonal antibody. The OD reading in this assay is much lower than that in Figure 2A and the upper part of Table S1 (< 0.27) when anti E-tag HRP monoclonal antibody was used at same dilution. This result indicated that A10B RG3 did not interact with macrophage since it is a single chain fragment variable antibody without Fc fragment. The low background level signal observed might come from the interaction between mouse anti-E tag antibody and macrophage Fc receptor. There are no O.D differences between blocked or non-blocked assays in all parallel tests. The data indicated that the binding between macrophage Fc receptor and rabbit IgG are specific and its affinity is not interfered by these blocking buffers. A standard dose dependent study of rabbit IgG reacted with an anti rabbit IgG scFv (A10B RG3) was performed as shown in Figure 2B. The data showed that rabbit IgG on ELISA plate reacted with anti rabbit IgG scFv specificity and there was no binding activity on BSA, which proved that the antigen, rabbit IgG reacted with antibody, A10B RG3 very specifically; and this reaction has high affinity.
Generally, it is difficult to perform ELISA assay by using whole cell antigen on plate because the cells will be lost during the assay processes due to many washing steps. In the ELISA assay described in this report, more attempts were made to hold whole cell on the ELISA plate wells. The macrophage growth was maintained to be in log phase to make sure the cells are in single monolayer. If the cell was over growing, then more cells will be lost due to washing. We used 5% formalin in PBS to fix cells in 5 – 10 minutes at RT to hold the cells on plate. And in each step, washing was done very gentle and the washing buffer better was warmed up over 30 °C during each washing. Otherwise, the cells could be lost much more if the temperature of washing buffer changed from lower to higher or vice versa between each wash. The ELISA study validates the innovative sampling methods and provides the complementary information for the selected concentration ranges for the innovative QCM assay below.
QCM Characterization of S. aureus Cell Surface Fc Receptors (Protein A) by scFv Fc sensor
a. Characterization of scFv Fc sensor immobilization with purified protein A
The oriented immobilization of scFv-RG3 on the MUA surface specifically bound with CH1 region of rabbit IgG (referred as MUA/scFv-RG3/IgG surface) and made the IgG Fc portion available in a highly packed and well-oriented manner. To exam the detective ability of the assay we designed, the IgG Fc sensor was first applied for the detection of Fc receptor - protein A. The addition of purified 20 μg/mL protein A to the MUA/scFv-RG3/IgG surface produced 47 Hz signal response (Figure 3 curve a), which was about 7-fold increase over randomly oriented rabbit IgG surface (rabbit IgG was physically adsorbed onto QCM surface Figure 3 curve b) and protein A/IgG surface (protein A was first physically adsorbed onto QCM surface and then coupled with rabbit IgG, Figure 3 curve c). To investigate the specificity of the protein A detection, the MUA/scFv-RG3 sensor in the absence of rabbit IgG was used as negative control. The addition of 20 μg/mL protein A to the control surface only generated a really small frequency decrease (Figure 3 curve d).
Figure 3.
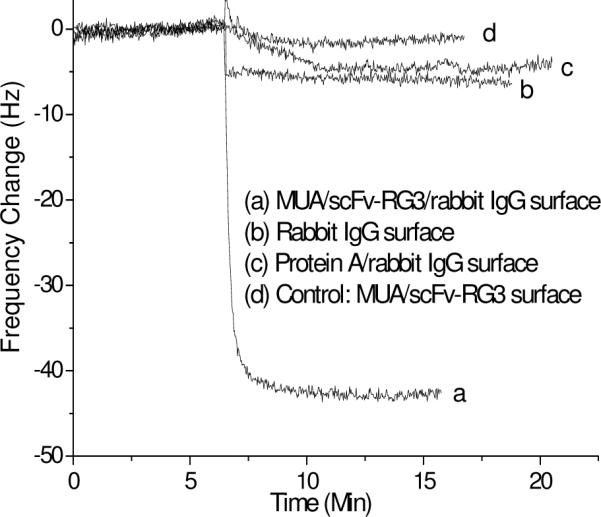
Frequency change vs. time curves for the detection of 20 μg/mL protein A by different sensor surfaces.
b. Characterization of Fc Receptors at S. aureus Cell Surface
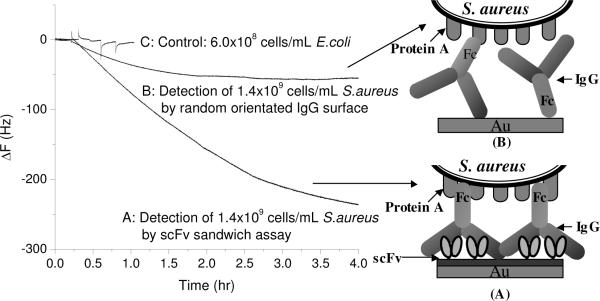
It has been reported that some of the S. aureus surface protein A have already been occupied by many isotypes of IgG.13 These pre-occupied sites might reduce the adsorption of the bacteria on the sensor surface. To free these binding sites, and optimize the immobilization, S. aureus cell surface bound IgG was removed by 0.1 M Na-citric acid buffer (pH 2.8) before detection (acid-treated S. aureus, sample A). As shown in Figure 4 curve A, the addition of acid-treated S. aureus into MUA/scFV-RG3/rabbit IgG sensor produced relatively large frequency changes compared to the random oriented IgG sensor surface (Figure 4 curve B). To test the selectivity of this sensor, E. coli W1485 (ATCC 1435) was utilized as a negative control. Only small signal was observed for the addition of E. coli. (curve C).
Figure 4.
QCM results for the detection of S. aureus. (A) Acid treated S. aureus were added to MUA/scFv-RG3/IgG surface; (B) Acid treated S. aureus were added to random oriented IgG surface; (C) Negative control: E. coli were added to MUA/scFv-RG3/IgG surface.
To further test the sensor specificity, several control experiments were then performed. Different samples were added to the MUA/scFv-RG3/IgG sensors. The addition of S. aureus without acid treatment (sample C) generated ~ 44 Hz frequency change (Figure 5 column B), which is about 5–6 times smaller than the signal produces by acid treated S. aureus sample (sample A) (Figure 5 column A). Thus, removal of the IgG from the bacterial surface is critical to improve the detection sensitivity of the sensor.
Figure 5.
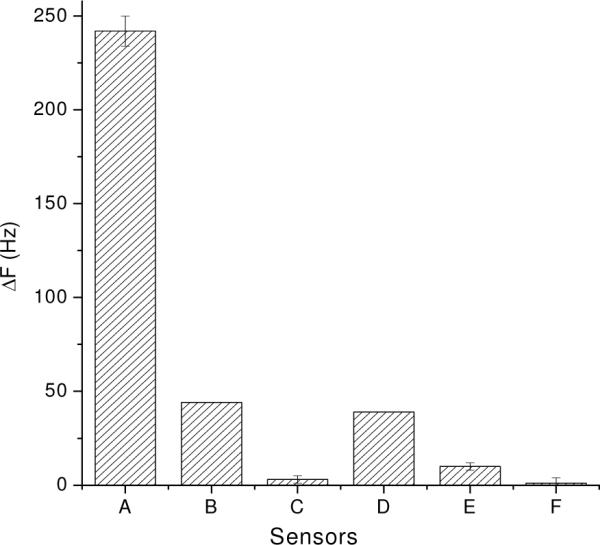
The comparison of sensor sensitivity and specificity for the detection of S. aureus. (A) 1.4×10⁹ cells/mL acid treated S. aureus; (B) 1.4×10⁹ cells/mL non-treated S. aureus; and (C) 2.6×10⁸ cells/mL E. coli were added to MUA/scFv-RG3/IgG sensors; D–F control surfaces. 1.4×10⁹ cells/mL acid treated S. aureus were added to (D) random oriented rabbit IgG surface; (E) MUA/scFv-RG3 surface (without rabbit IgG) and (F) mannose surface.
E. coli, a gram-negative bacterium, was applied as a negative control reagent, and generated only small frequency change (5 Hz, Figure 5 column C).
The random oriented rabbit IgG surface (physical adsorption onto Au QCM surface), MUA/scFv-RG3 surface (without rabbit IgG), and mannose modified QCM surfaces (specifically to Con A)14, were also selected as control surfaces. The addition of acid-treated S. aureus generated ~39 Hz frequency change to the random oriented rabbit IgG surface (Figure 5 column D), ~10 Hz non-specific absorption to the MUA/scFv-RG3 surface (without rabbit IgG) (Figure 5 column E) and no detectable nonspecific absorption to the mannose modified QCM surfaces (Figure 5 column F). All these control experiments confirmed that the MUA/scFv-RG3/IgG surface is highly selective for the detection S. aureus via the specific binding between Fc portion of rabbit IgG and protein A on cell surface. Thus, we demonstrated that the scFv modified QCM sensors could be further utilized to detect the sequential and complicated binding events through well-designed surface, which can largely extend its application.
c. Characterization of Fc Receptors at Macrophage Cell Surface
Macrophage cell Samples were sequentially added to MUA/scFv-RG3/Rabbit IgG QCM sensor in 1 mL of continuously stirred PBS to produce a dose response curve (Figure 6). Jay C. Unkeless at al reported that numbers of IgG 2a κ Fc receptors on mouse normal macrophage is 110,000 per cell and IgG 2b κ Fc receptor on mouse normal macrophage is 50,000 per cell.15 The assay performed at 4 °C. The numbers of Fc receptor on macrophage vary depending on performing temperature, IgG species and IgG sub-classes. Iodination of IgG by using radioisotope to perform an assay to count number of receptors on macrophage is most investigators used method. But this method needs special area to handle the labeling and equipment for test. During the labeling process, there is a potentially contamination problem. Thus, the Fc sensor described here has great advantage in characterization cell surface Fc receptor expression. Interfacial mass changes can be related to changes in the QCM oscillation frequency by applying Sauerbrey's equation (Δf= −2Δmnf02 / (A(μqρq)1/2),16where n is the overtone number, μq is the shear modulus of the quartz (2.947 ×10¹¹ g/(cm sec2), and ρq is the density of the quartz (2.648 g/cm3), and which assumes the foreign mass is strongly coupled to the resonator. If Sauerbrey equation is valid, the frequency signal obtained can be attributed to two factors: the concentration of the analytes and the available surface binding sites of the ligands (i.e. the surface coverage and the density of the ligands). In our study, the maximum rabbit IgG can be immobilized is about 9.2×10¹¹. If we assume the macrophage has a density of 1.004g/cm3 and diameter of 21×10−4 cm,17, 18 the number of macrophage on the QCM surface from our data is about 68. Thus only very few macrophage were bound to the surface via its Fc receptor due to its big size and high Fc receptor expression. Additionally, as shown in Figure 3, 4 and 6, by fitting through Butterworth-Van Dyke circuit of crystal oscillation, we obtained the damping resistance change during the binding events as shown in Table 1.19, 20 High damping resistance indicates the damping of the crystal oscillation which is characteristic of a fluid or viscoelastic material indicating Sauerbrey equation is not completely valid. Interestingly, the damping resistance changes are much larger for the S. aureus when much higher cell numbers (i.e. 109) were measured compared to macrophage system (i.e. 104) as shown in Figure S2, and S3. Even though using QCM approach cannot quantify the number of Fc receptor in cell surface, it provides much rich information for the binding event for cell based assay that can be used to semi-quantify cell surface Fc receptor expression.
Figure 6.
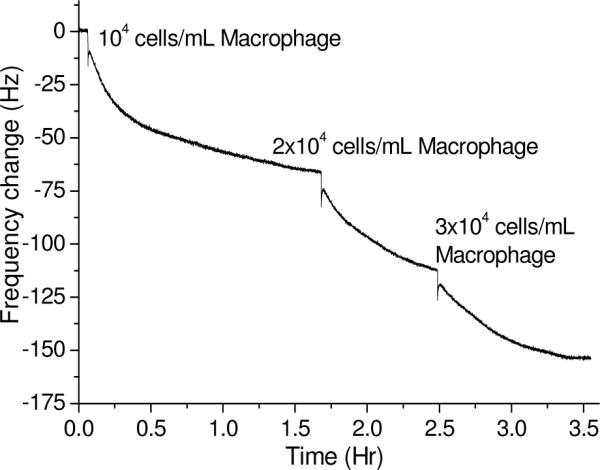
QCM results for the detection of macrophage by MUA/scFv-RG3/Rabbit IgG modified QCM sensors.
Table 1.
Conclusion
We demonstrate here that the multivalency of an antibody in combination with engineered scFv provides a highly oriented Fc sensor using non-labeled QCM biosensor. The Fc receptors are widely expressed on different cells. Just as important as the antigen combining site, the Fc interaction with a variety of Fc receptors plays critical roles in the immune response. Cell surface receptors for the Fc portion of immunoglobulin confer on most cells of the immune system the ability to communicate with the humoral antibody response. These Fc receptors are known to be particularly important for the function of various effector cells, such as macrophages, since they are involved in mediating a variety of activities including endocytosis, antibody-dependent cellular cytotoxicity, and triggering the release of potent inflammatory agents. The interaction of Fc receptor with many other ligands is not fully understood. The Fc sensor developed in this work provides a feasible method to monitor the dynamic changes of cell surface Fc receptor expression that is rapid, sensitive, specific, convenient, non-invasive. Parallel ELISA and QCM assays for the same samples here represent an example of translation study of analytical chemistry and Immunology.
Supplementary Material
ACKNOWLEDGEMENT
X. Zeng thanks the support of Oakland University and NIH (R21EB000672-01, R33EB000672 and R21EB009513).
REFERENCE
- (1).Daeron M. Annual Review of Immunology. 1997;15:203–234. doi: 10.1146/annurev.immunol.15.1.203. [DOI] [PubMed] [Google Scholar]
- (2).Lachica RVF, Genigeorgis CA, Hoeprich PD. Journal of Clinical Microbiology. 1979;10:752–753. doi: 10.1128/jcm.10.5.752-753.1979. [DOI] [PMC free article] [PubMed] [Google Scholar]
- (3).Brooks JL, Mirhabibollahi B, Kroll RG. Applied and Environmental Microbiology. 1990;56:3278–3284. doi: 10.1128/aem.56.11.3278-3284.1990. [DOI] [PMC free article] [PubMed] [Google Scholar]
- (4).Dorrington KJ. Immunological Investigations. 1976;5:263–280. doi: 10.3109/08820137609044280. [DOI] [PubMed] [Google Scholar]
- (5).Steinman RM, Mellman IS, Muller WA, Cohn ZA. Journal of Cell Biology. 1983;96:1–27. doi: 10.1083/jcb.96.1.1. [DOI] [PMC free article] [PubMed] [Google Scholar]
- (6).Mellman IS. Ciba Foundation Symposia. 1982;92:35–58. [PubMed] [Google Scholar]
- (7).Leslie RGQ. European Journal of Immunology. 1980;10:323–333. doi: 10.1002/eji.1830100503. [DOI] [PubMed] [Google Scholar]
- (8).Rouzer CA, Scott WA, Hamill AL, Cohn ZA. Journal of Experimental Medicine. 1980;152:1236–1247. doi: 10.1084/jem.152.5.1236. [DOI] [PMC free article] [PubMed] [Google Scholar]
- (9).Rouzer CA, Scott WA, Kempe J, Cohn ZA. Proceedings of the National Academy of Sciences of the United States of America-Biological Sciences. 1980;77:4279–4282. doi: 10.1073/pnas.77.7.4279. [DOI] [PMC free article] [PubMed] [Google Scholar]
- (10).Mellman IS, Plutner H, Steinman RM, Unkeless JC, Cohn ZA. Journal of Cell Biology. 1983;96:887–895. doi: 10.1083/jcb.96.3.887. [DOI] [PMC free article] [PubMed] [Google Scholar]
- (11).Shen Z, Stryker GA, Mernaugh RL, Yu L, Yan H, Zeng X. Anal. Chem. 2005;77:797–805. doi: 10.1021/ac048655w. [DOI] [PMC free article] [PubMed] [Google Scholar]
- (12).Shen Z, Yan H, Zhang Y, Mernaugh RL, Zeng X. Anal. Chem. 2008;80:1910–1917. doi: 10.1021/ac7018624. [DOI] [PMC free article] [PubMed] [Google Scholar]
- (13).Knicker SM, Profy AT. Journal of Immunological Methods. 1991;142:53–59. doi: 10.1016/0022-1759(91)90292-n. [DOI] [PubMed] [Google Scholar]
- (14).Shen Z, Huang M, Xiao C, Zhang Y, Zeng X, Wang PG. Anal. Chem. 2007;79:2312–2319. doi: 10.1021/ac061986j. [DOI] [PMC free article] [PubMed] [Google Scholar]
- (15).Unkeless JC, Eisen HN. The Journal of Experimental Medicine. 1975;142:1520–1533. doi: 10.1084/jem.142.6.1520. [DOI] [PMC free article] [PubMed] [Google Scholar]
- (16).Sauerbrey GZ. Phys. 1959;155:206–222. [Google Scholar]
- (17).Krombach F, Münzing S, Allmeling AM, Gerlach JT, Behr J, Dörger M. Environ Health Perspect. 1997;105(Suppl 5):1261–1263. doi: 10.1289/ehp.97105s51261. [DOI] [PMC free article] [PubMed] [Google Scholar]
- (18).Czelinski GH, Reid DS, Apostol A, Bauer KD, Scarpelli DG. Journal of Biological Physics. 1987;15:29–32. [Google Scholar]
- (19).Ngeh-Ngwainbi J, Suleiman AA, Guilbault GG. Biosensors and Bioelectronics. 1990;5:13–26. doi: 10.1016/0956-5663(90)80023-7. [DOI] [PubMed] [Google Scholar]
- (20).Schmitt N, Tessier L, Watier H, Patat F. Sensors and Actuators B-Chemical. 1997;43:217–223. [Google Scholar]
Associated Data
This section collects any data citations, data availability statements, or supplementary materials included in this article.


