Abstract
Nonlinear Raman microspectroscopy based on a broadband coherent anti-Stokes Raman scattering is an emerging technique for noninvasive, chemically specific, microscopic analysis of tissues and large population of cells and particles. The sensitivity of this imaging is a critical aspect of a number of the proposed biomedical application. It is shown that the incident laser power is the major parameter controlling this sensitivity. By careful optimizing the laser system, the high-quality vibrational spectra acquisition at the multi-kHz rate becomes feasible.
Keywords: Raman, coherent anti-Stokes Raman scattering, microscopy, spectroscopy, ultrafast, hyperspectral imaging
Introduction
Noninvasive, or minimally invasive, imaging plays an important role in both the fundamental understanding of cellular and subcellular processes and diagnosing and observing the progression of diseases.1 Optical spectroscopy methods based on scattering can provide a substantial image contrast to be able to identify different tissue structures2 and cellular organelles.3 Even more information is available through light absorption measurements by means of photoacoustic spectroscopy and imaging.4 Fluorescence spectroscopy further extends the specificity of optical imaging, often providing quantifying information about molecular species.5, 6 Its nonlinear optical analog, mutliphoton fluorescence microscopy, together with other nonlinear optical spectroscopy techniques, such as the second-harmonic and the third-harmonic generation microscopies, provide an enhanced image contrast and molecular specificity.7, 8, 9, 10 However, the most chemically specific optical technique, Raman spectroscopy, has been always considered as an emerging tool in biomedical imaging, mainly, because of its major drawback, relatively low signal intensities. Indeed, the differential cross section for a nonresonant Raman scattering is routinely 10 orders of magnitude smaller than that for fluorescence. As a result, for a typical tissue, signal is dominated by fluorescence from a number of native fluorophores, which cover almost all the visible spectral region. To deal with this obstacle, a nonlinear optical analog of Raman scattering, coherent anti-Stokes Raman scattering (CARS), was introduced as a possible solution to existing problems,11 and first CARS microscopy images were attained.12 However, it took more than a decade for of continuous development of laser technology to make a revitalizing new attempt to bring this exciting technology back into the spotlight.13 Nowadays, we witness the resurgence of CARS spectroscopy∕microscopy, which brings new enthusiasm into the field of vibrational microspectroscopy and its applications to biomedical sensing and imaging.14, 15, 16, 17, 18, 19, 20, 21, 22 Most of the recent progress can be attributed to the revolutionary achievements in ultrafast laser technology, which have greatly improved the stability and availability of user-friendly laser sources suitable for CARS microscopy and microspectroscopy. In the same time, for any of the currently discussed applications for biomedical imaging to be feasible, the cost of such systems has to be further reduced, and significant efforts have to be made toward increasing the sensitivity of CARS detection. Indeed, many lasers, which are currently employed for CARS imaging, are utilizing Ti:sapphire oscillator or oscillator∕amplifier systems, which are great tools for laboratory experiments, but are expensive and somewhat unpractical for the hospital setting. We anticipated this problem earlier and in 2001 suggested a rather simple approach utilizing a broadband CARS microspectroscopy system based on the narrowband pump and broadband Stokes pulse excitation, which lacks any spectral alignment and allows the full spectrum to be recorded using a simple spectrometer.23, 24 This idea became highly attractive for a number of research groups, who already had femtosecond Ti:sapphire laser oscillator, since the synchronized Stokes pulse could be easily generated in photonic crystal fibers.25, 26 The simplicity of such approach was extremely attractive for a number of researchers, since now, to get the full vibrational spectrum in CARS spectroscopy, one didn't have to be proficient in laser technology by tweaking the excitation frequency while trying to preserve the optical alignment through the optical microscope.
With all the great achievements of CARS microscopy and microspectroscopy, we note that the majority of the work has been focused either on lipids or lipid rich tissues,27 for which even spontaneous Raman signal is rather strong. In this report we are trying to evaluate the sensitivity level of CARS detection and the ways of improving by constructing a more advanced laser system for CARS microspectroscopy imaging.
The paper is organized in the following way. First, we present a brief introduction to CARS spectroscopy and microscopy, in which we evaluate the signal strength of the CARS signal and the ways to improve it. In the second part, we discuss two laser systems, which, arguably, allow the highest signal-to-noise ratio CARS microspectroscopy imaging. Finally, we will show some examples of CARS microspectroscopy sensing and imaging and outline the roadmap for high-throughput vibrational cytometry, which, in our opinion, is by far the most promising application of CARS microspectroscopy, where it is a clear advantage with respect to its more traditional counterparts, such Raman and infrared spectroscopy.
Theory
CARS spectroscopy is a particular case of four-wave mixing, when two incident waves coherently excite the vibrational Raman transition and the resulted coherent molecular vibrations scatter light more efficiently than they would normally do in spontaneous Raman scattering. It is a nonlinear optical effect and the efficiency of the process, i.e., the intensity of the CARS signal, is proportion to the third power of the incident intensity, I(ω), and the second power of the interaction length, L, i.e.,
| (1) |
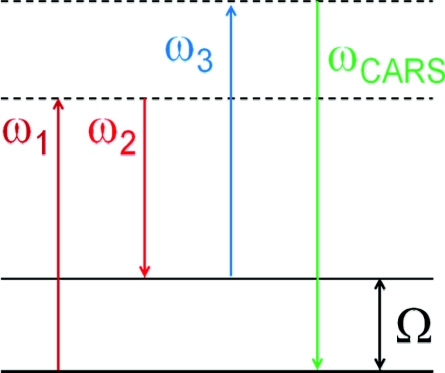
where ω1, ω2, and ω3 are the frequencies of the pump, Stokes and probe beams, as illustrated in Fig. 1.
Figure 1.
Schematic energy diagram of the CARS process.
Clearly, there are two effects which are responsible for a possible signal enhancement. First, it is an induced coherence, which is related to the intensity of the incident beams, and, second, it is a coherent interaction, which is dramatically enhanced with the increasing number of molecules in the excitation volume. This creates a clear path to a successful implementation of CARS spectroscopy for imaging: one has to use highest possible light intensity and the largest number of molecules in the excitation volume. The first one seems to be natural for microscopic imaging, since by focusing the light radiation down to diffraction-limited spot the light intensity increases; however, by reducing the size of the excitation volume, one substantially affects the number of molecules. Let us perform some rough estimation on the CARS signal dependence on the focal beam size, assuming a simple collinear geometry and diffraction limited beams. If the beam-waist is w0, then the Rayleigh length, lR, which defines the interaction length, is
where λ is the incident wavelength.
Each intensity in the Eq. 1 is inverse proportional to the square of the beam-waist, leading that the total power of the generated CARS signal is inverse proportional to the square of the beam-waist, while the square of the interaction length is proportional to the fourth power of the beam waist, making the total CARS signal, which is calculated by integrating over the square area of the beam, is independent on the focal spot-size. While the final result that the integrated CARS signal does not depend on the focusing conditions seems like a surprising result, it has been known for some time (see, for example, Ref. 28), and it has a very important consequence that in order to increase the CARS signal one has to increase the incident power, i.e., more energy per pulse is needed.
The other nontrivial result comes when one tries to compare the CARS signal with a more traditional spontaneous Raman signal. Over the past few years in literature, it is getting silently assumed that CARS spectroscopy always provides a stronger signal than Raman scattering. However, it is not generally true, and it was a subject of an extensive discussion in literature.21, 29, 30, 31, 32, 33, 34 Here, rather than trying to do extensive calculations, we are just relying on a general physical sense to understand the possible limits of CARS microspectroscopy. In order to improve the efficiency of CARS generation, one has to use high-intensity pulses, which might cause a substantial damage to a living organism. It is less of a problem for bacterial spores,21 or any nonliving organic substance,29, 30, 32 but there is always an upper limit of the light intensity which can be used without disturbing the cell's integrity and vitality. On the other hand, the CARS signal, being a result of coherent interaction, is proportional to the square of the number of molecules in the excitation volume. Earlier work (see, for example, Refs. 29 and 30) has demonstrated that for a given incident intensity, there is critical number of molecules, which makes CARS spectroscopy more favorable than Raman spectroscopy for the shot-noise limited detection. Thus, in order to improve the sensitivity of vibrational spectroscopy to detect small concentrations of molecular species, it is necessary to increase the excitation volume, which increases the total number of molecules producing CARS signal making CARS microspectroscopy significantly more favorable.32 The detailed analysis of the signal-to-noise ratio (SNR) for both CARS and Raman signals under microscopic focusing conditions is given in Ref. 33, which also provides with some practical recommendations for using both spectroscopies for microscopic imaging. In particular, when low concentrated molecular species have to be quantified, there is a simple solution which utilizes the incident light of the maximum intensity with the largest beam's spot-size on the sample. To achieve this, one has to increase the total energy of the pump beam. Thus, by increasing the incident pump energy, while increasing the beam size on the sample, one can collect more CARS photons from the same concentration of a sample.
There are also several practical advantages of using CARS microspectroscopy. One of them is a directionality of the signal beam. It is generally easier to align CARS signal to collect the vast majority of the generated signal than to do the same thing for Raman scattering. The non-resonant background in CARS spectroscopy, which will be discussed later, actually helps in heterodyning the CARS signal brining it above the floor noise level of a typical detector. This is especially important for rapid data acquisition, which requires line detectors with a typical readout noise of 100–200 electrons per pixel. One of the most significant obstacles for high-quality Raman imaging is the fluorescence background, which results in a substantial degradation of the SNR for Raman scattering; however, since the CARS signal is blue shifted with respect to both the pump and Stokes wavelengths, it is not a problem for CARS microspectroscopy. The list of pros and cons can be further extended, but, at the end, it all depends on a particular application, and the one we are interested in is related to detecting small variations of the chemical composition of the whole cell for the purpose of a high-throughput cell cytometry. There is simply not enough time to collect CARS or Raman microscopic images, since a typical flow rate is of the order of 1000 cell per second, and, when a cell is taken as a whole object, average concentrations of all molecular species are rather low. This is a challenging task; however, we will take a rather simplified approach. We need to collect the CARS spectra from the whole cell, which is, typically, represented by a volume of about (10 μm).3 We note that this is at least 1000 times greater than a typical focal spot in a more conventional CARS microscopy, but the advantage of having such a large volume is related to the increased number of molecules, which according to our above estimations will result in a greatly enhanced CARS signal. If we can maximize the incident intensity bringing it up to the level allowable by cell damage, we can take a full advantage of the given geometry. Assuming an 1 kW∕(μm)2 intensity limit (more discussion will follow later in the text), it results in 100 nJ per pulse for 1-ps pulse duration. That is a much larger amount of energy, which is available through a typical oscillator, and, not surprisingly, many groups are utilizing amplifier systems for fast CARS spectral acquisitions.35, 36, 37, 38, 39 While those ultrafast amplifier systems are getting more compact and less complex, the price tag for such systems still remains in $500,000 range, making CARS system less attractive than more traditional Raman imaging systems.
The next section is devoted to the recent laser developments in our laboratory aimed at constructing a low-cost, low-maintenance ultrafast lasers for CARS microspectroscopy.
Laser Development for CARS Microspectroscopy
The Choice of the Incident Wavelength
The choice of the incident wavelength is absolutely critical for pushing the limits of the CARS microspectroscopy system. There are a limited number of studies related to the effect of short pulsed irradiation on living cells and tissues;24, 40, 41, 42, 43, 44, 45, 46 however, there are two major trends, which are generally accepted. The energy density damage threshold goes up with the increasing pulse width, and it goes down with the decreasing wavelength. While the exact mechanism for cellular damage induced by ultrashort laser pulses is rather complex and is not quite clear, the above guidance can be used in designing CARS microspectroscopy system. Clearly, living cells can tolerate higher intensity for longer excitation wavelength, and that is why wavelength region from 1000 to 1300 nm, where linear absorption is still rather negligible,47 is the best suited for CARS imaging. There is not enough work done in this spectral region to determine the exact safety guidance for ultrashort laser pulses, but using the data of Refs. 21, 42, 43, 46, we can deduce a value of energy density of about 3 nJ · (μm)−2 to be safe in the wavelength region 1000–1300 nm and the range of pulse durations from 5 to 10 ps. This energy corresponds to the total energy of 300 nJ focused into a single cell. It is not only a lot of energy, but it is also, potentially, a lot of average power. At 1 MHz rate it corresponds to 300 mW of average power. In cytometry, samples are rapidly moving through the observation point with a typical transient time a cell or a particle being in the focal volume of 1 ms or less. Using the earlier developed thermal diffusion model48 and typical absorption values of the cell's material,47 we can confirm that the above quoted power does not raise the temperature of a cell more than 1°C. It also shows that higher repetition rate lasers can be also used without presenting a substantial danger for the flowing particles and cells; however, moving cells with a higher speed is rather difficult, while higher power lasers are significantly more expensive and less abundant.
Laser System for CARS Microspectroscopy
We have started with adapting our earlier CARS system.24, 49 In brief, a diode-pumped Nd:YVO4 oscillator's cavity was extended to operate in a low repetition mode,50 and some part of the fundamental beam was sent into a special, GeO2-doped fiber (UHNA3, Thorlabs, Inc.) to generate a broadband continuum.49, 50 Our original designed was mostly optimized for the laser performance at around 10 MHz, and at the most favorable 1 MHz repetition rate was not very stable at the high average output power. The later can be easily explained considering the high energy per pulse (several microjoules), which simply caused a number of other competing nonlinear optical properties inside the laser cavity, such as stimulated Raman scattering, affecting the long- and short- term stability of the laser. Thus, we were forced to operate in a low-power regime with a typical output power of 700–1000 mW, which corresponds to the pulse energy of around 0.7 − 1 μJ. We used a diode pumped Nd:YVO4 amplifier to further boost the energy of the system to about 8 μJ. This is a desirable level of energy to perform the CARS microscopy imaging and sensing at the rate up to 100,000 spectra∕s. However, the final laser design resulted in a bulky system, which, despite of being robust and extremely stable, now occupies a significant portion of 4′×6′ optical table and requires two independent diode drivers to power the unit. Clearly, a better solution is needed to make it more practical.
To make things simpler and more compact we turned ourselves to fiber laser technology, which over the past several years moved very quickly into ultrafast area.51 Ultrafast fiber lasers, by definition, should be all fiber based laser system or with minimum nonfiber based components. It allows a compact, energy efficient and environmentally safe design.
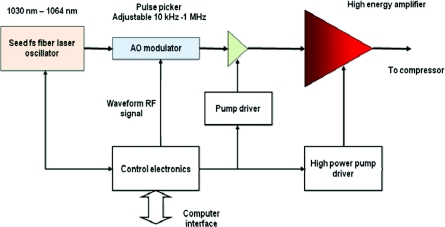
Figure 2 shows a schematic diagram of a typical high energy fiber laser system.51, 52 It includes a seed mode-locked femtosecond fiber laser operating in the 1030–1064 nm spectral region, fiber stretcher, an acoustic-optic (AO) modulator (pulse picker) reducing the repetition rate from 10′s MHz to a range of 10 kHz to 2 MHz, and high energy∕power fiber amplifier systems. Fiber laser systems with up to 100 μJ of energy have been developed into products. However, due to the nonlinearity, gain narrowing, and third-order dispersion (TOD) mismatch, the pulse width is limited to subpicosecond level, which is far from ideal for CARS microspectroscopy, which requires narrowband pulses for spectral resolution.
Figure 2.
Schematic diagram of an amplified fiber laser system.
PolarOnyx, Inc. used a novel fiber-based dispersion management stretcher53 in dechirping the pulse and reducing TOD to the minimum. One of the key pulse-shaping techniques is to manipulate the third-order dispersion (TOD) of the fiber. Basically, the dispersion in the fiber is controlled by both material dispersion and waveguide dispersion. A typical material dispersion shows a positive dispersion slope in the 1020–1090 nm spectral region. With traditional fiber designs, such as that for Corning's (Corning, NY) SMF-28, the TOD is always a positive number around 0.3 ps∕nm2-km, which does not match the TOD of the grating compressor used. However, by manipulating the fiber waveguide structure (with a depressed cladding), waveguide dispersion can be introduced to modify the material dispersion such that the TOD and dispersion slope of the whole fiber system are matched, especially with the grating compressor.
Bulk grating pair was used as a compressor. If photonic band-gap fiber (PBF) can be used in the compression stage, a truly all fiber solution would be provided for the high energy fiber laser without any discrete free space components. This is significant for many biomedical applications.
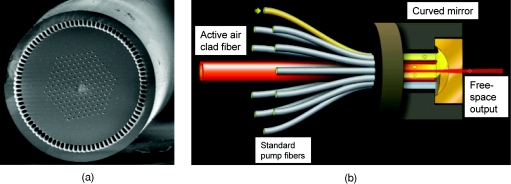
In the high power PCF amplifier, first, a photonic crystal fiber (PCF) was used to provide a large mode field diameter (60 μm) for signal amplification in the core and a large numerical aperture (NA), as high as 0.8, in the cladding for coupling more pump power into the fiber. This enabled the use of a short length of fiber to achieve a high average output power and to reduce the effect of nonlinearity for the high-energy-pulse operation. Second, the PCF was highly doped to allow more power extraction to be accomplished. Figure 3 shows a detailed design of the PCF high power amplifier with integrated pump solution. It has a total of 200 W pump power capability launched into the PCF amplifier. As much as 100 μJ of energy at 1 MHz repetition rate were amplified and compressed to transform-limited pulse duration, resulting in up to 100-W average power total power available in a compact and energy-efficient package.
Figure 3.
(a) PCF fiber and (b) pump coupling package.
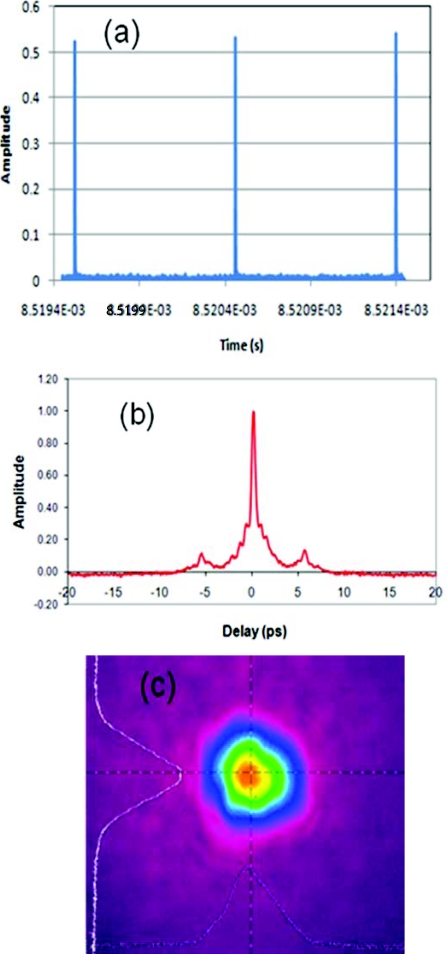
Figure 4a shows the pulse train and autocorrelation trace for 100 μJ level energy operation, corresponding to 100-W average power. The contrast ratio was higher than 36 dB indicating very clean pulse amplification. The pulse width [see Fig. 4b] was measured to be about 1 ps and was very close to a transform-limited pulse duration derived from the spectrum. The satellite pulse originated from the imperfect polarization maintaining fiber design, which could be further improved to reduce it to the level of less than 1% of the main pulse. Figure 4c shows the beam quality with the M2 measured to be less than 1.3.
Figure 4.
(a) Laser pulse train, (b) autocorrelation, and (c) spatial beam profile for the fiber output at 100-W average power laser performance.
Clearly, with the rapid advancement of fiber laser technology it is possible to replace our current system with the one generating even more energetic and shorter pulses.
Extending the Wavelength
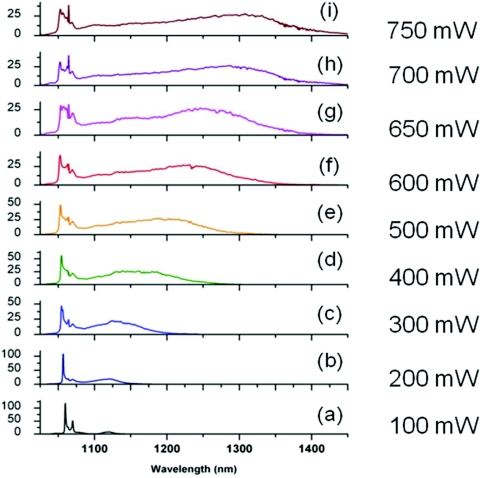
With all the attention centered on photonic crystal fibers,54 it is somewhat easy to overlook better opportunities to generate broadband white-light supercontinuum for the Stokes pulse in CARS microspectroscopy. However, the conventional mechanism for supercontinuum generation based on the self-phase modulation is not the most ideal one for this purpose. The generated spectrum is rather noisy and does not have the energy (about 100 nJ) required for efficient CARS generation. That is why we turned our attention to a different mechanism of supercontinuum generation via cascaded stimulated Raman scattering,55 which can be further assisted by the self-phase modulation.56 The best fiber material for such supercontinuum generation is GeO2, which has a significantly larger Raman cross section than fused silica and larger nonlinear refractive index. One of the possible fibers is HI-1060 fiber (Corning, Inc., Corning, NY), which has a much larger mode diameter than UHNA3 fiber and can support more energy per pulse. With a 1.5-m long fiber and about 65% overall transmission, we were able to obtain a very bright supercontinuum spectrum, whose development as a function of the transmitted power is shown in Fig. 5. At the maximum output power, we obtained a spectral brightness of the supercontinuum of about 2 nJ∕nm. The spectrum extends 400 nm away from the incident wavelength, covering all the vibrational frequencies of interest.
Figure 5.
(a)–(i) Supercontinuum development in the GeO2 fiber as a function of the output power. The input pulse duration was 4 ps, and the repetition rate was about 1 MHz.
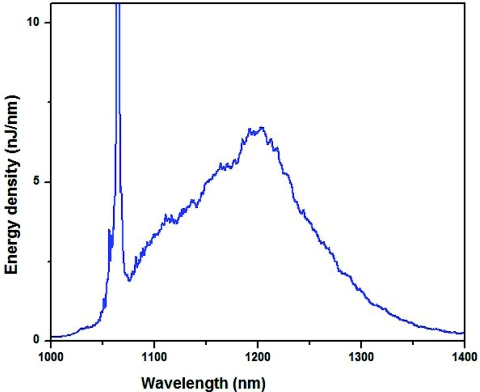
We also evaluated large mode area fibers, such as LMA20 (Thorlabs, Inc., Newton, NJ), for even brighter continuum generation. It is made out of fused silica, so that the effects, which related to stimulated Raman scattering, are not pronounced; however, due to a much larger mode diameter it allowed propagation of more energetic pulses without any visible damage and generation of a more powerful supercontinuum.57 To this date we were able to generate up to 3 μJ per pulse is a supercontinuum spectrum, which is displayed in Fig. 6. With more energetic pulses available from a new fiber laser system we expect this supercontinuum to be even brighter and broader.
Figure 6.
The spectrally resolved output of the large mode area photonic crystal fiber (LMA20). The input pulse duration was 4 ps, the input power about 7 W, and the repetition rate was about 1 MHz.
Experimental Results on Sensitivity Measurements
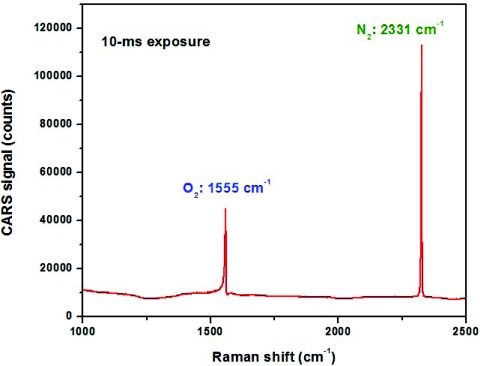
Our major research objective is to study molecules in condensed phase. However, to make an impressive comparison with spontaneous Raman spectroscopy, we measured the CARS spectrum of air, which normally mostly consists of molecular oxygen and nitrogen. Measuring Raman spectra of air is a rather tedious task, since those measurement typically require very long acquisition times and∕or UV excitation58 to improve the Raman cross section. In our case, we just simply combined two beams (one at 1064 nm, which serves both as the pump and probe beam, and supercontinuum, which serves as the Stokes beam) using a dichroic beamsplitter (Omega Optical, Inc., Brattleboro, VT) and loosely focused them in ambient air in a collinear geometry using a 10-cm focal length achromatic lens (ThorLabs, Inc., Newton, NJ) with an effective numerical aperture of about 0.05. The CARS signal was collected and collimated using a similar achromatic lens, and, after the short-pass filter (Omega Optical, Inc., Brattleboro, VT), which rejected most of the pump beams, was sent into ½-meter spectrometer (Horiba, Inc., Edison, NJ), where the signal was detected using thermoelectrically cooled CCD camera [(Andor Tech, Inc. (South Windsor, CT) iDUS-401-BRDD)]. The experimentally measured spectral resolution of CARS spectra was 3 cm−1 (in comparison, the spectral resolution of all the experimentally reported Raman spectra was about 10 cm−1). With as little as 100 mW in each of the incident beams and exposure time of just 10 ms, we were able almost to saturate the detector (see Fig. 7) at the lowest gain setting. We somewhat varied the focusing lens keeping the incident power the same and confirmed that the generated CARS signal didn't depend on the numerical aperture of the focusing lens. Clearly, the sensitivity of CARS measurements, i.e., the rate of generated photons, depends only on the incident power, and, for improved sensitivity, one just has to increase the powers of pump, Stokes and probe beams, while adjusting the spot size accordingly to avoid the damage to a sample.
Figure 7.
CARS spectrum of the ambient air. Lines corresponding to molecular oxygen and nitrogen are clearly identified. See text for additional experimental details.
Nonresonant Background in CARS Microspectroscopy
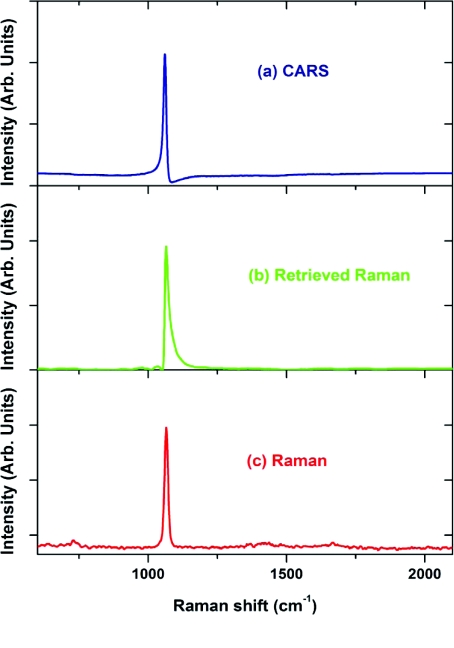
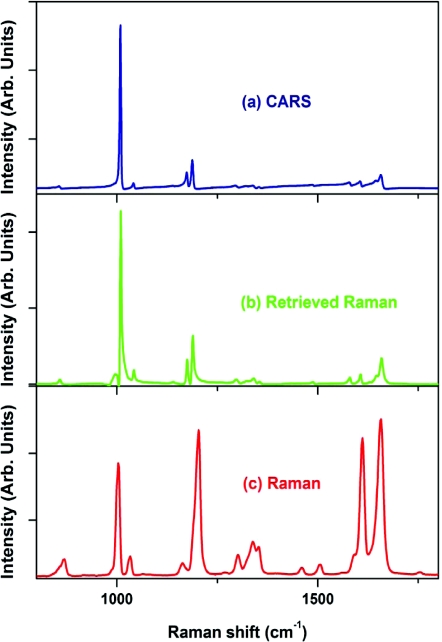
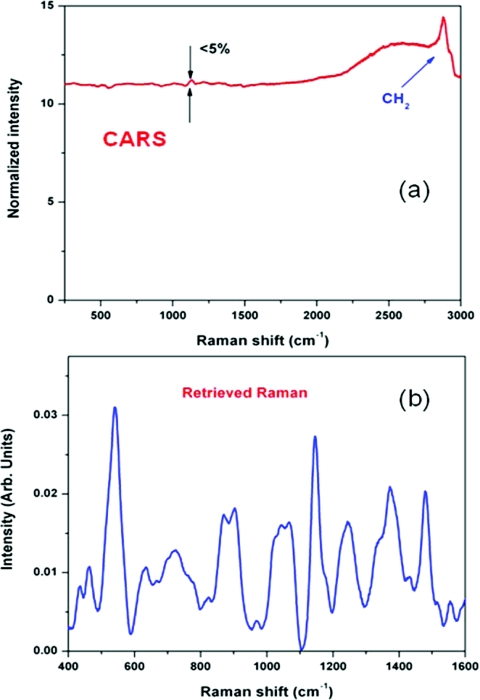
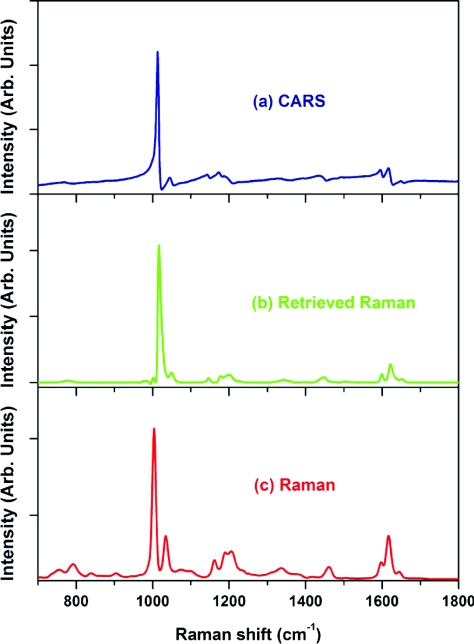
One of the most often discussed problems in CARS spectroscopy is a so-called nonresonant background. It comes from a nonresonant four-wave mixing process from a number of surrounding molecules. While this background can be rather small for molecules with sharp vibrational transitions and high relative concentrations of those molecules (see Fig. 7), it imposes a substantial obstacle for a typical soft tissue consisting of 90% water molecules. There are many ways of reducing the non-resonant background through polarization or time-delayed schemes,59 as well as using interferrograms to extract the imaginary part of the χ(3) tensor.38, 60, 61 We mostly use phase retrieval method, which is based on the Kramers–Kronig relationship.62, 63 It can be understood in a rather simple way: if one measures the absolute value of χ(3) everywhere in the spectral domain, then, since its imaginary and real components are related through a modified Kramers–Kronig relationship.63 The difficult part is the algorithm, which allows fast and accurate retrieval based on the partially measured spectrum. Apparently, maximum entropy method (MEM) works extremely well for this purpose.61, 64 The accuracy and reproducibility are greatly enhanced, if a broadband CARS spectrum is measured. Since there are no vibrational lines in the spectral region from 1900 to 2400 cm−1, this region serves as a good reference and ensures high fidelity Raman spectra retrieved from CARS spectra. The bandwidth of the generated CARS spectrum is governed by the phase-matching conditions, and, generally, it is considered that tightly focusing arrangement, which minimizes the interaction length, results in a broader bandwidth. We find that by normalizing the CARS spectrum from a sample under study to the CARS signal taken from a water solution, which does not have significant resonances in the spectral region of our interest, under the same excitation conditions can dramatically extend the bandwidth of CARS measurements. The same normalization procedure also avoids the uncertainty of the spectral response of the CCD and transmission factors of spectrometer and all optical elements. We have incorporated phase retrieval algorithm into data acquisition LabView-VI routine (National Instruments, Inc., Austin, TX) using MathLab programming language. It normally takes 1 s for a retrieval of a single spectrum consisting of 1024 data points on a single-processor PC (1.5 GHz CPU). With the continuous development of field-programmable array technology,65 we expect this time to be cut significantly to submillisecond level. One of the less obvious advantages of the phase retrieval is that the nonresonant background serves the purpose of heterodyning signal, i.e., effectively amplifying the resonant CARS signal above the noise level of a typical detector. It is especially important for high-speed spectral imaging, which has to utilize CMOS detectors with a typical read-out noise of 100–200 electrons∕pixel. Rather than talking about other advantages of the phase retrieval methods, we would focus here on its limitations. First, it actually works best when the resonances in CARS signal are relatively weak. It can be understood by following the assumptions of Ref. 62, which heavily relies on the dominance of the nonresonant contribution. When it is not true, as it is illustrated in the following example where a concentrated solution of sodium nitrate, which is a typical inorganic component of many biological buffers, was used as a sample. The resonant CARS line is very pronounced, but a directly applied phase retrieval algorithm gives an amended spectral shape, which is much different from the one measured using a conventional spontaneous Raman spectroscopy (Fig. 8). However, this type of features can be successfully incorporated into retrieval algorithm, and the following example of CARS spectrum of trans-stilbene (Fig. 9) clearly shows that such effects can be taken off. The second unpleasant feature of the retrieved Raman spectra is that, while the positions of all Raman lines agree very well with the ones measured in Raman spectroscopy, their relative amplitudes can be substantially different. Since we see the most differences, when the sample under study has appreciable resonance absorption, we attribute this to a spectrally dependent Raman scattering. It is difficult to quantify these effects, and, clearly, more work is required to acquire a better understanding of this effect, so the best way to deal with this problem is to treat the retrieved Raman spectra as normal Raman spectra, and use the advanced statistical methods of multivariant data analysis66 applied to CARS spectra. However, this tedious task will require a comprehensive library of those CARS and retrieved Raman spectra similar to those already available for IR and Raman spectra of major biological molecules and compounds.67 The final remark is about possible limitations of using retrieval methodology. We have already shown that noisy data is not an obstacle for phase retrieval procedure.21 Recently, we tried to evaluate how much of the nonresonant background can be handled by the phase retrieval algorithm. The following example was taken for a physiological D-glucose solution (10 mM). The CARS spectrum in the fingerprint area shows just a tiny modulation [see Fig. 10a], while the retrieved Raman spectrum shows all the characteristic lines of D-glucose with high signal-to-noise ratio [see Fig. 10b]. One can understand this using a simple estimation. Using a 16-bit detector, we typically achieved 12-bit dynamic range of signal detection. With the resonant background of about 1% of the total signal, it corresponds to about 50:1 SNR for the retrieved Raman signal, and this is about what we observed in our real data. Since the retrieved signal is scaled linearly with the concentration, we should expect that for the SNR = 1 the minimally detected concentration of glucose should be 0.2 mM. If more sensitivity is required, one can reduce the nonresonant background using polarization or time-delayed scheme, while simultaneously increase the data acquisition time to use the full dynamic range of the CCD detector.
Figure 8.
(a) CARS, (b) retrieved Raman, and (c) experimentally measured Raman (λexcitation = 532 nm) spectra of a concentrated (100 mM) sodium nitrate solution. Retrieved Raman spectrum shows amended shape of the Raman line.
Figure 9.
(a) CARS, (b) retrieved Raman, and (c) experimentally measured Raman (λexcitation = 532 nm) spectra of a trans-stilbene solution (100 mM). Retrieval procedure was modified to take into account relatively weak non-resonant background.
Figure 10.
(a) CARS and (b) retrieved Raman spectra from a 10-mM solution of D-glucose.
CARS Microspectroscopy Imaging and Sensing
Imaging Application of CARS Microspectroscopy
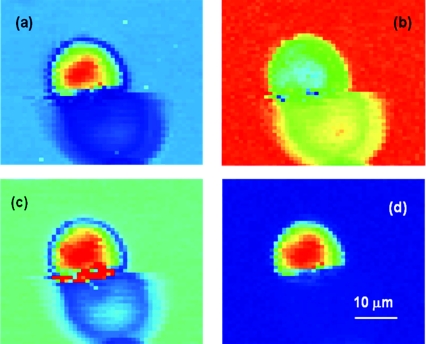
The ability of CARS microspectroscopy to measure the full Raman spectrum at any given point of the sample opens a wide window of opportunity to create the 3-D chemical distribution maps of the complex samples with unprecedented acquisition speed. In the following example, where the imaging speed was limited solely by the speed of the used detector (a typical scientific-grade CCD camera allows setting up a short data acquisition time, but still needs a rather long transfer time), we collected CARS spectra in the spectral region from about 500 to 2000 cm−1 using a millisecond-level acquisition time by scanning a sample through the focal volume. Our sample was made out of CyGEL,68 in which polystyrene microspheres were incorporated as targeted objects. We first acquired the CARS and Raman spectra of both the CyGEL and polystyrene to make sure once again that retrieved Raman and independently measured Raman spectra were in a good agreement for both materials (see Figs. 1112). Then we identified specific Raman lines to detect the presence of each chemical substance (at around 850 cm−1 for CyGEL and at around 1000 cm−1 for polystyrene) and plotted the CARS images for both the CyGEL and polystyrene distribution [see Figs. 13a, 13b]. While both chemically specific images of polystyrene [Fig. 13a] and CyGEL [Fig. 13b] seem to reflect the distribution of chemicals in the scanning plane, we note that for a “nonspecific” case [see Fig. 13c], where CARS signal was taken at around 1800 cm−1, we also observed a characteristic signal distribution, as it is shown in Fig. 13a. However, when we first retrieved all the Raman spectra, and took the difference signal at “polystyrene-specific” line and at “nonspecific” location, the image contrast was significantly improved. We believe that the refractive index contrast plays an important role in the development of the image seen in Fig. 13c, similar to the one observed in the case of third harmonic generation microscopy.10 However, retrieved Raman spectra provide a better chemical contrast, which is free of artifacts caused by refractive index distribution and object shadowing.
Figure 11.
(a) CARS, (b) retrieved Raman, and (c) experimentally measured Raman (λexcitation = 532 nm) spectra of a CyGEL.
Figure 12.
(a) CARS, (b) retrieved Raman, and (c) experimentally measured Raman (λexcitation = 532 nm) spectra of polystyrene.
Figure 13.
Chemically specific images of polystyrene beads in CyGEL. (a) “polystyrene-specific” CARS image, (b) “Cy-GEL-specific” CARS image, (c) nonspecific CARS image, and (d) the difference retrieved Raman image.
Sensing Application of CARS Microspectroscopy
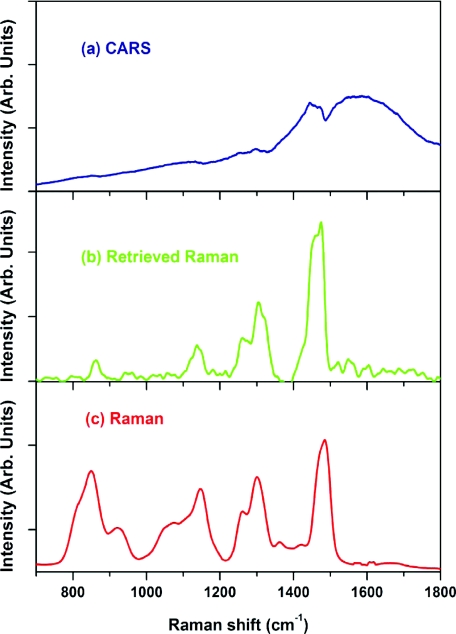
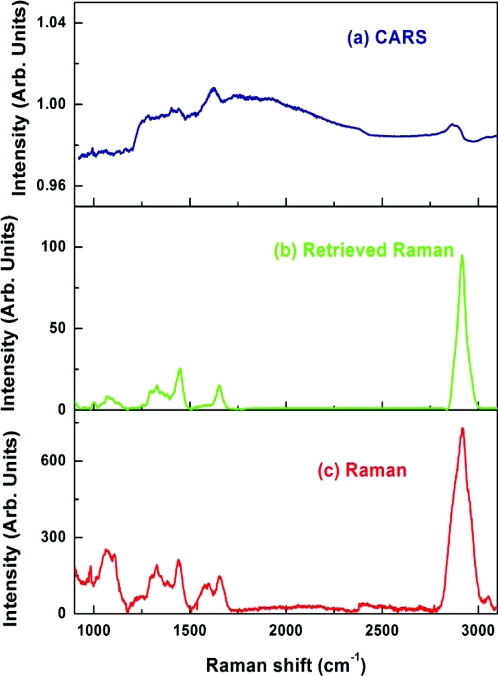
One of the main applications of our CARS microspectroscopy system is high-throughput vibrational cytometry. We evaluated the possibility of collecting CARS spectra of individual cells. To do so, we used Saccharomyces cerevisiae (baker's yeast) cells placed in fused silica capillary tube. We used about 50 mW in the pump∕probe beam and about 50 mW in the Stokes beam weakly focused into a 5-micron spot. To minimize the interaction length of the beams, we used a folded BoxCARS geometry.69 CARS spectra were routinely collected using an acquisition time of 10 ms. Retrieved Raman spectra show a clear resemblance with spontaneous Raman signal, which took significantly longer time to collect (see Fig. 14). We also noticed that the major limiting factor in speeding up the data acquisition was not the peak power, but the average power of the incident beams, which resulted in the temperature build up and the apparent damage of the irradiated cell occurring on the time scale of several seconds. By slowly flowing those cells through the tube, we were able to increase the incident beam power and shorten the acquisition time to 1-ms level without sacrificing the quality of the signal. We anticipate that with higher flowing speeds we can use even more incident power, pushing down the acquisition time even further. In the same time, our detection side can be further optimized. In the presence setting, an optical fiber is used to deliver the optical signal to the spectrometer. This results in about 50% signal transmission, which is further reduced by the 30% transmission of the spectrometer. Using an optimized high-throughput spectrometer and eliminating intermediate losses we expect that the optical signal will be strong enough to match the maximum spectral acquisition speed of 140,000 spectra∕s, which is currently available through line-scan CMOS devices.70
Figure 14.
(a) CARS (acquisition time – 10 ms), (b) retrieved Raman, and (c) experimentally measured Raman (λexcitation = 532 nm; acquisition time – 60 s) spectra of an yeast cell.
Conclusions
In this report we outlined recent advances of laser technology and data acquisition, which now allow CARS microspectroscopy imaging with an unprecedented speed. By carefully designing the optical system and optimizing the signal-to-noise ratio through expanding the excitation volume and increasing the incident power of the incident beams, we achieved several orders improvements in terms of the signal strength. The designed system is favorably compared to both the IR and Raman imaging in terms of the acquisition speed; it provide with the same information content and is rather inexpensive, i.e. potential users do not have to pay extra for the significantly improved performance. The use of fiber lasers and CMOS detectors allow compactness and low operating cost. We anticipate further dramatic developments to happen on the data analysis end, where the real-time data analysis is yet to be demonstrated. The developed system is ready for rapid analysis of particles and cells and can be used for fast chemical analysis of tissues.71, 72
Acknowledgments
This work was partially supported by the NIH grants R21EB011703 and R15 EY020805 and NSF grants ECS-0925950 and DBI-0964225.
References
- Weissleder R., “Molecular imaging in cancer,” Science 312, 1168–1171 (2006). 10.1126/science.1125949 [DOI] [PubMed] [Google Scholar]
- Huang D., Swanson E. A., Lin C. P., Schuman J. S., Stinson W. G., Chang W., Hee M. R., Flotte T., Gregory K., Puliafito C. A., and Fujimoto J. G., “Optical coherence tomography,” Science 254, 1178–1181 (1991). 10.1126/science.1957169 [DOI] [PMC free article] [PubMed] [Google Scholar]
- Itzkan I., Qiu L., Fang H., Zaman M. M., Vitkin E., Ghiran L. C., Salahuddin S., Modell M., Andersson C., Kimerer L. M., Cipolloni P. B., Lim K. H., Freedman S. D., Bigio I., Sachs B. P., Hanlon E. B., and Perelman L. T., “Confocal light absorption and scattering spectroscopic microscopy monitors organelles in live cells with no exogenous labels,” Proc. Natl. Acad. Sci. U.S.A. 104, 17255–17260 (2007). 10.1073/pnas.0708669104 [DOI] [PMC free article] [PubMed] [Google Scholar]
- Li C. H. and Wang L. H. V., “Photoacoustic tomography and sensing in biomedicine,” Phys. Med. Biol. 54, R59-R97 (2009). 10.1088/0031-9155/54/19/R01 [DOI] [PMC free article] [PubMed] [Google Scholar]
- Richards-Kortum R. and Servick-Muraca E., “Quantitative optical spectroscopy for tissue diagnosis,” Ann. Rev. Phys. Chem. 47, 555–606 (1996). 10.1146/annurev.physchem.47.1.555 [DOI] [PubMed] [Google Scholar]
- Wagnieres G. A., Star W. M., and Wilson B. C., “In vivo fluorescence spectroscopy and imaging for oncological applications,” Photochem. Photobiol. 68, 603–632 (1998). 10.1111/j.1751-1097.1998.tb02521.x [DOI] [PubMed] [Google Scholar]
- Zipfel W. R., Williams R. M., Christie R., Nikitin A. Y., Hyman B. T., and Webb W. W., “Live tissue intrinsic emission microscopy using multiphoton-excited native fluorescence and second harmonic generation,” Proc. Natl. Acad. Sci. U.S.A. 100, 7075–7080 (2003). 10.1073/pnas.0832308100 [DOI] [PMC free article] [PubMed] [Google Scholar]
- Skala M. C., Riching K. M., Gendron-Fitzpatrick A., Eliceiri K. W., and Ramanujam N., “In vivo mutiphoton microscopy of metabolic oxidation-reduction states and fluorescence lifetimes in normal and precancerous epithelia,” Proc. Natl. Acad. Sci. U.S.A. 104, 19494–1499 (2007). 10.1073/pnas.0708425104 [DOI] [PMC free article] [PubMed] [Google Scholar]
- Campagnola P. J. and Loew L. M., “Second-harmonic imaging microscopy for visualizing biomolecular arrays in cells, tissues and organisms,” Nat. Biotech. 21, 1356–1360 (2003). 10.1038/nbt894 [DOI] [PubMed] [Google Scholar]
- Barzda V., Greenhalgh C., Aus der Au J., Elmore S., van Beek J., and Squier J., “Visualization of mitochondria in cardiomyocytes by simultaneous harmonic generation and fluorescence microscopy,” Opt. Express 13, 8263–8276 (2005). 10.1364/OPEX.13.008263 [DOI] [PubMed] [Google Scholar]
- Hudson B. S., “New laser techniques for biophysical studies,” Ann. Rev. Biophys. Bioengineer. 6, 135–150 (1977). 10.1146/annurev.bb.06.060177.001031 [DOI] [PubMed] [Google Scholar]
- Duncan M. D., Reintjes J., and Manuccia T. J., “Scanning coherent anti-Stokes Raman microscope,” Opt. Lett. 7, 350–352 (1982). 10.1364/OL.7.000350 [DOI] [PubMed] [Google Scholar]
- Zumbusch A., Holtom G. R., Xie X. S., “Three-dimensional vibrational imaging by coherent anti-Stokes Raman scattering,” Phys. Rev. Lett. 82, 4142–4145 (1999). 10.1103/PhysRevLett.82.4142 [DOI] [Google Scholar]
- Evans C. L., Potma E. O., Puoris'haag M., Cote D., Lin C. P., and Xie X. S., “Chemical imaging of tissue in vivo with video-rate coherent anti-Stokes Raman scattering microscopy,” Proc. Natl. Acad. Sci. U.S.A. 102, 16807–16812 (2005). 10.1073/pnas.0508282102 [DOI] [PMC free article] [PubMed] [Google Scholar]
- Evans C. L. and Xie X. S., “Coherent Anti-Stokes Raman Scattering Microscopy: Chemical Imaging for Biology and Medicine,” Ann. Rev. Anal. Chem. 1, 883–909 (2008). 10.1146/annurev.anchem.1.031207.112754 [DOI] [PubMed] [Google Scholar]
- Dudovich N., Oron D., and Silberberg Y., “Single-pulse coherently controlled nonlinear Raman spectroscopy and microscopy,” Nature 418, 512–514 (2002). 10.1038/nature00933 [DOI] [PubMed] [Google Scholar]
- Scully M. O., Kattawar G. W., Lucht R. P., Opatrny T., Pilloff H., Rebane A., Sokolov A. V., and Zubairy M. S., “FAST CARS: Engineering a laser spectroscopic technique for rapid identification of bacterial spores,” Proc. Natl. Acad. Sci. U.S.A. 99, 10994–11001 (2002). 10.1073/pnas.172290899 [DOI] [PMC free article] [PubMed] [Google Scholar]
- Li H. W., Harris D. A., Xu B., Wrzesinski P. J., Lozovoy V. V., and Dantus M., “Coherent mode-selective Raman excitation towards standoff detection,” Opt. Exp. 16, 5499–5504 (2008). 10.1364/OE.16.005499 [DOI] [PubMed] [Google Scholar]
- Krafft C., Dietzek B., and Popp J., “Raman and CARS microspectroscopy of cells and tissues,” Analyst 134(6), 1046–1057 (2009). 10.1039/b822354h [DOI] [PubMed] [Google Scholar]
- Konorov S. O., Glover C. H., Piret J. M., Bryan J., Schulze H. G., Blades M. W., and Turner R. F. B., “In situ analysis of living embryonic stem cells by coherent anti-stokes Raman microscopy,” Anal. Chem. 79(18), 7221–7225 (2007). 10.1021/ac070544k [DOI] [PubMed] [Google Scholar]
- Petrov G. I., Arora R., Yakovlev V. V., Wang X., Sokolov A. V., and Scully M. O., “Comparison of coherent and spontaneous Raman microspectroscopies for noninvasive detection of single bacterial endospores,” Proc. Natl. Acad. Sci. U.S.A. 104, 7776–7779 (2007). 10.1073/pnas.0702107104 [DOI] [PMC free article] [PubMed] [Google Scholar]
- Wang H. F., Fu Y., Zickmund P., Shi R. Y., and Cheng J. X., “Coherent anti-stokes Raman scattering imaging of axonal myelin in live spinal tissues,” Biophys. J. 89, 581–591 (2005). 10.1529/biophysj.105.061911 [DOI] [PMC free article] [PubMed] [Google Scholar]
- Yakovlev V. V., “Advances in real-time nonlinear Raman microscopy,” Proc. SPIE 4254, 97–105 (2001). 10.1117/12.427951 [DOI]
- Yakovlev V. V., “Advanced instrumentation for nonlinear Raman microscopy,” J. Raman Spectr. 34, 957–964 (2003). 10.1002/jrs.1090 [DOI] [Google Scholar]
- Kee T. W. and Cicerone M. T., “Simple approach to one-laser, broadband coherent anti-Stokes Raman scattering microscopy,” Opt. Lett. 29, 2701–2703 (2004). 10.1364/OL.29.002701 [DOI] [PMC free article] [PubMed] [Google Scholar]
- Kano H. and Hamaguchi H., “Femtosecond coherent anti-Stokes Raman scattering spectroscopy using supercontinuum generated from a photonic crystal fiber,” Appl. Phys. Lett. 85, 4298–4300 (2004). 10.1063/1.1818741 [DOI] [Google Scholar]
- Le T. T., Langohr I. M., Locker M. J., Sturek M., and Cheng J. X., “Label-free molecular imaging of atherosclerotic lesions using multimodal nonlinear optical microscopy,” J. Biomed. Opt. 12, 054007 (2007). 10.1117/1.2795437 [DOI] [PMC free article] [PubMed] [Google Scholar]
- Akhmanov S. A. and Koroteev N. I., Methods of Nonlinear Optics in Light Scattering, Nauka, Moscow, 1981. [Google Scholar]
- Eesle G. L., Levenson M. D., and Tolles W. M., “Optically heterodyned coherent Raman spectroscopy,” IEEE J Quant Electron. 14, 45–49 (1978). 10.1109/JQE.1978.1069665 [DOI] [Google Scholar]
- Tolles W. M. and Turner R. D., “A comparative analysis of the analytical capabilities of coherent antistokes Raman spectroscopy (CARS) relative to Raman scattering and absorption spectroscopy,” Appl Spectrosc. 31, 96–103 (1977). 10.1366/000370277774463968 [DOI] [Google Scholar]
- Petrov G. I., Arora R., Saha A., Heathcote D., Yakovlev V. V., Ravula S., and Brener I., “Raman versus CARS microscopy: when one is better than the other,” Proceedings SPIE “Multiphoton Microscopy in the Biomedical Sciences VII” 6442–8 (2007).
- Pestov D., Ariunbold G. O., Wang X., Murawski R. K., Sautenkov V. A., Sokolov A. V., and Scully M. O., “Coherent versus incoherent Raman scattering: molecular coherence excitation and measurement,” Opt. Lett. 32, 1725–1727 (2007). 10.1364/OL.32.001725 [DOI] [PubMed] [Google Scholar]
- Arora R., Petrov G. I., and Yakovlev V. V., “Analytical application of nonlinear Raman microspectroscopy,” J. Modern Opt. 55(19–20), 3237–3254 (2008). 10.1080/09500340802168639 [DOI] [PMC free article] [PubMed] [Google Scholar]
- Cui M., Bachler B. R., and Ogilvie J. P., “Comparing coherent and spontaneous Raman scattering under biological imaging conditions,” Opt. Lett. 34, 773–775 (2009). 10.1364/OL.34.000773 [DOI] [PubMed] [Google Scholar]
- Pestov D., Murawski R. K., Ariunbold G. O., Wang X., Zhi M. C., Sokolov A. V., Sautenkov V. A., Rostovtsev Y. V., Dogariu A., Huang Y., and Scully M. O., “Optimizing the laser-pulse configuration for coherent Raman spectroscopy,” Science 316(5822), 265–268 (2007). 10.1126/science.1139055 [DOI] [PubMed] [Google Scholar]
- Vacano B. von, Buckup T., and Motzkus M., “Highly sensitive single-beam heterodyne coherent anti-Stokes Raman scattering,” Opt. Lett. 31, 2495–2497 (2006). 10.1364/OL.31.002495 [DOI] [PubMed] [Google Scholar]
- Roy S., Wrzesinski P., Pestov D., Gunaratne T., Dantus M., and Gord J. R., “Single-beam coherent anti-Stokes Raman scattering spectroscopy of N-2 using a shaped 7 fs laser pulse,” Appl. Phys. Lett. 95(7), 074102 (2009). 10.1063/1.3207829 [DOI] [Google Scholar]
- Chowdary P. D., Benalcazar W. A., Jiang Z., Marks D. M., and Boppart S. A., “High speed nonlinear interferometric vibrational analysis of lipids by spectral decomposition,” Anal. Chem. 82(9), 3812–3818 (2010). 10.1021/ac100222c [DOI] [PMC free article] [PubMed] [Google Scholar]
- Wang X., Zhang A. H., Zhi M. C., Sokolov A. V., and Welch G. R., “Glucose concentration measured by the hybrid coherent anti-Stokes Raman-scattering technique,” Phys. Rev. E 81(1), 013813 (2010). 10.1103/PhysRevA.81.013813 [DOI] [Google Scholar]
- König K., Hong L., Berns M. W., and Tromberg B. J., “Cell damage by near-IR microbeams,” Nature 377, 20–21 (1995). 10.1038/377020a0 [DOI] [PubMed] [Google Scholar]
- Konig K., Becker T. W., Fischer P., Riemann I., and Halbhuber K. J., “Pulse-length dependence of cellular response to intense near-infrared laser pulses in multiphoton microscopes,” Opt. Lett. 24, 113–115 (1999). 10.1364/OL.24.000113 [DOI] [PubMed] [Google Scholar]
- Kumru S. S., Cain C. P., Noojin G. D., Cooper M. E., Imholte M. L., Stolarski D. J., Cox D. D., Crane C. C., Rockwell B. A., “ED50 study of femtosecond terawatt laser pulses on porcine skin,” Las. Surg. Med. 37, 59–63 (2005). 10.1002/lsm.20195 [DOI] [PubMed] [Google Scholar]
- Squirrell J. M., Wokosin D. L., White J. G., and Bavister B. D., “Long-term two-photon fluorescence imaging of mammalian embryos without compromising viability,” Nat. Biotechnol. 17, 763–766 (1999). 10.1038/11698 [DOI] [PMC free article] [PubMed] [Google Scholar]
- Tauer U., “Advantages and risks of multiphoton microscopy in physiology,” Exp. Physiol. 87, 709–714 (2002). 10.1113/eph8702464 [DOI] [PubMed] [Google Scholar]
- Botchway S. W., Reynolds P., Parker A. W., and O’Neill P., “Use of near infrared femtosecond lasers as sub-micron radiation microbeam for cell DNA damage and repair studies,” Mutat. Res. 704, 38–44 (2010). 10.1016/j.mrrev.2010.01.003 [DOI] [PubMed] [Google Scholar]
- Chen I.-H., Chu S.-W., Sun C.-K., Cheng P.-C., and Lin B.-L., “Wavelength dependent damage in biological multi-photon confocal microscopy: A micro-spectroscopic comparison between femtosecond Ti:sapphire and Cr:forsterite laser sources,” Opt. Quant. Electron. 34, 1251–1266 (2004). 10.1023/A:1021303426482 [DOI] [Google Scholar]
- Cheong W. F., Prahl S. A., and Welch A. J., “A review of the optical properties of biological tissues,” IEEE J. Quant. Electron. 26, 2166–2185 (1990). 10.1109/3.64354 [DOI] [Google Scholar]
- Schonle A. and Hell S. W., “Heating by absorption in the focus of an objective lens,” Opt. Lett. 23, 325–327 (1998). 10.1364/OL.23.000325 [DOI] [PubMed] [Google Scholar]
- Petrov G. I. and Yakovlev V. V., “Enhancing red-shifted white-light continuum generation in optical fibers for applications in nonlinear Raman microscopy,” Opt. Exp. 13, 1299–1306 (2005). 10.1364/OPEX.13.001299 [DOI] [PubMed] [Google Scholar]
- Petrov G. I., Yakovlev V. V., and Minkovski N. I., “Broadband continuum-generation of the output of high-energy diode-pumped picosecond Nd:YVO4 laser,” Opt. Commun. 229, 441–445 (2004). 10.1016/j.optcom.2003.11.009 [DOI] [Google Scholar]
- Fermann M. E. and Hartl I., “Ultrafast fiber laser technology,” IEEE J. Quant. Electron. 15, 191–206 (2009). 10.1109/JSTQE.2008.2010246 [DOI] [Google Scholar]
- Limpert J., Roser F., Schimfn D. N., Seise E., Eidam T., Hadrich S., Rothhardt J., Misas C. J., and Tunnermann A., “High repetition rate gigawatt peak power fiber laser-systems: challenges, design, and experiment,” IEEE J. Quant. Electron. 15, 159–169 (2009). 10.1109/JSTQE.2008.2010244 [DOI] [Google Scholar]
- >US Patents 7,430,224, 7,430, 226, and 7,440,173.
- Russell P. S. J., “Photonic-crystal fibers,” J. Lightwave Technol. 24, 4729–4749 (2006). 10.1109/JLT.2006.885258 [DOI] [Google Scholar]
- Lin C. and Stolen R. H., “New nanosecond continuum for excited-state spectroscopy,” Appl. Phys. Lett. 28, 216–218 (1976). 10.1063/1.88702 [DOI] [Google Scholar]
- Gersten J. I., Alfano R. R., and Belic M., ‘‘Combined stimulated Raman scattering and continuum self-phase modulations,’’ Phys. Rev. A 21, 1222–1224 (1980). 10.1103/PhysRevA.21.1222 [DOI] [Google Scholar]
- Mitrofanov A. V., Ivanov A. A., Alfimov M. V., Podshivalov A. A., and Zheltikov A. M., “Microjoule supercontinuum generation by stretched megawatt femtosecond laser pulses in a large-mode-area photonic-crystal fiber,” Opt. Commun. 280, 453–456 (2007). 10.1016/j.optcom.2007.06.062 [DOI] [Google Scholar]
- Egermann J., Seeger T., and Leipertz A., “Application of 266-nm and 355-nm Nd: YAG laser radiation for the investigation of fuel-rich sooting hydrocarbon flames by Raman scattering,” Appl. Opt. 43, 5564–5574 (2004). 10.1364/AO.43.005564 [DOI] [PubMed] [Google Scholar]
- Volkmer A., “Vibrational imaging and microspectroscopies based on coherent anti-Stokes Raman scattering microscopy,” J. Phys. D 38, R59–R81 (2005). 10.1088/0022-3727/38/5/R01 [DOI] [Google Scholar]
- Kee T. W., Zhao H. X., and Cicerone M. T., “One-laser interferometric broadband coherent anti-Stokes Raman scattering,” Opt. Exp. 14, 3631–3640 (2006). 10.1364/OE.14.003631 [DOI] [PMC free article] [PubMed] [Google Scholar]
- Evans C. L., Potma E. O., and Xie X. S., “Coherent anti-Stokes Raman scattering spectral interferometry: determination of the real and imaginary components of nonlinear susceptibility χ(3) for vibrational microscopy,” Opt. Lett. 29, 2923–2925 (2004). 10.1364/OL.29.002923 [DOI] [PubMed] [Google Scholar]
- Variainen E. M., “Phase retrieval approach for coherent anti-Stokes Raman scattering spectrum analysis,” J. Opt. Soc. Am. B 9, 1209–1214 (1992). 10.1364/JOSAB.9.001209 [DOI] [Google Scholar]
- Lucarini V., Saarinen J. J., Peiponen K.-E., and Vartiainen E. M., Kramers-Kronig Relations in Optical Materials Research, Springer, Heidelberg, 2005. [Google Scholar]
- Narayan R. and Nityananda R., “Maximum entropy image restoration in astronomy,” Ann. Rev. Astron. Astrophys. 24, 127–170 (1986). 10.1146/annurev.aa.24.090186.001015 [DOI] [Google Scholar]
- Desjardins A. E., Vakoc B. J., Suter M. J., Yun S. H., Teraney G. J., and Bouma B. E., “Real-time FPGA processing for high-speed optical frequency domain imaging,” IEEE Trans. Med. Imag. 28, 1468–1472 (2009). 10.1109/TMI.2009.2017740 [DOI] [PMC free article] [PubMed] [Google Scholar]
- Shinzawa H., Awa K., Kanematsu W., and Ozaki Y., “Multivariant data analysis for Raman spectroscopic imaging,” J. Raman Spectr. 40, 1720–1725 (2009). 10.1002/jrs.2525 [DOI] [Google Scholar]
- De Gelder J., De Gussem K., Vandernabeele P., and Moens L., “Reference database of Raman spectra of biological molecules,” J. Raman Spectr. 38, 1133–1147 (2007). 10.1002/jrs.1734 [DOI] [Google Scholar]
- www.biostatus.com/product/cygel.
- Muller M., Squier J., De Lange C. A., and Brakenhoff G. J., “CARS microscopy with folded BoxCARS phasematching,” J. Microsc. 197, 150–158 (2000). 10.1046/j.1365-2818.2000.00648.x [DOI] [PubMed] [Google Scholar]
- http://www.baslerweb.com/beitraege/beitrag_en_55526.html.
- Wood B. R., Chiriboga L., Yee H., Quinn M. A., McNaughton D., and Diem M., “FTIR mapping of the cervical transformation zone, squamous and glandular epithelium,” Gynecol. Oncol. 93, 59–68 (2004). 10.1016/j.ygyno.2003.12.028 [DOI] [PMC free article] [PubMed] [Google Scholar]
- Fernandez D. C., Bhargava R., Hewitt S. M., and Levin I. W., “Infrared spectroscopic imaging for observer-invariant histopathology,” Nat. Biotechnol. 23, 469–474 (2005). 10.1038/nbt1080 [DOI] [PubMed] [Google Scholar]


