

Abstract
Objective
The purpose of this study was to develop and test a computer-assisted detection method for identification and measurement of pulmonary abnormalities on chest CT in cases of infection, such as novel H1N1 influenza. The method developed could be a potentially useful tool for classifying and quantifying pulmonary infectious disease on CT.
Subjects and Methods
Forty Chest CTs were studied using texture analysis and support vector machine (SVM) classification to differentiate normal from abnormal lung regions on CT, including ten cases of immunohistochemistry proven infection, ten normal controls, and twenty cases of fibrosis.
Results
Statistically significant differences in the receiver operator characteristics (ROC) curves for detecting abnormal regions in H1N1 infection were obtained between normal lung and regions of fibrosis, with significant differences in texture features of different infections. These differences enable quantification of abnormal lung volumes in CT imaging.
Conclusion
Texture analysis and support vector machine classification can distinguish between areas of abnormality in acute infection and areas of chronic fibrosis, differentiate lesions having consolidative and ground glass appearances, and quantify those texture features to increase the precision of CT scoring as a potential tool for measuring disease progression and severity.
Keywords: Computer Aided Diagnosis, Pulmonary Infection, Texture Analysis
INTRODUCTION
In trying to increase the clinical utility of infectious disease imaging, researchers currently face several challenges, including the relatively low specificity for diagnosing pathogens and the limited quantification of disease burden for assessing severity and predicting outcomes. The low specificity of infectious disease imaging stems from the similarity between visual appearances of infectious and inflammatory diseases [1]. The second major challenge, quantification of severity through radiologic techniques, requires standardized methods for measuring lesions and translating those measurements into validated clinical implications. A third unsolved problem is that the detection of subtle pulmonary parenchymal changes may not be visually apparent and traditional visual scoring methods for pulmonary disease on computed tomography (CT) are often limited by inter-observer biases and lack of validation. These limitations came to light during the outbreak of novel swine-origin influenza A/H1N1 in 2009–2010 [2]. Reports indicated that severe infection with novel H1N1 demonstrate patchy ground glass opacities (GGO) with consolidations in thoracic CT scans [2–4]. Unfortunately, this visual appearance is so similar to other infectious and inflammatory etiologies that it is difficult to unequivocally diagnose H1N1 based on the CT alone [2, 5]. Although most cases of H1N1 were predominately mild in severity with a mortality of less than 1%, the severe cases often rapidly lead to respiratory impairment and death, and it was clinically and radiologically challenging to prognosticate and identify these severe cases for earlier treatment [6].
The following study presents a pilot method for detecting and quantifying H1N1 pulmonary infection using computer-assisted texture analysis and support vector machines (SVM). To our knowledge, H1N1 pulmonary infection and associated inflammation have not been characterized using texture analysis to date. Simply defined, texture analysis quantifies an image by identifying statistical relationships among the pixels’ densities, which can be used to identify lesions and quantify the volume of an organ manifesting those patterns associated with lesions. It has been established that specific tissues and even specific pathologies yield unique texture patterns in Chest CT images. Therefore, these textures could be important attributes for characterizing and distinguishing objects, lesions, and regions [7].
Several texture-based recognition systems have been developed to take advantage of these differences and classify pulmonary tissue patterns. Sluimer et al. [8] summarized the progress through 2006 in lung segmentation, registration, nodule detection, tissue quantification and classification for assessing emphysema, pulmonary nodules, pulmonary embolism, and airway pathology. Rikxoort et al. [9] proposed an automatic method to segment the lungs, lobes and pulmonary segments – an important development for measuring lung volumes and locating lesions. The lobes are segmented with high accuracy through voxel classification based on texture properties and relationships to fissures. Uppaluri et al. [10] introduced Adaptive Multiple Feature Method (AMFM), which assesses up to 22 texture features for the classification of pulmonary tissue patterns into six categories. Zavaletta et al. [11] proposed a 3D texture analysis method based on morphology. Caban et al. [12] investigated the effects of texture block selection, data reduction, and texture smoothing in a CAD system for lung fibrosis. Lee et al. [10] compared three classification techniques in lung CAD systems and concluded that support vector machines (SVM) achieved the best performance. Yao et al. [7] developed a lymphangioleiomyomatosis (LAM) detection and classification method based on statistical texture analysis and machine learning techniques.
In this study, we developed a texture-based detection and classification method to quantitatively differentiate the pulmonary lesions in novel swine-origin influenza A/H1N1 infected patients from visually normal lung parenchyma in CT data. To further assess this method, we also compared the texture features in these patients to the CT texture patterns in individuals with normal lungs fibrosis and several infections other than H1N1, including mycobacterium avium complex (MAC), parainfluenza, and bacterial pneumonia. We hypothesize that texture analysis of CT data can accurately identify areas of abnormal lung on CT in H1N1 patients using features that are quantifiably different from those of normal lungs, fibrosis, and other infections.
METHODS
2.1 Data sets
The IRB approved our retrospective sampling and experimental design. The data set included forty chest CTs, summarized in Table 1. The H1N1-infected cohort included four patients with autopsy-proven (by histology, immunohistochemistry and reverse transcriptase polymerase chain reaction ) infections. In each of these cases, the patient had a chest CT without contrast, performed in helical mode with 5mm slice thickness, body filter, and lung kernel [6]. Each of these patients had pathology and immunohistochemistry for proof of infection. The pulmonary fibrosis cohort was comprised of 20 individuals confirmed by pathology and clinical data to have fibrosis secondary to lymphangioleiomyomatosis (LAM). To identify interstitial lung disease, thin-cut (1 to 1.25 mm slice thickness) HRCT scans of the chest in prone position were performed using a high resolution technique with 1 mm slice thickness at 3 cm intervals. The normal CT cohort included 10 individuals from a screening study. Thin-cut (1 to 1.25 mm slice thickness) HRCT scans of the chest were used. Four cases of infection other than H1N1 were included in this study to assess whether infections other than influenza present distinguishable texture patterns.
Table 1.
Summary of patient population
| Cohort | Number of patients (Male/Female) | Age range (Mean±Std) |
|---|---|---|
| H1N1 | 4 (3/1) | 31 – 59 (50±13) |
| Fibrosis | 20 (11/9) | 30 – 79 (55±12) |
| Normal | 10 (4/6) | 38 – 75 (53±12) |
| Infection other than H1N1 | ||
| Pneumonia | 3 (3/0) | 17—44 (33±14) |
| Para-influenza | 2 (1/1) | 59 – 60 |
| Mycobacterium Avium Complex | 1 (1/0) | 82 |
| All | 40 (17/23) | 17—82 (53±14) |
2.2 Method overview
Given a chest CT data set, the proposed CAD system first segments the lungs and then analyzes the texture patterns. A classifier is then trained to distinguish regions of abnormal lung region from visually normal lung regions. Figure 1 presents a diagram of the proposed system.
Figure 1.
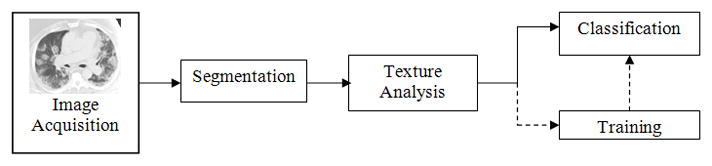
Method diagram for image analysis.
2.3 Lung Segmentation
We have developed a segmentation technique that, using region-growing and dynamic programming, accurately segments the left and right lungs. First, the trachea is located and segmented out, and based on the trachea’s position; two seed points are placed in the right and left lungs. Then, by means of a 3D region-growing algorithm, the seeds are expanded to segment the entire area of the lungs. A histogram-based thresholding technique is used to refine the segmentation. Finally, a rolling ball algorithm is applied to smooth the lung boundary. As part of the segmentation process, we distinguish between the left and right lungs and compute the volume of each.
2.4 Texture analysis
Once a lung is segmented, its image is subdivided into texture blocks of which the characteristic texture features are calculated. The default texture block size is 16×16 pixels, but the software provides the flexibility to change the block size as needed. Figure 2 shows a set of texture blocks for a visually normal lung, regions of abnormal opacity in swine-origin novel H1N1 and blocks of lung fibrotic tissues. A multi-dimensional feature vector is computed to differentiate and classify each block.
Figure 2. Texture examples.
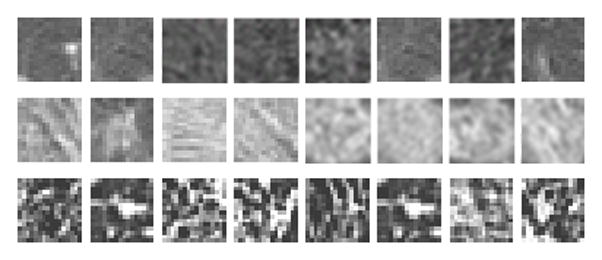
First Row: normal lung; second row: H1N1 associated lung opacities; third row: lung fibrotic tissues. Each block contains 16×16 pixels.
The feature vector is composed of 25 different texture features, including mean and variance features from histogram statistics, energy and correlation features from a co-occurrence matrix [12], and short-run and long-run emphasis features from a run-length matrix [13]. Table 2 lists the 25 texture features computed for each texture block. In particular, density mean is an average density among the blocks; density deviation measures the statistical variability of density among the pixels in the blocks; correlation reflects the mathematical relationship of adjacent pixels; average sum is the total number of correlated pixel pairs (with the same sum) in the texture block; gray level nonuniformity is the orderliness or randomness of the pixel densities among the blocks which can indicate the degree of structure, and gray-level run length emphasis measures consecutive pixels of the same density along particular orientations as another representation of structure.
Table 2.
List of texture features
| Histogram Statistics | Co-occurrence Matrix | Run-Length Matrix |
|---|---|---|
| Mean | Energy | Long run emphasis |
| Skewness | Inertia difference | Run length non-uniformity |
| Deviation | Correlation | Low gray-level run emphasis |
| Variance | Average difference | Short run low gray-level emphasis |
| Kurtosis | Entropy difference | Long run low gray-level emphasis |
| Inertia | Short run high gray-level emphasis | |
| Entropy | Long run high gray-level emphasis | |
| Average sum | Short run emphasis | |
| Entropy sum | Run gray-level non-uniformity | |
| Run percentage | ||
| High gray-level run emphasis | ||
2.5 Training and Support Vector Machines
In the training stage the computer learns texture patterns of normal lung, regions of ground glass opacity in H1N1 cases and regions of fibrotic tissues. The training process involved three steps:
A radiologist manually selected portions of the CT images and labeled them as different tissue types.
The areas were divided in texture blocks (16 × 16 pixels) and a texture feature computation was performed on each block.
The set of feature vectors and texture blocks were fed into the support vector machine classifiers to best distinguish different types of tissue patterns.
The classification algorithm used in the CAD system is a committee of support vector machines (SVM). SVM is a supervised learning method that uses hyperplanes in a high dimensional space to classify and geometrically divide features among classes[13]. The signed distance of a feature to the hyperplanes indicates the likelihood of the feature belonging to a class (positive distance is associated with abnormal class, negative distance with normal class). It has been shown that an SVM committee configuration can improve the overall accuracy by breaking down a very high dimensional feature vector into subsets of fewer dimensions [14]. The members of the committee work collaboratively to reach the classification decision. The sum of the signed distances from all members is used as the SVM value and normalized to fall between 0 and 1. The feature selection and committee formation is achieved in the training stage. In this investigation, we trained two classifiers, one to differentiate between normal lung tissues and ground glass opacity in H1N1 cases, and the other to differentiate between ground glass opacity in H1N1 cases and the fibrotic tissues.
To evaluate the first of these capabilities, we used two H1N1 cases for training and the other two for testing. In the training phase, 398 texture blocks of abnormal opacity and 395 normal lung blocks were manually identified in the CTs the training cases. These data were used to train an SVM classifier. In the testing phase, the SVM classifier was applied to 12481 lesion blocks and 16741 normal blocks derived from the manually segmented regions of the lung CTs lung from the two test cases.
We then employed the same technique to differentiate regions of opacity in H1N1 infection from abnormal CT features in cases of lung fibrosis. In the training phase, we manually identified 278 fibrotic texture regions from 9 patients. These data together with the 398 texture blocks from H1N1 cases in the previous experiment formed the training set to train an SVM classifier. The classifier was then tested on 22360 new fibrosis regions from 11 patients and the same 12481 H1N1 regions in the test set.
2.6 Pixel-wise Classification
The fourth step is pixel-wise classification. Given a new CT study, the computer program produces for every pixel a score that serves as a basis for classification of the pixel. For every pixel, a texture block centered at the pixel is generated and texture features are computed. The SVM classifier trained in the previous step returns an SVM value ranging from 0 to 1. This value indicates the likelihood of a texture block belonging to a certain class; low ratings indicate a normal region and high ratings indicate a H1N1 region. After the SVM values are computed for the entire lung, a Gaussian filter is applied to smooth the SVM value map.
Similarly, when the classifier to differentiate between H1N1 abnormality and fibrotic tissue is applied, the classification result indicates the likelihood of a texture block belonging to H1N1 region or fibrotic region. The two classifiers can be applied sequentially, and in general, multiple classifiers can be used independently. For instance, a first classifier may be applied to determine whether a region is normal or abnormal, and then, if the tissue appears to be abnormal, a second classifier could determine the disease type.
2.7 Statistical Analysis
Descriptive statistical analysis (mean and standard deviation) was conducted on several texture features to evaluate the differences among the features of different diseases... Receiver operating characteristic (ROC) analysis was conducted to evaluate the CAD’s performance in differentiating H1N1 lesions from normal lung regions and H1N1 lesions from fibrotic regions. ROCKIT tools developed at the University of Chicago were used for the ROC analysis [15]. A T-test was conducted to evaluate the statistical significance of the difference between two tissue patterns.
RESULTS
We compared the texture values of different lung tissue patterns to assess if texture analysis could differentiate novel swine-origin influenza A/H1N1 infection from fibrosis, normal, and non-Influenza infections on CT. Figure 3 shows the means and error bars of six computed texture values: density mean, density deviation, correlation, average sum, gray-level non-uniformity and gray-level run emphasis. Of the total twenty-five features, these six features are selected by a feature selection algorithm to build an optimal classifier without over-training. These means are based on fifty texture blocks from each category (fibrosis, normal volunteer, H1N1 abnormal regions, normal-appearing regions in H1N1 patients, and the abnormal areas of MAC, bacterial pneumonia, and parainfluenza).
Figure 3. Comparison of six texture features for seven classes of patterns.
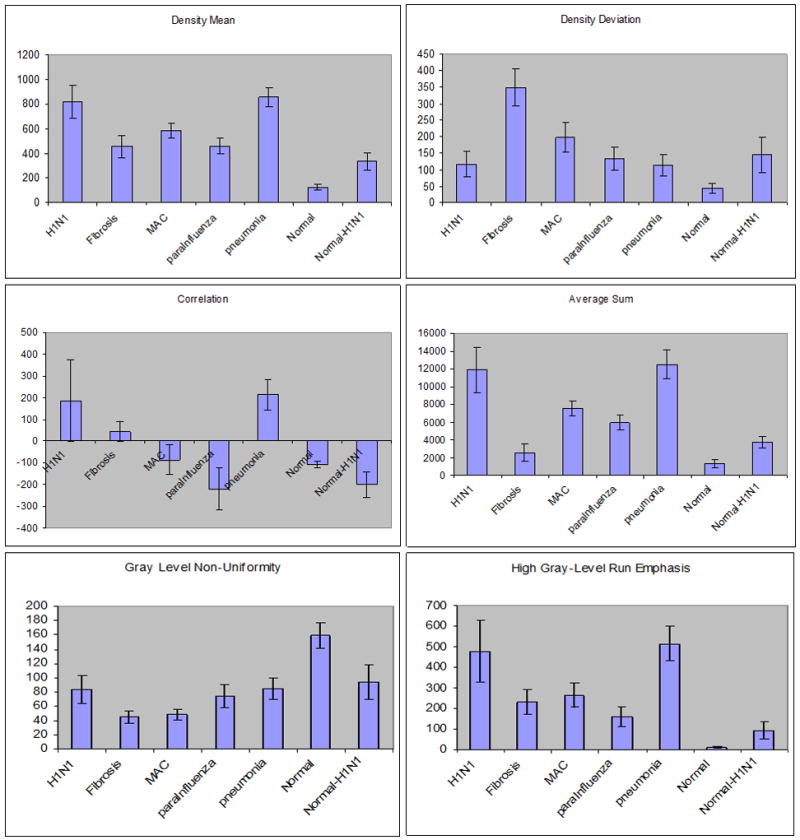
Descriptive statistics (mean and standard deviation of texture values) are plotted for six texture features (density mean, density deviation, correlation, average sum, gray level non-uniformity and high gray level run emphasis). Seven different texture patterns (H1N1, Fibrosis, MAC, parainfluenza, normal, and normal in H1N1) are compared. The features show statistically significant difference (p<10−3) between abnormal H1N1 region and fibrosis and between H1N1 region and normal lung regions.
The six computed features show consistent quantitative differentiation between abnormal regions on H1N1 CTs versus fibrosis. Moreover, there is consistent differentiation between normal CT data and the normal-appearing regions of CTs from H1N1 patients, suggesting that the visually normal areas of H1N1 CTs have subtle features that are not well-appreciated in visual inspection. The software also differentiated abnormal CT regions in H1N1 from MAC and para-influenza.
However, this texture analysis did not differentiate bacterial pneumonia from H1N1, which supports the known association between influenza and bacterial co-infection [6, 16]. Two of the H1N1 cases were diagnosed with bacterial pneumonia co-infection (Figure 4). To further study the texture features of H1N1 infection and bacterial pneumonia, we separated the two H1N1 cases with pneumonia from the two without pneumonia co-infection. Figure 4 compares the texture values of pneumonia, H1N1 with pneumonia and H1N1 without pneumonia. Density mean and average sum showed significant differences between bacterial pneumonia alone and H1N1 alone, with no significant difference between texture features of bacterial pneumonia and co-infection of H1N1 with bacterial pneumonia.
Figure 4. Comparison of texture patterns in pneumonia and H1N1 cases.
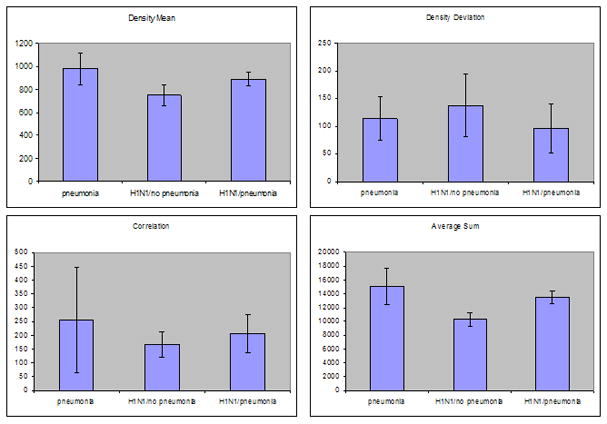
The H1N1 cases with pneumonia have texture values intermediate between those of pneumonia and H1N1 cases without pneumonia.
Pixel-wise classifications of texture features in H1N1 cases were analyzed using binary (abnormal versus normal) and graded techniques. These results are based on the SVM value; higher SVM values are more likely to be abnormal. Binary classifiers use a SVM of 0.5 as the cutoff, while graded techniques can indicate intermediate degrees of abnormality. Examples are shown in Figure 5, in which the top row depicts results from binary classification with abnormal areas coded red, and the bottom row (C,D) depicts graded classification in which red areas have high SVM values (more abnormal) versus yellow and green areas of respectively lower SVM values. These results suggest that graded classification identified more subtle areas of abnormality (Fig 5A and 5C), particularly along the central bronchial structures known to have pathology-proven infection that is difficult to recognize through visual inspection alone [6]. Based on the lung segmentation and pixel classification, we computed the total lung volume, the volume abnormal H1N1 regions and the ratio of abnormal lung to the entire lung (Table 3). The results indicated that more than one third of the lung volumes of the four influenza mortalities had abnormal features.
Figure 5. Pixel-wise classification.
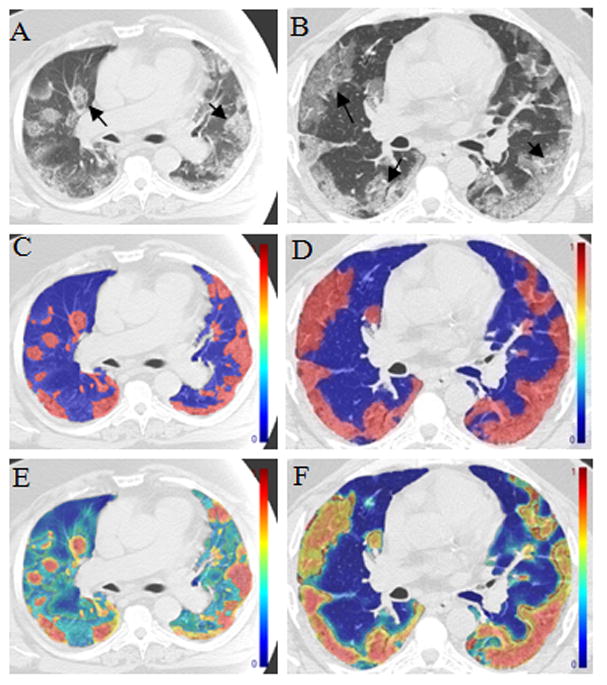
The left column (A, C, E) from one patient and the right (B, D, F) from the other patient with pathology and RT-PCR confirmed swine-origin Influenza A/H1N1 infection. A and B are the raw gray scale CT images. C and D are a binary depiction of pixel texture SVM values based on cutoff value of 0.5 in which colorized regions are detected as abnormal by the software. Images E and F are graded maps of the pixel texture SVM values. Graded classification presents subtle areas of abnormality as green and yellow, corresponding to pathology-proven regions of bronchitis.
Table 3.
Pixel-wise classification of four H1N1 cases.*
| Right Lung volume | Right Lung Abnormal | Left Lung Volume | Left Lung Abnormal | Total Lung Volume | Total Lung Abnormal | Right Lung Ratio | Left Lung Ratio | Total Lung Ratio | |
|---|---|---|---|---|---|---|---|---|---|
| Patient1 | 1617 | 1210 | 1662 | 262 | 3278 | 1472 | 0.75 | 0.16 | 0.45 |
| Patient2 | 1125 | 739 | 1211 | 195 | 2336 | 934 | 0.66 | 0.16 | 0.40 |
| Patient3 | 1809 | 623 | 1814 | 638 | 3624 | 1261 | 0.34 | 0.35 | 0.35 |
| Patient4 | 1659 | 405 | 1478 | 625 | 3138 | 1030 | 0.24 | 0.42 | 0.33 |
The volume is in the unit of cm3.
Table 3 presents the quantified proportion of lung volumes identified as abnormal relative to right lung (right lung ratio), left lung (left lung ratio) and total lung volumes measured on CT.
The mean SVM value for lesions was 0.80±0.10, and that for visually normal blocks was 0.33±0.24. A T-test showed that the difference between the lesions of increased ground glass opacity in novel H1N1 cases and visually normal blocks is statistically significant. Receiver operating characteristic (ROC) analysis of the CAD performance is plotted in Figure 6 for H1N1 against normal lungs and in Figure 7 for H1N1 against fibrosis regions. The areas under the ROC curves (Az) in Figure 6 were 0.999 (95% confidence interval, [0.997, 0.999]) for the training data and 0.993 (95% confidence interval, [0.992, 0.995]) for the test data. When all texture features were used, the Az was 0.999 for the training data and 0.994 for the test data. There was no statistically significant difference between using six selected texture features and using all features.
Figure 6.
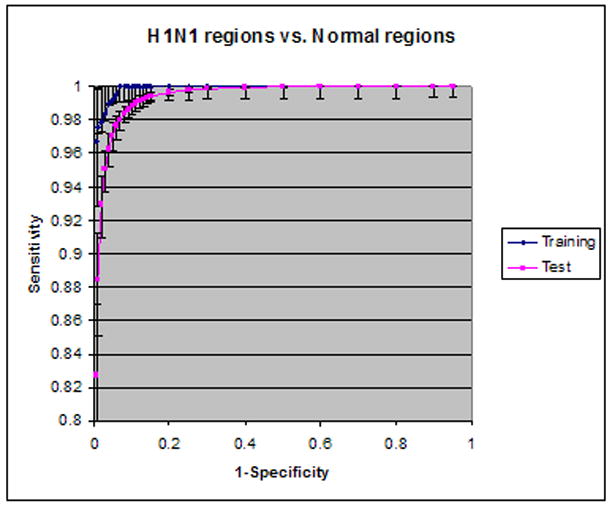
ROC analysis of H1N1 vs. normal lungs
Figure 7.
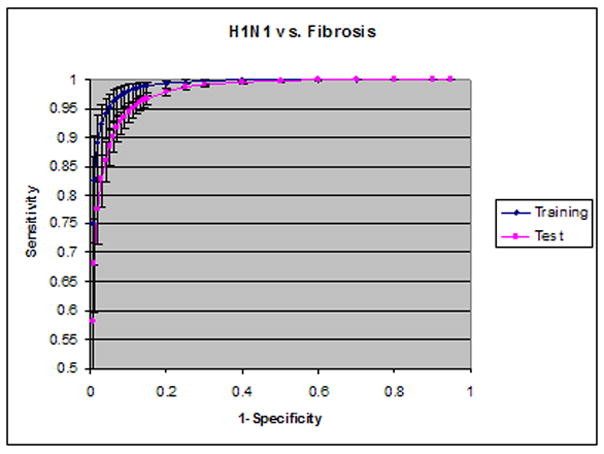
ROC analysis of H1N1 vs. fibrosis regions
Figure 8 shows two CTs from one patient, in which multiple visual patterns are present. These scans were tested by the classifier to assess whether the algorithm could differentiate fibrosis and consolidation in a case containing both patterns in the same CT. The resulting classifications showed that the software identified a new consolidation region (red) near adjacent areas of pre-existing fibrosis. This suggests that the patterns could be differentiated in images with temporal change.
Figure 8. Multi-pattern classification.
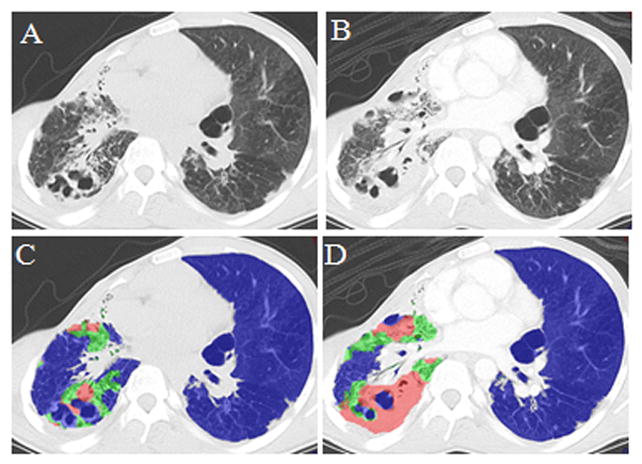
CT scan of a patient on 08/11/2009; B) CT scan of the same patient on 10/6/2009; C) Classification results superimposed on A); D) Classification result superimposed on B). Blue indicates normal lung or lung not having consolidation or fibrosis, green indicates fibrosis, and red indicates consolidation due to pneumonia (sputum culture proven aspergillums). Comparison shows that CAD differentiated fibrosis from new consolidation which developed on subsequent scan (B) in comparison to baseline scan (A).
DISCUSSSION
This study indicates that texture analysis can be a useful method for identifying regions of abnormality in novel swine-origin influenza A/H1N1 infection and provide quantifiable differentiation from other pulmonary diseases. Texture analysis entails the statistical evaluation of probabilities that particular density patterns are present in blocks of pixels, such that the software can use training information to then quantifiably identify structures and lesions. As a methodological pilot, the study demonstrates that texture analysis can differentiate abnormal regions from visually normal areas of lung parenchyma in patients with severe H1N1 infection. This finding could be used as a research or clinical tool to automate the detection of all abnormal areas using one standard parameter and then quantify the abnormality in proportion to lung volumes. This type of strategy may help to address inter-observer variance in conventional non-automated Chest CT scoring methods.
Texture analysis was also useful in differentiating areas of acute infection from fibrosis. This result is valuable because the differentiation of acute from chronic processes is an important element of evaluating infectious disease onset and progression. This is especially true since longstanding inflammation is associated with chronic fibrosis, and some patients with chronic fibrosis can present with acute episodes of inflammation and infection such as in the two CTs presented in Figure 8. To avoid the confounding factors of different fibrotic processes, this study only observed patients with fibrosis secondary to LAM. However, fibrosis can have heterogeneous visual features (such as secondary lobular septal thickening, volume loss, interstitial linear density, ground glass opacity, and cyst-formation) as well as a broad range of etiologies (such as idiopathic pulmonary fibrosis, asbestosis, collagen vascular disease, etc.).
The inclusion of several non-influenza infections, such as parainfluenza, nontuberculous MAC, and bacterial pneumonia was based on efforts to pilot test the method for differentiating pathogens, which has been a longstanding challenge of infectious disease imaging. The preliminary data in this study suggest that some differentiation is possible, but with important caveats at this time. Interestingly, texture analysis had many overlapping quantitative features between H1N1 and bacterial pneumonia, which is not a surprising result given the frequent association between these two infectious pathogens. In severe H1N1, available data show a 56% association with bacterial co-infection, and prior history of influenza pandemics show that co-infection is a driver of higher mortality [6, 16]. The texture analysis method employed for this study showed encouraging differentiation between cases of H1N1 infection alone versus bacterial pneumonia alone, with unsurprising difficulty of differentiating cases of H1N1 plus bacterial pneumonia co-infection from cases of bacterial pneumonia. Several texture analysis variables showed significant differences between H1N1 and MAC. This is an encouraging result for using texture analysis to compare viral and mycobacterial infection, which are known to have different pathophysiologic processes.
The study also shows that a graded classification method can yield the detection of intermediate abnormalities. This finding is particularly germane to the H1N1 cases that have pathology-proven evidence of tracheal-bronchial infection and inflammation along the central bronchial structures [6].
Finally, using the training set in this study, we tested the method on a CT containing both fibrosis and consolidation to assess accuracy in images containing mixed imaging features. A patient with culture-proven aspergillous infection superimposed on fibrosis with computer-assisted classification results demonstrated the potential of our technique to identify temporal changes.
FUTURE WORK
The limited number of cases in this pilot study warrants an expanded case-set for future investigation. Furthermore, the diversity of the disease prompts us to include more diverse etiologies of fibrosis to expand the texture analysis comparison to acute infection [17, 18]. We also plan to include larger series of animal studies that use careful pathology-radiology correlation in serial sacrifice and parallel imaging to address this application of texture analysis.
In this study, spatial anatomical location (such as which lobes or central versus peripheral/sub-pleural) of the abnormalities and lesions’ shapes are not included in the quantitative analysis. This is a limiting factor because H1N1 abnormalities may appear in peripheral lower airways and distal airspaces as manifestations of or contributors to increased virulence [19]. The clinical significance of spatial information, such as the impact on respiratory function and recovery, is not clear at this time, which suggests that spatial location of the abnormalities might be a fruitful target for future study.
Linking texture features, such as the six presented graphically (Figure 4), to pathogenic mechanisms is an important objective for infectious disease imaging. The relevant question is: do the texture features indicate some microbiological aspect of the pathogen’s interaction with host? For example, can the measures of homogeneity and uniformity of pixel data among the blocks correspond to the pathogenesis patterns? This study is not designed to answer such questions because the autopsy-based pathology results were often days apart from the CT imaging, limiting the exact match of radiology and pathology. However, future studies of infection with texture analysis could better correlate lesions with texture features to reveal potential relationships between pathogenesis and quantitative image analysis. The training of the classifier requires human observer identification of the abnormal lesions. We plan to compare the result of texture analysis and human scoring to reveal the systematic correlation between the two systems.
There are a few other areas warrant further investigation, such as the use of texture analysis for assessing co-infection involving multiple pathogens, and the pattern of nontuberculous mycobacterial infection known to have a range of appearances including nodularity and ground glass opacity, with possible cavitations and fibrotic features [20].
CONCLUSIONS
This study’s results demonstrate the ability of texture analysis to distinguish abnormal lung parenchyma in CTs of H1N1-infected patients from normal-appearing regions of the same lungs and from normal regions of healthy lungs, in a small group of patients... The study also demonstrates quantitative differentiation of H1N1 from cases of fibrosis, MAC, and parainfluenza. While it was more difficult to distinguish between bacterial pneumonia and H1N1, this may be due to frequent co-infection of the diseases in the training set. Future investigation will be needed to assess the potential of this technique as a clinical tool in diagnosing disease, quantifying severity, monitoring response to therapy, and predicting outcomes. This technique also has potential application as a research tool in animal imaging studies to analyze viral pathogenesis with pathology specimens anatomically and spatially matched to the CT findings.
Acknowledgments
Funding: this research was supported by the Intramural Research Program of the National Institutes of Health, Clinical Center.
We thank Dr. James Gill of the New York City Office of Medical Examiner for providing the H1N1 data. We also thank John Bliton for assisting the proofreading and formatting of the manuscript. This research was supported by the Intramural Research Program of the National Institutes of Health, Clinical Center.
Footnotes
Publisher's Disclaimer: This is a PDF file of an unedited manuscript that has been accepted for publication. As a service to our customers we are providing this early version of the manuscript. The manuscript will undergo copyediting, typesetting, and review of the resulting proof before it is published in its final citable form. Please note that during the production process errors may be discovered which could affect the content, and all legal disclaimers that apply to the journal pertain.
References
- 1.Kim EA, et al. Viral pneumonias in adults: radiologic and pathologic findings. Radiographics. 2002;22(Spec):S137–49. doi: 10.1148/radiographics.22.suppl_1.g02oc15s137. [DOI] [PubMed] [Google Scholar]
- 2.Mollura D, Asnis D, Conetta R. Imaging Findings in a Fatal Case of Pandemic Swine-Origin Influenza A (H1N1) Am J Roentgenol. 2009;193(6) doi: 10.2214/AJR.09.3365. [DOI] [PMC free article] [PubMed] [Google Scholar]
- 3.Agarwal P, Cinti S, Kazerooni E. Chest radiographic and CT findings in novel swine-origin influenza A (H1N1) virus (S-OIV) infection. American Journal of Roentgenology. 2009;193 doi: 10.2214/AJR.09.3599. [DOI] [PubMed] [Google Scholar]
- 4.Ajlan AM, et al. Swine-Origin Influenza A (H1N1) Viral Infection: Radiographic and CT Findings. American Journal of Roentgenology. 2009;193:p1494–1499. doi: 10.2214/AJR.09.3625. [DOI] [PubMed] [Google Scholar]
- 5.Chabat F, Yang GZ, Hansell D. Obstructive Lung Diseases: Texture Classification for Differentiation at CT. Radiology. 2003;228:871–877. doi: 10.1148/radiol.2283020505. [DOI] [PubMed] [Google Scholar]
- 6.Barequet G, Shapiro D, Tal A. Multilevel sensitive reconstruction of polyhedral surfaces from parallel slices. The Visual Computer. 2000;16:116–133. [Google Scholar]
- 7.Yao J, et al. Computer-aided grading of lymphangioleiomyomatosis (LAM) using HRCT. International Conference of Pattern Recognition; Tampa, FL. 2008. [DOI] [PMC free article] [PubMed] [Google Scholar]
- 8.Sluimer I, et al. Computer Analysis of Computed Tomography Scans of the Lung: A Survey. IEEE Trans Med Imag. 2006;25(4):385–405. doi: 10.1109/TMI.2005.862753. [DOI] [PubMed] [Google Scholar]
- 9.van Rikxoort E, et al. Automatic Segmentation of Pulmonary Segments From Volumetric Chest CT Scans. IEEE Trans Med Imag. 2009;28(4):621–630. doi: 10.1109/TMI.2008.2008968. [DOI] [PubMed] [Google Scholar]
- 10.Uppaluri R, et al. Computer Recognition of Regional Lung Disease Patterns. AM J Respir CRIT CARE MED. 1999;160:648–654. doi: 10.1164/ajrccm.160.2.9804094. [DOI] [PubMed] [Google Scholar]
- 11.Zavaletta VA, Bartholmai BJ, Robb RA. IEEE ISBI. Arlington, VA, USA: 2007. 3D Morphological Analysis of Lung Pathology. [Google Scholar]
- 12.Caban J, et al. SPIE Medical Imaging (CAD) San Diego, CA: 2007. Texture-Based Computer-Aided Diagnosis System for Lung Fibrosis. [Google Scholar]
- 13.Cristianini N, Taylor JS. An Introduction to Support Vector Machines. Cambridge University Press; 2000. [Google Scholar]
- 14.Yao J, Summers RM, Hara AK. SPIE Medical Imaging. San Diego, CA: 2005. Optimizing the Support Vector Machines (SVM) Committee Configuration in Colonic Polyp CAD System. [Google Scholar]
- 15.Metz C, Herman B, Roe C. Statistical comparison of two ROC curve estimates obtained from partially-paired datasets. Med Decis Making. 1998;18:110–121. doi: 10.1177/0272989X9801800118. [DOI] [PubMed] [Google Scholar]
- 16.Morens DM, Taubenberger JK, Fauci AS. Predominant role of bacterial pneumonia as a cause of death in pandemic influenza: implications for pandemic influenza preparedness. Journal of Infectious Diseases. 2008;198:962–970. doi: 10.1086/591708. [DOI] [PMC free article] [PubMed] [Google Scholar]
- 17.Mueller-Mang C, et al. What every radiologist should know about idiopathic interstitial pneumonias. Radiographics. 2007;27(3):595–615. doi: 10.1148/rg.273065130. [DOI] [PubMed] [Google Scholar]
- 18.Sumikawa H, et al. Usual interstitial pneumonia and chronic idiopathic interstitial pneumonia: analysis of CT appearance in 92 patients. Radiology. 2006;241(1):258–66. doi: 10.1148/radiol.2411050928. [DOI] [PubMed] [Google Scholar]
- 19.van den Brand J, et al. Severity of pneumonia due to new H1N1 influenza virus in ferrets is intermediate between that due to seasonal H1N1 virus and highly pathogenic avian influenza H5N1 virus. J Infect Dis. 2010;201(7):993–9. doi: 10.1086/651132. [DOI] [PMC free article] [PubMed] [Google Scholar]
- 20.Martinez S, McAdams HP, Batchu CS. The many faces of pulmonary nontuberculous mycobacterial infection. AJR Am J Roentgenol. 2007;189(1):177–86. doi: 10.2214/AJR.07.2074. [DOI] [PubMed] [Google Scholar]