Abstract
Head-related transfer functions (HRTFs) play an important role in spatial sound localization. The boundary element method (BEM) can be applied to calculate HRTFs from non-contact visual scans. Because of high computational complexity, HRTF simulations with BEM for the whole head and pinnae have only been performed for frequencies below 10 kHz. In this study, the fast multipole method (FMM) is coupled with BEM to simulate HRTFs for a wide frequency range. The basic approach of the FMM and its implementation are described. A mesh with over 70 000 elements was used to calculate HRTFs for one subject. With this mesh, the method allowed to calculate HRTFs for frequencies up to 35 kHz. Comparison to acoustically-measured HRTFs has been performed for frequencies up to 16 kHz, showing a good congruence below 7 kHz. Simulations with an additional shoulder mesh improved the congruence in the vertical direction. Reduction in the mesh size by 5% resulted in a substantially-worse representation of spectral cues. The effects of temperature and mesh perturbation were negligible. The FMM appears to be a promising approach for HRTF simulations. Further limitations and potential advantages of the FMM-coupled BEM are discussed.
I. INTRODUCTION
The shape of head, torso, and pinna plays an important role in localization of sounds in humans. Reflections, especially at the pinna, act as a filter, which can be described by the head-related transfer functions (HRTFs) (Blauert, 1974; Shaw, 1974; Møller et al., 1995). These functions are dependent on sound source position (Makous and Middlebrooks, 1990) and they differ among listeners (Wightman and Kistler, 1989; Algazi et al., 2001b). HRTFs can be applied to create virtual free-field sounds (Bronkhorst, 1995; Begault et al., 2001). The required spatial resolution of HRTFs is given by the listeners’ spatial localization accuracy, which is in the range of few degrees (Minnaar et al., 2005). Thus, HRTFs must be measured for many directions, especially when virtual sounds in vertical planes are required. An acoustic measurement of one HRTF set including all positions in three-dimensional (3D)-space takes tens of minutes, even when sophisticated measurement methods are applied (Zotkin et al., 2006; Majdak et al., 2007). This may be uncomfortable for the subject, who has to keep still during the entire measurement procedure.
However, the data about subjects’ morphology can also be collected using non-contact visual scans (Katz, 2001a; Kahana and Nelson, 2007). This procedure is very fast and compared to the acoustic measurements, it is much more comfortable for the subjects. From the visual data, it is possible to create surface meshes of the subject’s head and then, in principle, numerically calculate HRTFs. Hence, a numerical method for accurate calculation of HRTFs from visual data is of great interest.
In the past years, the boundary element method (BEM) became more and more popular in the field of acoustic simulation. Katz (2001a) described results of HRTF simulations using BEM. From visually scanned data, he simulated HRTFs for frequencies up to 6 kHz and compared them to acoustically-measured data. However, for the median-plane localization, frequencies in the range of 3.5–16 kHz are essential (Middlebrooks and Green, 1991). Recently, Kahana and Nelson (2007) calculated HRTFs for frequencies up to 20 kHz; however, their method allowed only to use a baffled pinna without the head and torso.
One reason for frequency limitations in Katz, 2001a and Kahana and Nelson, 2007 was the size of the mesh they used. When applying BEM to solve acoustic problems, at least six elements per wavelength are required to ensure numerical accuracy (Marburg, 2002). Thus, a mesh resolution of few millimeters is required when applying BEM for higher frequencies. Katz (2001a) used a head mesh with 22 000 elements, which was valid for frequencies up to 5.4 kHz. Kahana and Nelson (2007) used baffled pinna meshes with 23 000 elements, which were valid for frequencies up to 20 kHz. To overcome the frequency limitation for combined pinna, head, and torso meshes, we used meshes with over 70 000 elements. However, simulation of such large meshes leads to a huge linear system of equations. The memory requirement for solving such a matrix equation is  (n2), where n is the number of elements. Assuming 128-bit complex-valued entries, the memory requirement for just storing the matrix exceeds 70 Gbytes. Thus, with the memory and computation limitations of modern computer systems, an approach to reduce the required memory is essential to be able to calculate HRTFs for high frequencies.
In this study, the reduction in the required memory is achieved by coupling the BEM with the fast multipole method (FMM) (Greengard and Rokhlin, 1987). FMM was originally developed for the numerical computation of N-body problems and was later adapted to acoustic problems (Greengard et al., 1998). It reduces the computational complexity to  (n log2
n) (Fischer et al., 2004). Thus, it appears reasonable to use the FMM-coupled BEM approach to simulate HRTFs within a wide frequency range.
In principle, the theory follows, Fischer and Gaul (2005), and Chen et al. (2008). Various additions and modifications were applied to adapt those algorithms to an efficient HRTF simulation. In Sec. II, we describe the resulting algorithm, including a brief overview of the BEM and the FMM.1 Then, several computational issues are discussed and the validation of the code is presented. Finally, the results of HRTF simulation for one subject are presented and compared to the data from acoustic measurements. In addition, the effects of temperature, mesh quality, and mesh perturbation are presented. Finally, advantages and limitations of our approach are discussed.
II. THEORY
A. BEM
The general equation for exterior acoustic problems in a domain Ω is the Helmholtz equation:
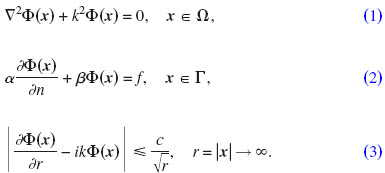
Equations (2) and (3) define mixed boundary conditions in Γ=∂Ω and the Sommerfeld radiation condition, respectively. Φ(x)=p/(iωρ) denotes the velocity potential at the point x and k=ω/c is the wavenumber with the frequency ω and the speed of sound c. p denotes the sound pressure, ρ the density of the fluid, and i2=−1. Γ is the boundary of the domain (in our case the surface of the head). α, β, and f are parameters and functions which determine appropriate boundary conditions.
To ensure uniqueness of the solution also at irregular frequencies the Burton–Miller approach is used (Burton and Miller, 1971).2 From Eq. (1), the boundary integral equation is derived (Chen et al., 2008):

with


Φi and vi are the potential field and the particle velocity of an incident sound wave, respectively. v0 is the velocity at the surface node x in the normal direction nx. By including A(x):=iωρa(x):=v(x)/Φ(x), sound absorbing materials defined by admittance a(x) can be modeled. G(x,y) is the Green’s function of the Helmholtz equation and H(x,y) is its derivative with respect to the normal vector ny to the surface Γ at a point y:
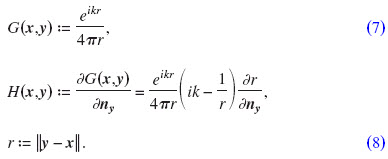
The solutions for most of the integrals in Eqs. (5) and (6) are well-defined. However, the integrand of

becomes hypersingular when x lies on Γ. In our study, collocation and constant boundary elements are used. In that case, Eq. (9) can be converted to a sum of a line integral and a weakly singular integral. A numerical solution is given using appropriate quadrature schemes (for more details see Erichsen and Sauter, 1998; Chen et al., 2008).
The numerical treatment of Eq. (4) yields an n×n system matrix. For large meshes, i.e., large n, the memory requirements are very high. Thus, simulation of meshes with tens of thousand of elements is not feasible without further modification of the collocation BEM.
B. Fast multipole BEM
In this paper, a short introduction of the FMM is given. For more details see, for example, Greengard and Rokhlin, 1987; Fischer and Gaul, 2005; Chen et al., 2008; Gumerov and Duraiswami, 2009. The idea behind the FMM is the far-field expansion of kernels in Eqs. (7) and (8) (Greengard and Rokhlin, 1987):

To separate the field in far field and near field, the mesh is divided into clusters. A cluster C2 is in the far field  of cluster C1 if the two clusters are well separated. Two clusters C1 and C2 are well separated, if ||z1−z2||>τ(r1+r2), where r1 and r2 are the radii of the clusters and z1 and z2 are their midpoints (see Fig. 1). In our study, τ was
  . In the far field, the contribution of all combinations of x ε C2 and y ε C1 to the integrals in Eqs. (5) and (6) is reduced to that of the cluster centers z2 and z1. If a cluster C2 is not in
  then it is in the near field
  .
.
FIG. 1.
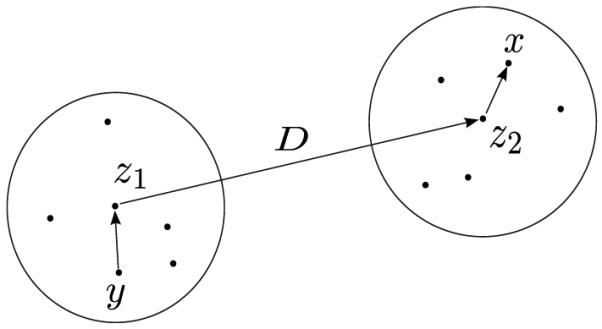
Clusters around x and y.
The kernel expansion of the Green’s function [Eq. (7)] used in this study is given in Fischer and Gaul, 2005:
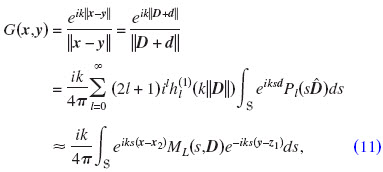
with

where d:=x−z2−(y−z1), D:=z2−z1, and  . It is assumed that |D|>|d|, i.e., x and y are well separated.
  denote the spherical Hankel functions of the first kind of order l, and Pl(·) are l-th order Legendre polynomials.
  is the unit-sphere surface given by {(cos
  sin θ, sin
  sin θ, cos θ):0≤
 ≤2π,0≤θ ≤π}. The truncation parameter L was max{2krmax+1.8 log(2krmax+π),8}, where rmax is the radius of the largest cluster (Chen et al., 2008). For all other kernels in Eq. (7), similar expansions can be found.
For the far field, the numeric treatment of Eq. (4) requires calculation of potentials of the form Φ(x)= , where x ε C2, yj ε C1, qj is the source strength at yj, and J is the number of nodes in the cluster C1. The multipole approach to calculate Φ(x) consists of three steps. First, the far-field signature F(s) is calculated:

This step represents the local expansion of the cluster C1 around z1. Second, the near-field signature N(s) is calculated by applying the far-field signature F(s) to the translation operator ML for all combinations of clusters C1 and C2:
![]()
This step represents the translation of the far-field signature around z1 to the near-field signature around z2. It is numerically efficient because ML(s ,D) only operates on the cluster centers. Finally, the potential Φ(x) is calculated:
![]()
This integral is calculated using Gauss–Legendre quadrature with L points in the θ-direction and a 2L-point trapezoidal rule for the  -direction (Rahola, 1996), where L is the length of the multipole expansion from Eq. (12). This step represents the local expansion of the near-field signature around z2.
For the near field, the multipole expansion can not be applied. Thus, for all nodes y in the near field of x, collocation BEM is applied to set up the near-field matrix. Thus, the size of the near-field matrix depends on the number of nodes in the near field.
By applying the above steps to all clusters, the final system of equations is formally written as
![]()
where u is the vector of the unknown potentials and f is the excitation force. T represents the far-field signatures for each cluster [Eq. (13)]. M represents translation operators ML for each cluster pair [Eq. (14)]. S represents the local expansions of the near-field signatures. N is a block-diagonal matrix, which represents the near-field matrices from the collocation BEM for each cluster.
Because of the sparse form of Eq. (16), a substantial reduction in memory requirement is achieved. This makes the fast multipole BEM applicable for large meshes. In fact, the largest matrix, which has to be fully stored is the nearfield matrix. Its size depends on the cluster size. Giebermann (1997) showed that the cluster size of  results in a maximum efficiency if only one level of clustering is used.
Further reduction in computational cost can be achieved with the multilevel FMM (see, for example, Fischer and Gaul, 2005). In the multilevel FMM, a binary tree of clusters is implemented. At its coarsest level (ℓ=0), only one cluster is given by a parallelepiped which contains the whole mesh. Clusters at level ℓ are given by bisection of clusters from level ℓ−1. The finest level ℓmax is reached when all clusters contain less than 20 elements. In our study, a modified multilevel FMM was used. At level ℓ=1, instead of bisection, the cluster from level ℓ=0 was divided into about  clusters. Clusters at finer levels were then constructed by bisection. This modification resulted in a smaller number of levels. In matrix form, this procedure yields

where Nℓmax is the near-field matrix at the finest level and Sℓ and Tℓ are the matrices S and T, respectively, for the particular level ℓ.
The FMM shows stability problems for low frequencies (Darve, 2000). Thus, for frequencies below 1 kHz, only one level with  clusters was used (ℓmax=1). This increased the stability for frequencies as low as 50 Hz. For frequencies above 1 kHz, the modified multilevel FMM was used. For our mesh sizes, the clustering procedure resulted in up to three levels (ℓmax≤3).
Fischer and Gaul (2005) calculated the Sℓ and Tℓ only for the finest level. For coarser levels, they applied filtering and interpolation algorithms to obtain Sℓ and Tℓ. This further reduced the memory requirement in return for higher computational cost. In our modified multilevel FMM, Sℓ and Tℓ were explicitly calculated and stored in memory for all levels. This was possible because for our mesh sizes, the number of levels was small enough to allow storage of all Sℓ and Tℓ for all levels in memory. Thus, compared to Fischer and Gaul (2005), a reduction in computational cost was achieved in return for a slightly higher memory requirement.
III. METHODS
A. Measurement of HRTFs
The HRTFs were measured for one subject in a semi-anechoic room. The subject had very short hair and was not wearing a cap. The A-weighted sound pressure level of the background noise in this room was 18 dB re 20 μPa on a typical testing day. The temperature was between 20 and 25 °C. Twenty-two loudspeakers (custom-made boxes with VIFA 10 BGS as drivers; the variation in the frequency response was ±4 dB in the range from 200 to 16 000 Hz) were mounted at fixed elevations from −30° to 80° with a spacing of 5°. The subject was seated in the center of the arc and had microphones (KE-4-211-2, Sennheiser) placed in his ear canals. The microphones were connected via pre-amplifiers (FP-MP1, RDL) to the digital audio interface. An exponential sweep with a duration of 1728.8 ms and a frequency from 50 Hz to 18 kHz was used to measure each HRTF. The sweep had a fade in/out of 20 ms. The multiple exponential sweep method was applied to measure HRTFs in an interleaved and overlapped order for one azimuth and all elevations at once (Majdak et al., 2007). Then, the subject was rotated by 2.5° to measure HRTFs for the next azimuth. In total, 1550 HRTFs were measured with the positions distributed with a constant spherical angle on the sphere. The measurement procedure lasted for approximately 20 min.
Then, reference measurement was performed, in which in-ear microphones were placed in the center of the arc and the system identification procedure was performed for all loudspeakers. From the reference measurement, equipment transfer functions were derived. They were used to remove the effect of the equipment, which was done by dividing complex spectra of HRTFs by the complex spectra of the equipment transfer functions. In the next step, the directional transfer functions (DTFs) were calculated (Middlebrooks, 1999). The magnitude of the common transfer function (CTF) was calculated by averaging the log-amplitude spectra of all equalized HRTFs. The phase of the CTF was the minimum phase corresponding to the amplitude spectrum of the CTF. The DTFs were the result of filtering the HRTFs with the inverse complex CTF. Finally, all DTFs were temporally-windowed with a 5.33-ms long Tukey window. The DTFs had a valid frequency range from 300 Hz to 16 kHz.
B. Mesh generation
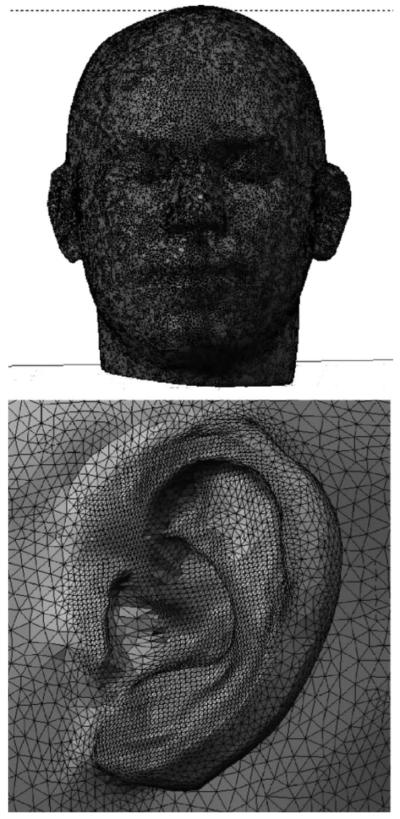
Visual scans of the subject’s head were performed using a non-contact 3D scanner (Minolta VIVID-900). Hair was a major problem for the scanner, and, thus, a rubber cap was used to cover the hair (Katz, 2001a; Kahana and Nelson, 2007). The subject did not wear the in-ear-microphones from the acoustic measurements. The mesh was generated by combining six scans from different directions around the head using the “surface wrap” tool implemented in Geomagic Studio (Geomagic, Inc.). For the head, the resolution of the scanned data was higher then necessary; therefore, the node reduction mode has been used during the surface wrap. For the pinna, the surface wrap was applied on the full-resolution scanned data without node reduction. Then, the pinna and the head meshes were stitched together. The final mesh was manually edited to obtain almost regular triangles. This was done to enhance numerical performance and stability. Parts of the antihelix and concha have been coarsened using the “remove doubles” procedure from Blender (Roosendaal and Selleri, 2004). This could be safely done because these parts showed almost no curvatures and could be represented by less nodes without any structural changes. We assume that our post-processing procedure had not substantially affected the volume of the mesh.
The final mesh contained 70 785 elements with an average edge length of 2.1 mm, with a minimum of 0.14 mm and a maximum of 5.8 mm. Most of the small elements were located at the pinna. This mesh, shown in Fig. 2, represents the mesh for the baseline condition. Based on the 6-to-8-elements-per-wavelength rule, this mesh can be used for BEM calculations for frequencies up to 35 kHz.
FIG. 2.
Mesh used in the baseline condition.
Our method allows to use impedance boundary conditions to simulate sound absorbing materials (for example hair, see Katz, 2001b). Preliminary experiments with different admittance boundary conditions for the hair area showed no substantial differences in the results. Hence, in this study, we present results for an acoustically-hard reflecting head only.
1550 nodes around the head at a distance of 1.2 m were chosen as point sources to represent the positions of the loudspeakers from the HRTF measurement. A receiver element was positioned at the entrance of the closed ear canal to represent the position of the microphone from the HRTF measurement. The receiver element was implemented by setting the velocity boundary condition at that specific element to a value different from 0. The position of the receiver element was chosen based on the photographs of subject’s pinna (see also Fig. 6).
FIG. 6.
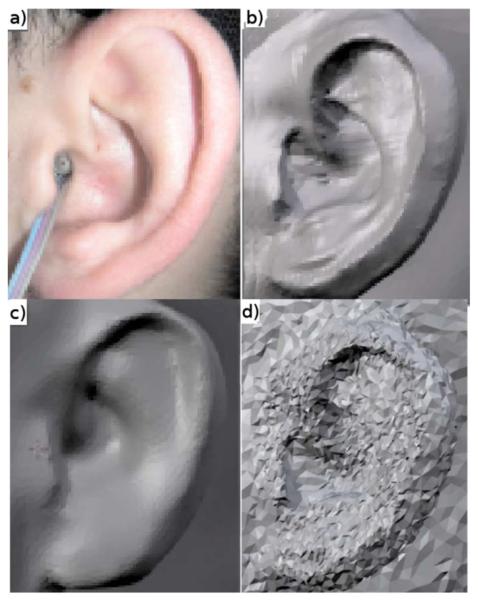
(Color online) Panel a: Left pinna. Panel b: The mesh for the baseline condition. Panel c: Low-quality mesh. Panel d: Example of a mesh perturbed with random vectors of 0.5 mm length.
C. Reciprocity
The principle of reciprocity was implemented to further speed up calculations. The role of the receiver element was interchanged with role of the point sources. Let x1 be the midpoint of the receiver element, and x2 be the position of a point source outside the head. Using an analogon of Betti’s reciprocal theorem for acoustics, the sound pressure px1(x2) caused by an excitation at x1 is related to the sound pressure px2(x1) caused by an excitation at x2:

where A0 is the area of the vibrating element, vn0 is the normal velocity at the midpoint of x1, ρ is the density of the medium, and q is the intensity of the sound source positioned at x2.
Hence, the receiver element at the entrance of the ear channel was defined to be an active vibrating element. The sound pressure was calculated at the nodes representing the position of the sound sources. This is a very efficient approach, because the solution of Eq. (4) for one active element results in the sound pressure information for all nodes. Thus, contrary to the direct method, with the reciprocity method, HRTFs for all sound source positions were calculated in one simulation at once.
D. Computational issues
Several pre-simulations were performed to evaluate our code. First, the numerical stability of the reciprocity method was tested. In a direct simulation, a point source was positioned in front of the head at a distance of 1.2 m. Sound pressure at each element of the baseline mesh was calculated for different frequencies. Figure 3 shows the amplitude spectra of calculated HRTFs as a comparison between the direct (lines) and reciprocity (symbols) methods for four positions (front, right, back, and left). All calculations were done for the right ear. In general, the results do not substantially differ for both methods. However, for the contralateral position (left), the limitations of the reciprocity method are evident. This is because of round-off errors for positions and frequencies, which contain low energy. Nevertheless, such accuracy is sufficient for further simulations.
FIG. 3.
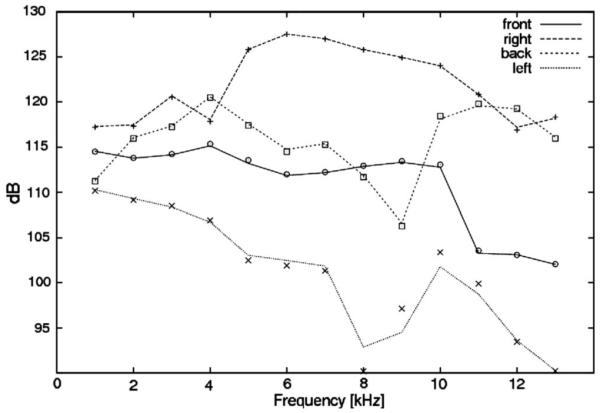
Comparison of four different HRTFs using the direct approach (lines) and the results with the reciprocity method (symbols). All values show the sound pressure at the entrance of the right ear channel; sound sources are positioned in front, right, back and left of the head.
The evaluation of the FMM-coupling to the BEM was done by directly comparing the HRTFs calculated using collocation BEM (without FMM) and FMM-coupled BEM. Because of memory limitations, the calculations using collocation BEM could not be performed for the baseline mesh. To be able to still provide a fair comparison, a simplified mesh was used where the original pinnae were placed on a sphere representing an artificial head. This mesh consisted of a smaller number of nodes and still provided a high geometric complexity. The calculation results, i.e., HRTFs for the directions front, right, back, and left, are shown in Fig. 4. The lines represent the results for the collocation BEM and the symbols represent the results for the FMM-coupled BEM. The results show no differences between the BEM with and without FMM.
FIG. 4.
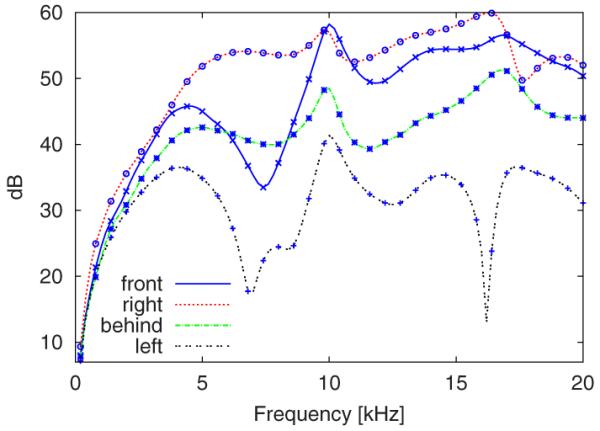
(Color online) Comparison of four different HRTFs using the collocation BEM (without FMM, solid lines) and FMM-coupled BEM (symbols). A simplified head mesh was used (see text).
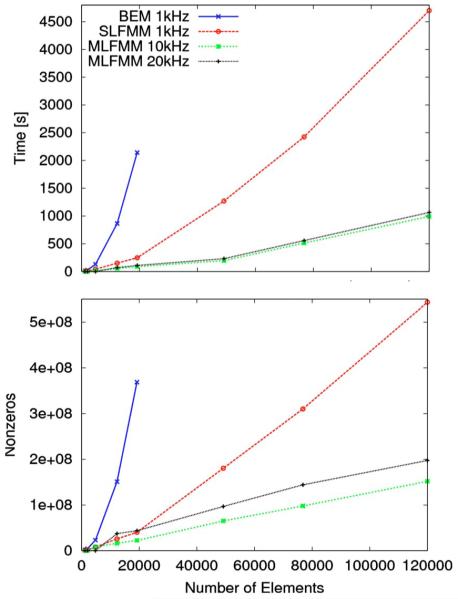
The computational complexity was evaluated by calculating sound pressure for a simple 3D cube. Figure 5 shows the time and memory requirements for the calculation of sound pressures for cubes with different number of elements. The memory requirement is represented by the number of nonzeros in the system matrix. For the frequency of 1 kHz, the FMM with one level (ℓmax=1) was used. For frequencies of 10 and 20 kHz, FMM with three levels (ℓmax=3) was used. For BEM without FMM and meshes with more then 19 200 elements, results could not be calculated because of too high memory requirements. This comparison clearly shows the limitation of collocation BEM without FMM and advantages of coupling FMM to BEM in simulations.
FIG. 5.
(Color online) Computation time and memory requirement for different methods of calculation as functions of the mesh size. Compared are the collocation BEM without FMM, BEM with the single-level FMM (ℓmax=1), and BEM with the three-level FMM (ℓmax=3) for frequencies of 10 and 20 kHz. The calculations were performed for simple 3D cube meshes.
In the main simulations, the HRTFs were calculated in the frequency range of 0.2 and 20 kHz in steps of 0.2 kHz. The overall computation time for 200 different frequencies was about 5 h on a Linux cluster containing five machines with dual Opteron processors (AMD) running with 2.0 GHz. Finally, based on the simulated HRTFs, DTFs were calculated in the same way as for the measured data. Even though the DTFs were calculated for frequencies up to 20 kHz, the comparisons to the measured DTFs (presented in Sec. IV) have been done only for frequencies up to 16 kHz because of the limited frequency range of the measured DTFs.
E. Parameters
The effects of the mesh quality, mesh perturbation, temperature, and shoulders were investigated by altering the mesh and simulation parameters with respect to the baseline condition. In the baseline condition, the mesh shown in Fig. 2 was used and the speed of sound and the density of air were set to simulate the temperature of 15 °C (see Table I). Figure 6 shows the subject’s pinna (panel a) and its corresponding mesh (panel b) used in the baseline condition.
TABLE I.
Speed of sound c and air density ρ for the tested temperatures
| Temp (°C) |
c (m/s) |
ρ (kg/m3) |
|---|---|---|
| 0 | 331.3 | 1.292 |
| 15 | 340.5 | 1.225 |
| 30 | 349.0 | 1.165 |
The mesh quality was tested by reducing the number of elements in the mesh by approximately 5%. The reduction in elements was performed in two steps. First, a smoothing algorithm was applied to the mesh in terms of moving each vertex in the mesh toward the barycenter of the linked vertices. Then, all nodes within a 0.43-mm distance to their neighbors were removed. The resulting low-quality mesh contained 67 428 elements with an average edge length of 2.19 mm. The modifications of the mesh were done using the software package BLENDER (Roosendaal and Selleri, 2004). Figure 6(c) shows the pinna from the low-quality mesh. As it can be seen the reduction of the nodes at the pinna had a major effect on the shape.
The stability of the mesh with respect to measurement errors was tested by applying a perturbation to the mesh. This was achieved by moving all nodes in the mesh in random directions. This procedure corresponds to degradation of the precision of the visual scans and tests the robustness and stability of the simulation to such changes. The perturbation level was represented by the length of the vectors with random direction added to each node. Two perturbation levels were used: 0.25 and 0.5 mm. Figure 6(d) shows an example of a pinna mesh, which was perturbed at the level of 0.5 mm.
The effect of the simulation temperature was investigated by varying the sound speed and the air density. In addition to the baseline condition, two temperatures were simulated: 0 and 30 °C. The corresponding values for the sound speed and air density are given in Table I.
The effect of shoulders was investigated by including a shoulder mesh to the simulations, which was based on data from two-dimensional photographs of the subject from two different angles and did not require additional visual 3D scans. The shoulder mesh was combined with the head mesh from the baseline condition. The resulting mesh consisted of 3711 additional elements.
IV. RESULTS AND DISCUSSION
For the horizontal plane, the simulation and measurement results are shown in Fig. 7. The panels show the DTF amplitude spectra as functions of the azimuth of the sound source. The azimuths of 0°, 90°, 180°, and 270° represent the sound sources in the front, to the right, in the back, and to the left of the subject, respectively. The color represents the DTF amplitude in decibels. The top-left panel shows the measured data and the top-right panel shows the simulation results for the baseline condition. For the baseline condition, the general pattern is in agreement with that for the measured data. The broadband amplitude decreases when the sound source moves to the contralateral ear. This is because of the shadow caused by the head, which is consistent with the measurement results. The amplitude fluctuates along the azimuth more for the high frequencies than for the low frequencies. This is because for the high frequencies, the fine structure of the pinna leads to azimuth-dependent resonances and cancellations. For low frequencies, the pinna has little effect only. This is also in agreement with the measurement results. However, the spatial-spectral features are not exactly represented by the simulation. For example, for azimuth of 150°, the measured data show a notch between 9 and 10 kHz. This notch is not represented in the simulation results. Such discrepancies are not essential for the localization in the horizontal plane, where spectral cues play a minor role (Macpherson and Middlebrooks, 2002)
FIG. 7.
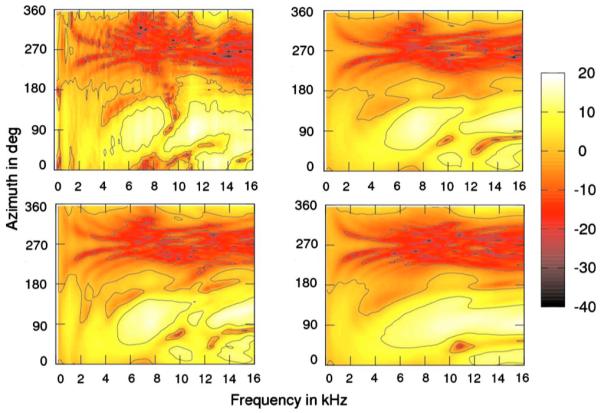
(Color online) Comparison of the simulated and measured DTFs in the horizontal plane (elevation angle of 0°). Top-left: Measured data. Top-right: Simulation for the baseline condition. Bottom-left: Simulation for the baseline condition with shoulders. Bottom-right: Simulation for the low-quality mesh. The color represents the magnitude in dB.
The effect of mesh quality on the simulation results for the horizontal plane is shown in the bottom-right panel of Fig. 7. The spatial-spectral features appear smeared and are not as prominent as in the baseline condition. The quality degradation had a substantial effect on particular features; however, the general pattern remained similar to that from the baseline condition and measured data.
The bottom-left panel of Fig. 7 shows the results of simulation with shoulder mesh. No substantial effects of the shoulder can be found for the horizontal plane.
For the median plane, the results are shown in Fig. 8. The panels show the DTF amplitude spectra as functions of the elevation angle. The elevation angles of 0°, 90°, and 180° represent the sound sources at eye-level in the front, at the top, and at eye-level in the back of a listener, respectively. Note that for the elevation angles between 80° and 100°, the data were linearly interpolated from 80° to 100° because they were not measured in that region. The top-left panel shows the measured data and the top-right panel shows the simulation results for the baseline condition.
FIG. 8.
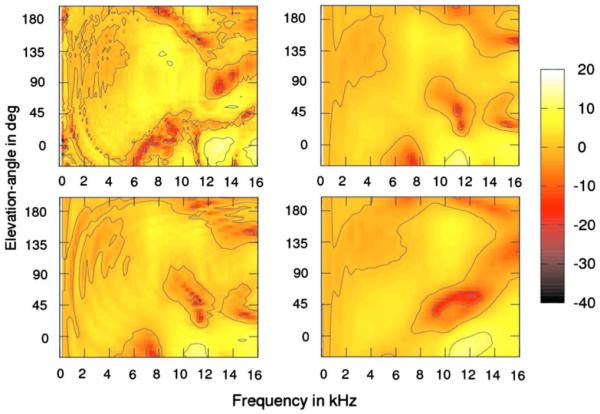
(Color online) Comparison of the simulated and measured DTFs in the median plane (azimuth of 0°). All other conventions are as in Fig. 7.
For frequencies below 7 kHz, the DTFs show a striking congruence between simulation and measurement. However, the measured data show more modulations, which are most likely a result of comb filter effects caused by the shoulder reflections (Algazi et al., 2001a). The bottom-left panel of Fig. 8 shows the results for simulation with the shoulder mesh. By including shoulders to the model, the modulations of the spatial-spectral patterns became clearly present. This may reduce the degradation of the vertical-plane localization ability, especially for sound source located away from the median-plane (Algazi et al., 2001a). Thus, for the frequencies below 7 kHz, the mesh with shoulders provides the best congruence to the measured data.
For frequencies above 7 kHz, the differences between measurement and simulation are evident. The measurement results show a deep notch at 7 kHz for the eye-level positions. Such a notch is considered to be one of the main cues for encoding elevation (Carlile and Pralong, 1994; Middlebrooks, 1997; Iida et al., 2007). The center frequency of this notch increases to 9 kHz with increasing elevation for angles up to 40°. This pattern is symmetric across the hemifields. In the simulation results, the elevation-dependent center frequency of the notch is not present. The only correspondence to the measured data can be observed for the frontal positions below eye-level, where the simulation results also show a notch at 7 kHz. However, this notch disappears for higher elevations.
In the front, the measurements show a large peak around 12 kHz for the eye-level positions. In the back, the height of this peak decreases. This is consistent with the effect of pinna, which forms an acoustic shadow for the high-frequency sound sources located in the back. The amplitude difference in this frequency band, relative to the notches at lower frequencies, is a potential candidate for the front-back cue in median-plane sound localization (Iida et al., 2007). The higher peak for the frontal eye-level position can also be observed in the simulation results. However, other local spatial-spectral features found in the measurements are missing in the simulation results.
The simulation results for the low-quality mesh are presented in the bottom-right panel of Fig. 8. The results show similar effects to that found for the horizontal plane. The spatial-spectral features appear smeared and show less details compared to the baseline condition. This supports the previous findings that a high-quality mesh seems to be crucial for the simulation.
The effects of temperature and perturbation are shown in Fig. 9. Temperature changes, which imply changes in the propagation time of the sound waves, led to frequency shifts of the amplitude spectra. Interestingly, the shifts are small compared to the substantially different shapes of the measured DTFs. Thus, the choice of the correct temperature for the simulations seems to be negligible as long as it is in a range of a typical room temperature. The perturbation had also a small effect on the simulation results. The most changes can be observer for frequencies above 10 kHz, which appear as frequency shifts in the order of few hundred hertz. The small effect of perturbation is surprising, given that the reduction in the mesh quality had a substantial effect on the simulation results. The perturbation can be seen as adding noise to the mesh. Nevertheless, it preserved most of the details in the mesh. In contrast, the low-quality mesh was a result of smoothing and node reduction, which obviously removed important details about the fine structure from the mesh. This fine structure seems to be important. Thus, a mesh precision of 0.5 mm seems to be sufficient, as long as all details in the range of 0.5 mm are well represented by the mesh.
FIG. 9.
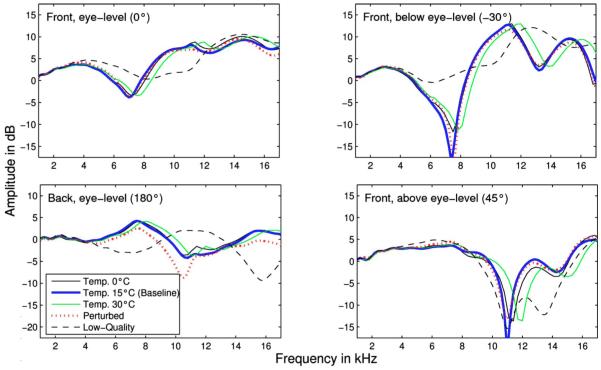
(Color online) Amplitude spectra of simulated DTFs for sound sources in the median plane. The elevations are −30° (front, below eye-level), 0° (front, eye-level), 45° (front, above eye-level), and 180° (back, eye-level). The solid lines show the effect of the temperature. The dotted lines show the effect of perturbation at a level of 0.5 mm. The dashed lines show the effect of using low-quality mesh.
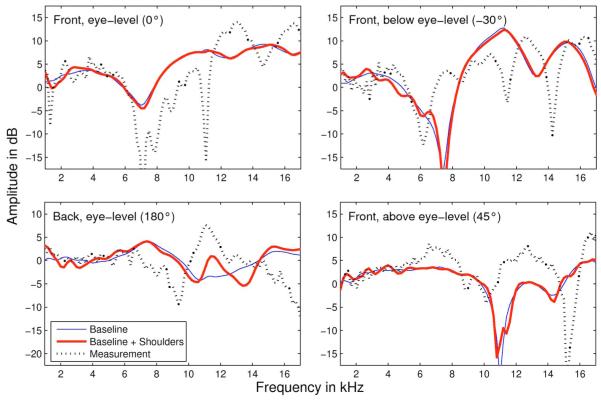
A more detailed analysis of the differences between the simulation and measurements is provided in Fig. 10. It shows the amplitude spectra of simulated and measured DTFs for four sound source positions located in the median plane. The positions are −30°, 0°, 45°, and 180°. For frequencies below 7 kHz, all four positions show a good congruence of simulations with the measurements. The baseline condition with shoulders resulted in more spectral modulations compared to the baseline condition without shoulders. This confirms the importance of shoulders for low frequencies. For high frequencies, the differences between the conditions with and without shoulders are negligible.
FIG. 10.
(Color online) Amplitude spectra of simulated and measured DTFs for sound sources in the median plane. The elevations are −30° (front, below eye-level), 0° (front, eye-level), 45° (front, above eye-level), and 180° (back, eye-level). The solid lines show the simulation results for the baseline condition with and without shoulders. The dotted lines show the measured data.
Katz (2001b) reported simulation results for frequencies up to 6 kHz and for positions comparable to that in Fig. 10.3 His largest difference between measurements and simulation was 17 dB (for frequency of 6 kHz at elevation of 45°). Our largest difference between measurements and the simulation is 5 dB (for 6 kHz at 0°). Allowing a maximal difference of 5 dB, his simulation results show congruence for frequencies up to 4.5 kHz, while our simulation results show congruence for frequencies up to 7 kHz. An explanation for our improvements may be the higher number of elements in the mesh we used. Our mesh had 70 785 elements, while the mesh of Katz had only 22 000 elements. This is also supported by our effect of the mesh quality: the lower number of elements in the low quality mesh resulted in a smearing of the spatial pinna details, which yielded a worse representation of DTFs’ spectral features. Thus, a high-quality mesh seems to be essential for a good representation of spectral features in the simulation.
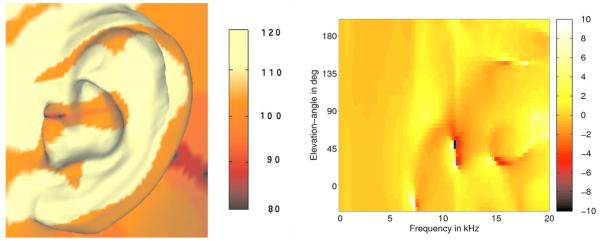
For frequencies above 7 kHz, the differences between the simulation and measurements are higher than for lower frequencies. The shapes of the simulated spectra still follow that of the measured spectra, as supported by a similar spectral tilt in both measurements and simulation. However, particular features like peaks and notches are not well represented in the simulations. For example, for the front above eye-level position (elevation angle of 45°), simulation results show a notch at 11 kHz, whereas measurements do not. However, the measurements show a notch at another frequency, namely, at 15 kHz. Unfortunately, the simulation results do not show the notch at this frequency. To address this issue, the sound pressure was analyzed in the surrounding of the receiver element. The left panel of Fig. 11 shows the sound pressure for the frequency of 11 kHz and sound source located in the median plane at the elevation angle of 45°. The position of the receiver element seems to be important because the pressure varies in the range of 20 dB within a few millimeters. If the receiver element does not represent the exact position of the microphone, then the propagation time of the reflections in the pinna is different than that in the measurements. Thus, moving the receiver element only a little could probably make the 11-kHz notch disappear. Thus, DTFs were calculated for a second receiver element in a distance of 1.2 mm from the first one. The right panel of Fig. 11 shows the difference between the amplitude spectra calculated for the two receiver elements. Local differences are evident for frequencies above 7 kHz. At 11 kHz, the dipole-like discontinuity at the elevation angle of 45°shows that the 11-kHz notch moved toward lower frequencies. This indicates that by moving the receiver element by just few millimeters some local high-frequency features of the DTFs substantially change. This may explain the good congruence of the global spectral shape and the poor congruence of the local spectral features in the DTFs. Thus, the accurate position of the receiver element seems to be crucial in the simulation of HRTFs.
FIG. 11.
(Color online) Left panel: Sound pressure at the pinna for a 11-kHz point source located in front at the elevation angle of 45°. Right panel: Difference between the amplitude spectra of DTFs calculated for two different receiver elements (see text). The color represents the magnitude in dB. Differences larger than 10 dB and smaller than −10 dB are shown in white and black, respectively.
The choice of the receiver element would have been easier when the pressure distribution were more homogeneous along the different elements. Preliminary simulation results for a mesh with a modeled ear canal showed that the pressure distribution inside the canal seems to be more homogeneous than outside of the canal. A systematic investigation of the role of the ear canal in HRTF simulations may allow to more easily choose the appropriate receiver element.
However, there are also other issues, which may be responsible for the differences between measurements and simulation. First, there are procedural differences between the visual scans and the acoustic measurements. For example, the visual scans were performed without the in-ear microphones, which probably complicated the choice of the receiver element. Also, the visual scans were performed with the rubber cap while the acoustic measurements were not. These procedural differences might have caused spectral differences in the results. Second, the mesh generation was a long-winded process. The mesh was stitched from six mesh parts; each mesh part was generated from a different perspective. The stitching process may have been inaccurate, leading to overlaps and shifts of the elements, and thus affecting simulation accuracy. As the mesh accuracy is a crucial factor for the simulations, a more accurate representation of the pinna geometry may further improve the simulation results.
V. CONCLUSIONS
In this study, a method for the calculation of HRTFs from visual scans is presented. The simulation is based on the BEM, which was coupled with the multilevel FMM in order to allow simulations for a wide frequency range. The upper frequency limit of this method does not depend on the computational limitations of modern computer systems but it depends only on the mesh size. The mesh from this study allows to calculate HRTFs for frequencies up to 35 kHz.
Comparison between the measured and simulated DTFs was performed for frequencies up to 16 kHz. It showed a good congruence of the spatial-spectral features for frequencies up to 7 kHz. For frequencies above 7 kHz, spectral shapes were in agreement with the measured data; however, local spatial-spectral features like peaks and notches were poorly represented by the simulation. Subsequent behavioral sound localization tests are required to show the actual localization ability using the simulated HRTFs.
An additional simple model of shoulders was included to the head model. Including shoulders to the simulation improved the representation of the elevation-dependent reflections for low frequencies and should be considered in further studies. The simulation temperature had a minor effect on the results. Also, the effect of mesh perturbation was very small, showing that the precision of visual scans is not crucial as long as the spatial pinna features are well represented. However, the reduction in the mesh size by only 5% had a substantial effect on the results, showing the importance of using high-quality meshes with large number of elements in HRTF simulations.
The differences between measurements and simulations may have several origins like procedural differences in the visual and acoustic data acquisition, imperfect representation of the pinna’s geometry, and mismatch in the choice of the receiver element. To address these issues, improvements in the procedures and the numerical model are required. Fast acquisition of the geometrical data and easy mesh modifications make further research on the approach worthwhile.
ACKNOWLEDGMENTS
We would like to thank Michael Hofer from the TU Vienna for providing 3D scans and meshes. We are grateful to Bernhard Laback and Holger Waubke for helping comments. Also we would like to thank Alexander Haider for his support. This work was funded by the Austrian Science Fund (Project No. P18401-B15) and the Austrian Academy of Sciences.
Footnotes
Recently, a detailed introduction to FMM-coupled BEM has been provided in Gumerov and Duraiswami, 2009.
The Burton–Miller approach was preferred over the CHIEF-point method because the selection of appropriate CHIEF points is not trivial (Schenck, 1968; Ciskowski and Brebbia, 1991).
Katz (2001b) reported data for the elevation of −45°. This elevation is outside of our measured range and thus, in our study, results for elevation of −30° are provided.
PACS number(s): 43.64.Ha, 43.20.Fn, 43.66.Qp [BLM]
References
- Algazi VR, Avendano C, Duda RO. Elevation localization and head-related transfer function analysis at low frequencies. J. Acoust. Soc. Am. 2001a;109:1110–1122. doi: 10.1121/1.1349185. [DOI] [PubMed] [Google Scholar]
- Algazi VR, Duda RO, Thompson DM, Avendano C. The CIPIC HRTF database. Proceedings of 2001 IEEE Workshop on Applications of Signal Processing to Audio and Electroacoustics; New Paltz, NY. 2001b. [Google Scholar]
- Begault DR, Wenzel EM, Anderson MR. Direct comparison of the impact of head tracking, reverberation, and individualized head-related transfer functions on the spatial perception of a virtual speech source. J. Audio Eng. Soc. 2001;49:904–916. [PubMed] [Google Scholar]
- Blauert J. Räumliches Hören (Spatial Hearing) S. Hirzel-Verlag; Stuttgart: 1974. [Google Scholar]
- Bronkhorst AW. Localization of real and virtual sound sources. J. Acoust. Soc. Am. 1995;98:2542–2553. [Google Scholar]
- Burton AJ, Miller GF. The application of integral equation methods to the solution of exterior boundary-value problems. Proc. R. Soc. London, Ser. A. 1971;323:201–210. [Google Scholar]
- Carlile S, Pralong D. The location-dependent nature of perceptually salient features of the human head-related transfer functions. J. Acoust. Soc. Am. 1994;95:3445–3459. doi: 10.1121/1.409965. [DOI] [PubMed] [Google Scholar]
- Chen Z-S, Waubke H, Kreuzer W. A formulation of the fast multipole boundary element method (FMBEM) for acoustic radiation and scattering from three-dimensional structures. J. Comput. Acoust. 2008;16:1–18. [Google Scholar]
- Ciskowski RD, Brebbia CA. Boundary Element Methods in Acoustics. Springer; Heidelberg: 1991. [Google Scholar]
- Darve E. The fast multipole method I: Error analysis and asymptotic complexity. SIAM (Soc. Ind. Appl. Math.) J. Numer. Anal. 2000;38:98–128. [Google Scholar]
- Erichsen S, Sauter S. Efficient automatic quadrature in 3D Galerkin BEM. Comput. Methods Appl. Mech. Eng. 1998;157:215–224. [Google Scholar]
- Fischer M, Gaul L. Application of the fast multipole BEM for structural-acoustic simulations. J. Comput. Acoust. 2005;13:97–98. [Google Scholar]
- Fischer M, Gauger U, Gaul L. A multipole Galerkin boundary element method for acoustics. Eng. Anal. Boundary Elem. 2004;28:155–162. [Google Scholar]
- Giebermann K. Schnelle summationsverfahren zur numerischen lösung von integralgleichungen für streuprobleme im R3 (Fast algorithms to numerically calculate the integral equation for the scattering problem in R3) Universität Karlsruhe; 1997. Ph.D. thesis. [Google Scholar]
- Greengard L, Rokhlin V. A fast algorithm for particle simulations. J. Comput. Phys. 1987;73:325–348. [Google Scholar]
- Greengard L, Huang J, Rokhlin V, Wandzura S. Accelerating fast multipole methods for the Helmholtz equation at low frequencies. IEEE Comput. Sci. Eng. 1998;5:32–38. [Google Scholar]
- Gumerov NA, Duraiswami R. A broadband fast multipole accelerated boundary element method for the three dimensional Helmholtz equation. J. Acoust. Soc. Am. 2009;125:191–205. doi: 10.1121/1.3021297. [DOI] [PubMed] [Google Scholar]
- Iida K, Motokuni I, Itagaki A, Morimoto M. Median plane localization using a parametric model of the head-related transfer function based on spectral cues. Appl. Acoust. 2007;68:835–850. [Google Scholar]
- Kahana Y, Nelson PA. Boundary element simulations of the transfer function of human heads and baffled pinnae using accurate geometric models. J. Sound Vib. 2007;300:552–579. [Google Scholar]
- Katz BFG. Boundary element method calculation of individual head-related transfer function. I. Rigid model calculation. J. Acoust. Soc. Am. 2001a;110:2440–2448. doi: 10.1121/1.1412440. [DOI] [PubMed] [Google Scholar]
- Katz BFG. Boundary element method calculation of individual head-related transfer function. II. Impedance effects. J. Acoust. Soc. Am. 2001b;110:2449–2455. doi: 10.1121/1.1412441. [DOI] [PubMed] [Google Scholar]
- Macpherson EA, Middlebrooks JC. Listener weighting of cues for lateral angle: The duplex theory of sound localization revisited. J. Acoust. Soc. Am. 2002;111:2219–2236. doi: 10.1121/1.1471898. [DOI] [PubMed] [Google Scholar]
- Majdak P, Balazs P, Laback B. Multiple exponential sweep method for fast measurement of head-related transfer functions. J. Audio Eng. Soc. 2007;55:623–637. [Google Scholar]
- Makous JC, Middlebrooks JC. Two-dimensional sound localization by human listeners. J. Acoust. Soc. Am. 1990;87:2188–2200. doi: 10.1121/1.399186. [DOI] [PubMed] [Google Scholar]
- Marburg S. Six boundary elements per wavelength. Is that enough? J. Comput. Acoust. 2002;10:25–51. [Google Scholar]
- Middlebrooks JC. Spectral Shape Cues for Sound Localization. Lawrence Erlbaum Associates; Mahwah, NJ: 1997. [Google Scholar]
- Middlebrooks JC. Individual differences in external-ear transfer functions reduced by scaling in frequency. J. Acoust. Soc. Am. 1999;106:1480–1492. doi: 10.1121/1.427176. [DOI] [PubMed] [Google Scholar]
- Middlebrooks JC, Green DM. Sound localization by human listeners. Annu. Rev. Psychol. 1991;42:135–159. doi: 10.1146/annurev.ps.42.020191.001031. [DOI] [PubMed] [Google Scholar]
- Minnaar P, Plogsties J, Christensen F. Directional resolution of head-related transfer functions required in binaural synthesis. J. Audio Eng. Soc. 2005;53:919–929. [Google Scholar]
- Møller H, Sørensen MF, Hammerershøi D, Jensen CB. Head-related transfer functions of human subjects. J. Audio Eng. Soc. 1995;43:300–321. [Google Scholar]
- Rahola J. Diagonal forms of the translation operators in the fast multipole algorithm for scattering problems. BIT. 1996;36:333–358. [Google Scholar]
- Roosendaal T, Selleri S. The Official Blender 2.3 Guide: Free 3D Creation Suite for Modeling, Animation, and Rendering. No Starch; San Francisco: 2004. [Google Scholar]
- Schenck HA. Improved integral formulation for acoustic radiation problems. J. Acoust. Soc. Am. 1968;44:41–58. [Google Scholar]
- Shaw EA. Transformation of sound pressure level from the free field to the eardrum in the horizontal plane. J. Acoust. Soc. Am. 1974;56:1848–1861. doi: 10.1121/1.1903522. [DOI] [PubMed] [Google Scholar]
- Wightman FL, Kistler DJ. Headphone simulation of freefield listening, I: Stimulus synthesis. J. Acoust. Soc. Am. 1989;85:858–867. doi: 10.1121/1.397557. [DOI] [PubMed] [Google Scholar]
- Zotkin DN, Duraiswami R, Grassi E, Gumerov NA. Fast head-related transfer function measurement via reciprocity. J. Acoust. Soc. Am. 2006;120:2202–2215. doi: 10.1121/1.2207578. [DOI] [PubMed] [Google Scholar]


