There is evidence that, in cold conditions, the temperature of human eyelids and of the ocular surface drops well below normal physiological levels. This may have a detrimental impact on the stability and functionality of the human tear film and the tear film lipid layer, which was indeed demonstrated in in vitro experiments with meibomian lipid films.
Abstract
Purpose.
There is evidence that, in cold conditions, the temperature of human eyelids and of the ocular surface drops well below normal physiological levels. This may have a detrimental impact on the stability and functionality of the human tear film and the tear film lipid layer. The goal of this project was to quantitatively examine the possible impact of temperature on the latter.
Methods.
Meibum samples were collected by using a soft-squeezing technique and were studied in a Langmuir trough. The obtained surface pressure and area isotherms were analyzed to determine the biophysical parameters of thin meibomian lipid film (MLF): the lift-off area, collapse pressure, two-dimensional elasticity, and hysteresis and their dependence on temperature.
Results.
MLF was found to be highly susceptible to changes in temperature. At temperatures below the physiological level, the MLF became stiff and shrank considerably. The shrinkage left a large portion of the air–water interface uncovered with lipid molecules. The effect was shown to be reversible. On reheating, the lipids melted and respread to restore the original film. There was a fundamental difference observed between three-dimensional melting of dry meibum in bulk and the two-dimensional melting in MLF at the air–water interface. Bulk meibum melted in a narrower temperature range and showed a much higher cooperativity of melting.
Conclusions.
Temperature critically influences MLF. Low temperature leads to stiffening of the film, which loses its ability to form continuous layers at the air–water interface. These effects were shown be of a cooperative nature, manifesting in relatively narrow concentration and temperature ranges.
The dry eye condition affects millions of people, interfering with their daily living and normal activities. The etiopathogenic mechanisms associated with dry eye are multifactorial.1 One of the important factors that may trigger and modulate the condition is the environment. Adverse environmental conditions such as high or low temperatures, wind, and low humidity are known aggravating factors in dry eye, especially in regions with arid and semiarid climates. However, the occurrence of dry eye is also high in other latitudes.1
Anatomically, the outermost layer of the tear film (TF) is formed, at least in part, from a lipid-rich meibomian gland secretion (MGS) called meibum,2–7 This layer is routinely referred to as the TF lipid layer (TFLL). One of the main functions of the TFLL is to protect the corneal epithelium against the evaporation of aqueous tears.8 Despite all efforts, understanding the mechanisms of TF and TFLL adaptation to ever-changing environmental conditions has been challenging.
It has been shown that exposure of the rabbit cornea to cold air currents causes it to reach temperatures well below its normal physiological temperature of 33°C to 34°C.9 Normal human corneal temperature is essentially the same, 33.7°C.10 It is also known that a typical melting range of normal meibum, if measured in vitro in bulk, is 19°C to 40°C.11,12 In a recent paper, we developed and tested a procedure for measuring the melting characteristics of bulk human meibum.13 Thus, if the ocular surface and the eyelid temperature drops below 33°C, the chances are that meibum in the glands will become thicker than usual, which, in turn, would impede its normal delivery to the ocular surface. Also, the TFLL will solidify, thus losing its functionality.12 These events may limit the protective effect of the TF by adversely affecting the structure, stability, and dynamics of the TFLL. We speculated that such transitions could be modeled and evaluated by studying thin meibomian films at different temperatures in vitro. Although the lipids of MGS are somewhat different from the lipid composition of aqueous tears,13 they are close enough for MGS to be used in these Langmuir trough seeding experiments as an adequate model of TF lipids.
To study meibomian films in vitro, we used a Langmuir trough—a biophysical apparatus widely used in experiments with natural lipids and synthetic surface active compounds.14 This approach proved to be very effective and informative and has been successfully used by several groups in animal and human meibum experiments.15–19 Brown and Dervichian20 apparently pioneered the use of the Langmuir technique in meibum studies in 1969. It is notable that they were unable to form meibomian films at temperatures below 35°C, although in later experiments others have used temperatures as low as 20°C.15–19 To the best of our knowledge, our report is the first systematic study of the effects of temperature on meibomian lipid films. Our preliminary results were reported in 2009 (Arciniega, JC et al. IOVS 2009;50:ARVO E-Abstract 4253).
The purposes of this study were (1) to develop and test experimental and computational approaches to the evaluation of meibomian lipid films at different temperatures in vitro and (2) to demonstrate the direct and detrimental impact of low temperatures on the biophysical properties of normal human meibomian films, which may be relevant to the TFLL stability in vivo. Note that low temperatures could further aggravate the already compromised TF and TFLL of dry eye patients with impeded MG function. The effects of parameters other than temperature were beyond the scope of this study. The sole purpose of this project was to determine the type and magnitude of the temperature-induced effects in the meibomian lipid films by using the Langmuir trough technique.
Materials and Methods
The meibum collection protocol, consent forms, and data accumulation methods were approved by the University of Texas Southwestern Medical Center Institutional Review Board and were conducted in accordance with the Declaration of Helsinki. Subjects from whom meibum samples were collected gave informed consent, and their participation complied with the HIPAA regulations.
Spectroscopy and/or HPLC-grade organic solvents used in the study (chloroform, methanol, hexane, and propan-2-ol) were purchased from Burdick & Jackson (Muskegon, MI) or Sigma-Aldrich (St. Louis, MO). Standard lipids were from Nu-Chek Prep, Inc. (Elysian, MN). Ultrapure deionized water (18 MΩ; MilliQ; Millipore, Billerica, MA) was used for making aqueous buffers. Other reagents were obtained from Sigma-Aldrich. Mass spectrometry (MS) and high-performance liquid chromatography (HPLC) were performed on the equipment described in our previous publications.13,21
The experiments with lipid films were conducted with a thermostated miniature Langmuir trough (NIMA 102M; NIMA Technology Ltd., Coventry, UK). Associated software was used to control the experiments (ver. 5.16; NINA). A refrigerating–heating circulating-water thermostat (RTE-7; ThermoFisher Scientific, Portsmouth, NH) maintained the Langmuir trough at a preset temperature. The temperature of the aqueous subphase was monitored with a thermometer. Computations were performed with commercial software (SigmaPlot ver.11 software package; Systat Software, Inc., San Jose, CA).
Meibum Samples
Meibum samples were collected on several occasions from two healthy, non–dry-eye male volunteers, 29 and 50 years of age, who underwent standard clinical tests for dry eye syndrome and showed no signs of other ocular surface diseases. A published HPLC-MS protocol was used13,21 to verify that their meibum lipid composition was within established limits.13 Briefly, a dry, 1.5-mL glass vial (Total Recovery; Waters Corp., Milford, MA), preweighed on an analytical microbalance (model AB135-S; Mettler; Toledo, OH) was filled with 1 mL of spectroscopy-grade chloroform. The subject's eyelids were dried with cotton swabs to make sure that there were no aqueous tears on them, and the MGS were expressed from the subject's two lower eyelids by moving a cotton swab in a rolling fashion toward the eyelids' edges. The expressed lipid samples were collected from the MG orifices with a platinum spatula without touching other ocular tissues. The meibum samples were transferred into the same vial containing chloroform and dissolved, and the solvent was evaporated at room temperature under a stream of dry nitrogen. The vial was reweighed to determine the weight of the dry lipid material. The dry meibum samples collected from each donor were between 0.5 and 1.3 mg. The standard error of the weighed sample was ≤5% for each of the dry samples. The samples were compared with previously characterized samples of normal meibum, to assure consistency. We have reported the lipid composition of normal human meibum in other publications (Refs. 13, 21 and references cited therein). No statistically significant deviations from the lipid composition of the previously described normal meibum samples were observed.
Surface Pressure–Area Measurements
The pressure–area measurements (π/A) were performed with a Langmuir trough (102M; NIMA), according to the standard protocol for such experiments.16–19,22,23 This method allowed us to compare our results with published data on human and animal meibum16–19 and also made it possible to use a massive amount of information accumulated over several decades on the properties of thin lipid films studied by the Langmuir trough technique. To avoid inadvertent contamination of the equipment with skin lipids, the experimenters wore polyethylene gloves. The trough was cleaned with several portions of pure chloroform and clean cellulose tissues. The clean, dry trough was filled with an aqueous subphase and pre-equilibrated for 60 minutes at 34 ± 0.5°C. A cover was used to minimize the evaporation of water, uncontrollable changes in surface temperature caused by air draft, and dust contamination during the experiments. After the 60-minute pre-equilibration period, the trough barriers were closed and the surface was checked for contamination. If a surface pressure was detected, the surface was aspirated with a Teflon probe to remove the contamination, and the barriers were closed again to recheck the surface pressure.
Once the surface was clean, a 16-μL (unless stated otherwise) aliquot of a 0.6-mg/mL MGS stock solution in chloroform was gently loaded onto the aqueous surface with the help of an HPLC-style microsyringe (Hamilton, Reno, NV), obtaining a standard meibum load of ∼10 μg/80 cm2. When concentration effects were tested, the amount of loaded meibum varied from 3 to 80 μg/80 cm2.
The solvent was allowed to evaporate for ∼30 minutes. In preliminary experiments, this time interval was shown to be sufficient for chloroform to evaporate and for the lipid layer to form at any of the tested conditions. Although in earlier studies even shorter evaporation times were allowed,16–19,23 those experiments were conducted at room temperature or above, whereas our tested temperature range was much broader and started at 3°C. Thus, to ensure complete evaporation of the solvent and proper equilibration of lipid layers, we increased the preincubation times to ∼30 minutes
To record the pressure/area (π/A) isotherms, we compressed the lipid layer at a rate of 20 cm2/min between the areas of 80 and 25 cm2. The surface pressure π was measured with a Wilhelmy plate made of filter paper (Chr 1 filter; Whatman, Inc., Piscataway, NJ), as suggested by the trough's manufacturer. In a typical experiment, the target surface pressure (πt) for the trough was set to be 35 mN/m. Then, the dynamic (π/A) isotherms were recorded in cycles.
A 0.9% (wt/vol) saline solution in 50 mM Tris-HCl (pH 7.6; TBS) was used as an aqueous subphase. TBS is one of the standard solutions for biophysical and biochemical studies. Its pH value (7.6) and salinity (0.9%, or 150 mM of NaCl) were chosen to match those of human tears.24,25 In preliminary experiments, no adverse effects of 2× higher (i.e., 1.8%, wt/vol) concentration of NaCl on π/A isotherms were observed (not shown). The potential effects of other ions have not been tested at this time, as it is has been shown earlier that other cations had only subtle effects on the meibomian layers in tested conditions (Mudgil P, et al. IOVS 2007;48:ARVO E-Abstract 436).
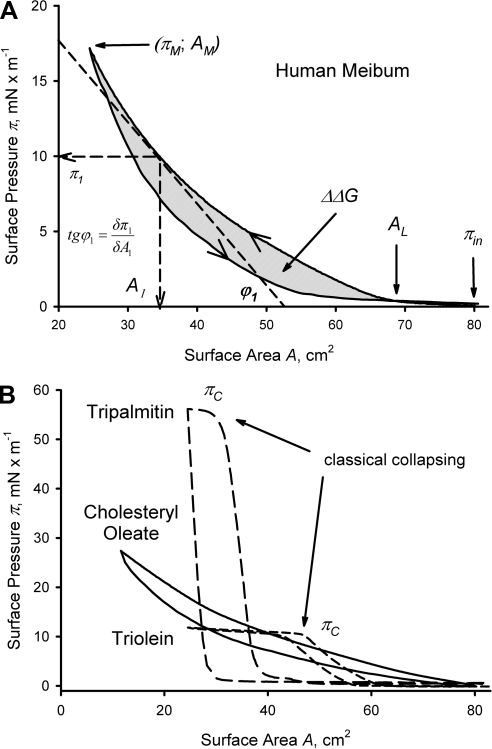
The data were analyzed by using standard parameters, such as initial surface pressure (πin), maximum surface pressure (πm), collapse pressure (πc), lift-off area (AL), hysteresis (ΔΔG), and in-plane elasticity modulus (Cs−1; Fig. 1A). Compression and decompression parts of the isotherms are labeled with arrows. Under the conditions of a Langmuir trough experiment, the πin for a clean aqueous surface is arbitrarily set at 0. Thus, when a surface (lipid) layer is formed, πin starts to deviate from 0. The values of πm were typically kept below 35 mN/m, to minimize the risk of breaching the trough barriers. However, in tests with the model lipids (Fig. 1B), surface pressures as high as 55 mN/m were easily obtainable. The lift-off area AL was determined as the point at the compression curve where π assumed a non-0 positive value. The numerical value of ΔΔG is a measure of the system's hysteresis.26 ΔΔG was computed as the area between the compression and expansion parts of a (π/A) isotherm and are expressed in microjoules. Two-dimensional (or in-plane) compressibility at surface area A (Cs) can be determined from the slope of the compression isotherm and is defined as
expressed in meters per millinewton (m/mN).27 The in-plane elasticity modulus Cs−1 is determined as the inversed Cs,
and is expressed in millinewtons per meter (mN/m). The most direct way of determining Cs−1 is to calculate the slope of a π/A isotherm (determined as tgϕ1) at the desired surface area or pressure (e.g., π1 in Fig. 1A) and multiply it by −A1. The theoretical range of Cs−1 is from 0 to ∞, with 0 meaning infinite compressibility (or deformability), and ∞ meaning infinite elasticity (or rigidity) of the layers: the higher the value of Cs−1, the more rigid the layer. The in-plane elasticity modulus Cs−1 can be calculated by using either the graphic method depicted in Figure 1A or computationally by numeric differentiation.
Figure 1.
Representative (π/A) isotherms and explanations of measured parameters. (A) Human meibum; ∼10 μg/80 cm2; trough temperature, 34°C. (B) Three standard lipids: tripalmitin, triolein, and cholesteryl oleate; 8 μg/80 cm2 each; trough temperature, 34°C.
Effects of Temperature on Meibomian Lipid Films
In a first series of (π/A) experiments, effects of temperature (T) were tested at three different temperatures (3°C, 34°C, and 43°C), essentially as described in the previous section. This temperature range was chosen to cover the lowest corneal temperature (3°C) measured in experimental conditions in vivo,9 the corneal physiological temperature (∼34°C), and the high temperature (43°C), at which meibomian lipids were shown to be completely melted.13 The trough was pre-equilibrated at the desired temperature for 30 minutes before the meibum was loaded. The meibum loads (16 μg) were identical in every experiment. Once the meibum had been loaded and the layer equilibrated, a series of dynamic (π/A) isotherms was recorded, and the parameters were calculated.
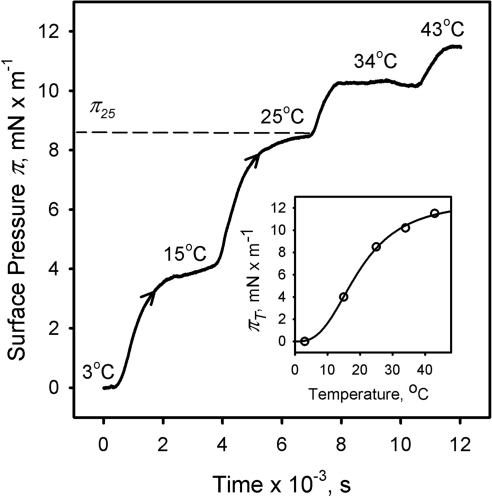
Along with the (π/A) experiment, a series of (π/T) experiments was designed and conducted, to determine the impact of temperature on meibomian lipid films. First, the Langmuir trough barriers were placed again at 40 cm2. Then, the air–liquid interface of the preloaded subphase was cleaned as usual and equilibrated at 3°C for at least 60 minutes. The liquid surface was rechecked for the presence of any surface contamination and, if needed, recleaned. Then, after the readings were zeroed, a 16-μL aliquot of the chloroformic stock solution of MGS (10 μg total) was placed onto the aqueous subphase, and the solvent was allowed to evaporate. Then, after a 10-minute period of no changes in the surface pressure, the experiment started with a recording of the initial part of the (π/t) curve (where t is time) for a few minutes to establish a baseline. Once the baseline had been established, the temperature of the circulating water bath was increased to a physiological level of 34°C while the (π/t) curve was still being recorded. The increase in temperature to the new equilibrium level was not instantaneous. As we had established in separate experiments by monitoring the trough's temperature without meibum, it took, on average, 1 hour for the trough to reach the new temperature. The slow rate of reaching the new equilibrium was caused by the sheer masses of the trough and the water in the water bath, which had to be warmed up or cooled down by 30°C. Once the surface pressure of the lipid film had stabilized at the new temperature of 34°C, the (π/t) curve approached a plateau. Then, the trough was cooled down to 3°C while the (π/t) curve was recorded. This concluding step took another hour or so.
In another (π/t) experiment, the TBS subphase was cooled down to 3°C, and the meibomian lipids were loaded onto the surface and equilibrated at 3°C, as just described. As soon as the surface pressure reached a plateau at 3°C, a new temperature of 15°C was set, and the increase in the surface pressure was continuously monitored until a new equilibrium was reached, now at 15°C. The latter step was repeated for temperatures of 25°C, 34°C and 43°C, always allowing the surface pressure to stabilize between the different temperatures for 10 to 15 minutes. The surface pressure (π/t) was continuously monitored and recorded during the entire experiment.
The data were interpreted in terms of a stationary surface pressure (πT) achieved at a target T under equilibrium conditions. The changes in πT were reflective of the temperature-dependent changes in the organization of the lipid layers. The kinetics of the transformations were not studied because of the mentioned temperature inertia of the trough.
Results
To validate the implemented procedures, we recorded the (π/A) isotherms of three standard lipids (Fig. 1B). These compounds belong to the classes of meibomian lipids (triacylglycerols and cholesteryl esters) that are reportedly present in meibum.13,21,28,29 One can clearly see that the shapes of the isotherms of triacylglycerols are vastly different from those of a meibum sample, with the major differences being (1) their clearly defined collapse pressures πc of ∼11 mN/m for triolein and 55 mN/m for tripalmitin and (2) a much steeper slope of the tripalmitin's isotherm. The shape of the isotherms and the collapse pressures matched those reported earlier.30,31 Cholesteryl oleate produced almost featureless isotherms that were very similar to those of human meibum. Apparently, under the tested conditions, meibomian and cholesteryl oleate layers did not collapse at all.
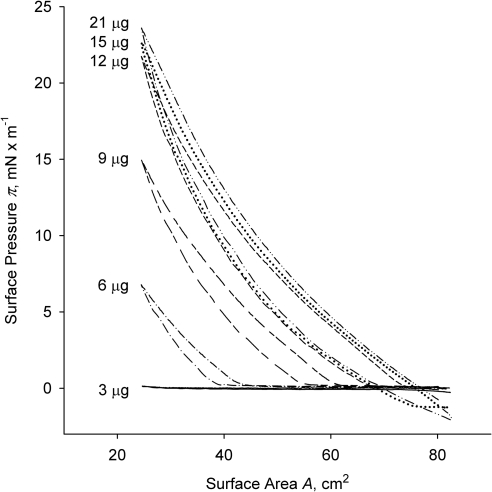
Then, we tested meibum's behavior at 34°C as a function of the amount of lipid material loaded onto the surface of the TBS subphase (Fig. 2). The lowest amount tested (3 μg/80 cm2) produced little change in the surface pressure at any degree of layer compression. The isotherm barely registered with a lift-off area AL of ∼30 cm2. By doubling the amount of meibum material, we started to see actual isotherms with an AL of ∼45 cm2 and πm of ∼7 mN/m. Subsequent increases in the amount of loaded meibum led to a rapid increase in both parameters, until they virtually stopped changing when the load exceeded 21 μg. At this point, the AL equaled the total area of the trough (80 cm2) and πm approached 25 mN/m, which was in line with reports from other groups.16–19 Of note, the initial surface pressure πin changed from 0 to −2 mN/m when the meibum loads became 15 μg or more. Any further increase in the amount of loaded meibum (up to 80 μg per trough; not shown) did not change the (π/A) isotherms. The highest recorded surface pressure did not rise above ∼25 mN/m, and the (π/A) isotherms did not produce any abrupt changes in their slopes. By and large, meibum formed stable films, which, after initial adjustment, were capable of withstanding multiple compression–expansion cycles.
Figure 2.
The changes in (π/A) isotherms of human meibum in response to different meibum loads. Normal human meibum was loaded in the amounts indicated next to each curve (between 3 and 21 μg of MGS per 80 cm2); trough temperature, 34°C.
The amount of human meibum loaded onto the surface (between 3 and 21 μg per 80-cm2 trough), was about the same as the one used in earlier studies of bovine meibum.16 Similar to bovine meibum, human meibomian lipid films in our experiments did not collapse (here, collapsing is defined as shown in Fig. 1B). The overall shape of the isotherms showed a high degree of similarity between the results of both groups. However, unlike the observations reported by Tragoulias et al.16 for rabbit meibum, changes in the temperature of the subphase were shown to have a very strong impact on the surface properties of Langmuir films of human meibum formed on the TBS subphase.
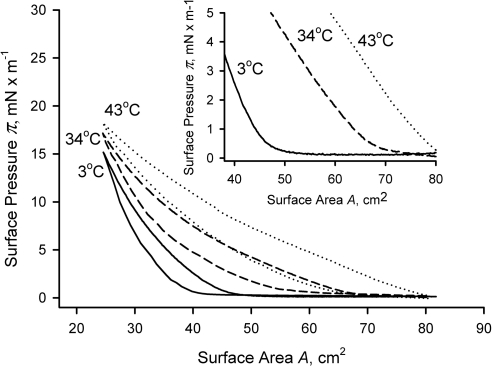
To determine the impact of temperature on the meibomian lipid films, we recorded (π/A) isotherms at 3°C, 34°C, and 43°C (Fig. 3). When plotted on the same graph, the (π/A) isotherms showed dramatic differences at any given surface area (A). One can see that at the highest tested temperature of 43°C, the surface pressure (π) started to increase as soon as the barriers started to close (Fig. 3, inset) and, in this experiment, reached 18 mN/m without any signs of collapsing. This increase in the surface pressure was recorded as a compression part of the (π/A) cycle. Then, the barriers started to move in the opposite direction opening the surface, which produced the expansion part of the (π/A) cycle. The compression-expansion cycles were repeated several times, to ensure the reproducibility of the generated data. With the exception of a few initial cycles (typically, three or less), the subsequent (π/A) measurements were very reproducible, showing no drift in the readings. Of interest, while being totally different at low surface pressures, at higher pressures (i.e., at higher degrees of compression of the surface layers), the isotherms started to converge, all reaching comparable πm.
Figure 3.
(π/A) isotherms of human meibum recorded at different temperatures. Equal amounts of normal human meibum (∼16 μg/80 cm2) were tested at the temperatures indicated next to each curve. Inset: an expanded initial portion of the main graph showing the lift-off areas.
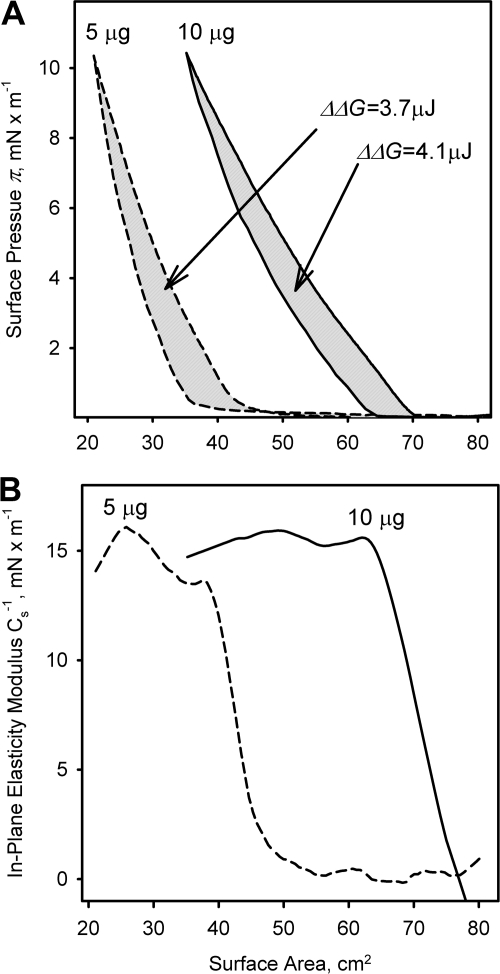
The (π/A) isotherms of human meibum and standard lipids showed noticeable hysteresis ΔΔGs (Figs. 1–4) that were both concentration- and temperature-dependent. The ΔΔGs at 10 μg of meibum (Fig. 3) were 4, 9, and 14 μJ at 3°C, 34°C, and 43°C, respectively. Similarly, the determined values of ΔΔG measured at 34°C for 3 to 21 μg of meibum (from the data presented in Fig. 2) were 0, 1.4, 6.9, 10.5, 12.8, 14.1, and 15.9 μJ, approaching 0.8 μJ/μg meibum (or 0.8 J/g meibum) at high lipid loads. In a separate experiment, when πm was set at 10 mN/m, the resulting isotherms for 5 and 10 μg of meibum looked alike (Fig. 4A). The hysteresis ΔΔG was found to be 3.7 and 4.4 μJ, correspondingly. Once the layers had been formed, the in-plane elasticity moduli Cs−1 became almost identical (∼15 mN/m, Fig. 4B) showing that the layers assumed functionally similar structures at equal values of πm.
Figure 4.
Evaluation of the changes in (π/A) isotherms of human meibum in response to different meibum loads at a limiting surface pressure of 10 mN/m. (A) Calculation of ΔΔG; (B) calculation of Cs−1.
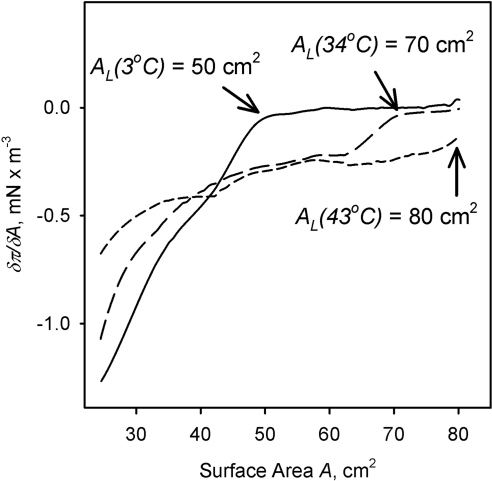
The isotherms depicted in Figure 3 were used to determine the temperature dependence of the corresponding AL. The surface pressure π measured at any given surface area A rose with the increase in temperature. Also notable were the changes in δπ/δA (i.e., the rate with which surface pressure rose on compressing the layers) once the surface pressure started to increase (Fig. 5). Experiments were repeated several times with the same results. It became clear that the same amount of loaded meibum (16 μg) produced totally different results at different temperatures. The AL at 43°C equaled the total area of the trough (80 cm2) because surface pressure begun to increase as soon as the barriers started to close. At 34°C, however, the AL decreased to approximately 70 cm2, and at 3°C, it became a strikingly low 50 cm2.
Figure 5.
Dependence of the AL and δπ/δA of human meibum on the temperature and the available surface area. Exact conditions are indicated next to each curve. Meibum load was ∼16 μg/80 cm2.
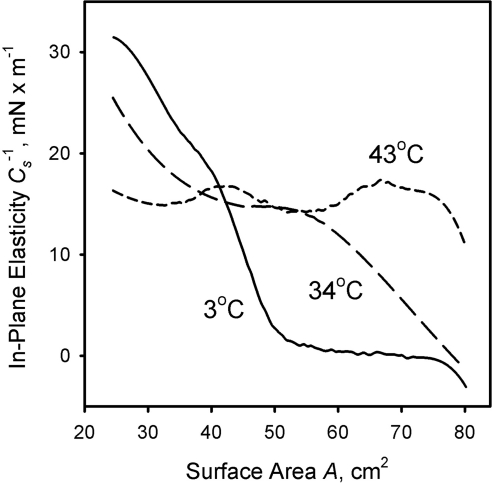
The in-plane elasticity modulus Cs−1 measured at different temperatures could be calculated by using numeric differentiation. The results of the latter approach are presented in Figures 6 and 7. At 4°C and low compression ratios, the meibomian lipid film has almost 0 in-plane elasticity. This situation, however, changes once the surface area is compressed to 50 cm2 and below: Cs−1 assumes a positive value and quickly rises to 30 mN/m and higher. At 34°C, one can observe a steady, but nonlinear increase in Cs−1 from 0 to ∼25mN/m, whereas at a high temperature of 43°C, Cs−1 is relatively constant and stays in the range of 15 ± 3 mN/m, no matter what the compression ratio. Unlike meibum, the model lipid tripalmitin formed a rigid layer that collapsed at a very high pressure of ∼55 mN/m, and whose Cs−1 was 400 to 500 mN/m. Triolein layers, on the other hand, collapsed at a much lower surface pressure of ∼11 mN/m, but also formed layers that were more rigid (Cs−1 ≅ 55 mN/m) than those of meibum. Cholesteryl oleate layers did not collapse at any surface pressure and showed viscoelastic behavior similar to that of meibum (Cs−1 ≅ 15 mN/m).
Figure 6.
In-plane elasticity of meibomian films measured at three different temperatures. Meibum load, ∼16 μg/80 cm2.
Figure 7.
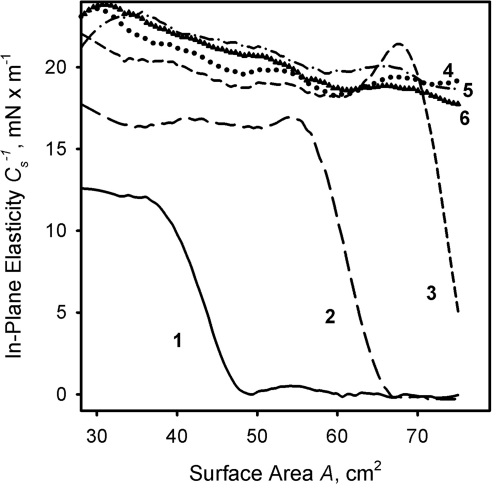
The effects of meibum load on the in-plane elasticity modulus of meibomian films at physiological temperature. Curves 1 through 6 correspond to meibum loads of 3, 6, 9, 12, 15, and 21 μg per 80 cm2 (data from Fig. 2).
Cs−1, when calculated for various amounts of loaded meibum at a constant temperature of 34°C (Fig. 7), showed an interesting and unexpected trend. At low amounts of spread meibum (3 μg/80 cm2), Cs−1 was 0 when A was changing from 80 to 30 cm2. No discernable (π/A) isotherm above the noise level was recorded. The situation changed once the load was increased to 6 μg (curve 1, Fig. 7). One can clearly see that the Cs−1 of the meibomian lipid layer remained at 0 between 80- and 50-cm2 surface areas and started to rise once the layer was compressed beyond the latter point. The trend continued once the amount of lipid material was increased to 9 μg (curve 2). The area of 0 elasticity shrank, whereas the Cs−1 went up at any other tested surface area. Once the lipid load increased to 12 μg, Cs−1 assumed a non-0 positive value as soon as the trough barriers started to close (curve 3). At higher loads of 15 to 21 μg/80 cm2, the corresponding (Cs−1, A) graphs almost coincided, showing a very slow increase in Cs−1 from 18 to 22 mN/m regardless of the lipid load (curves 4–6, Fig. 7). We also tested meibum loads of up to 80 μg/80 cm2 (not shown), with the same results.
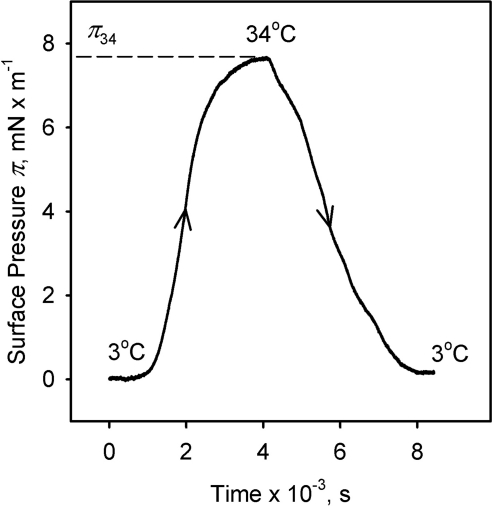
Kinetic (π/t) experiments at a constant surface area of 40 cm2 demonstrated that the change in surface pressure of the meibomian lipid films caused by the changes in the temperature of the TBS subphase was reversible (Fig. 8). Similarly, an increase in the temperature of the TBS subphase at a constant surface area A of 40 cm2 caused an increase in the equilibrium surface pressure of the meibomian lipid film (Fig. 9). Again as with the data in Figure 8, the slow rate with which the surface pressure changed when a new temperature was set was reflective of the time needed to re-equilibrate the trough at a new temperature, and was not an indicator of the rate of lipid rearrangements, per se. Thus, only the absolute differences between corresponding πT were considered. Plotted as (πT; T), the data provided a functional correlation between πT and T, which was adequately approximated by an empiric cooperativity equation:
where πT is the equilibrium surface pressure π at a given temperature T; πmax is the theoretical maximum surface pressure achievable at T→∞; n is an experimental constant that determines the degree of cooperativity of meibum's melting and spreading; and K is a temperature at which πT becomes ½ of πmax (Fig. 9, inset). The best-fitting curve computed numerically produced the following parameters: πmax = 12.7 ± 0.8; n = 2.8 ± 0.4; K = 19.7 ± 1.2 (r2 = 0.9991).
Figure 8.
The reversibility of the effect of temperature on the surface pressure of meibomian film as measured in (π/t)-style experiments. Surface area, 40 cm2; meibum load, ∼10 μg.
Figure 9.
The surface pressure of meibomian films is proportional to their temperature. Surface area, 40 cm2; meibum load, ∼10 μg. As an example, equilibrium surface pressure of ∼8.5 mN/m at 25°C is shown (π25). Inset: Nonlinear increase in the equilibrium surface pressure πT of meibomian films in response to the increases in temperature T.
Discussion
In the past, Langmuir trough-style experiments with MGS were conducted at a variety of trough temperatures, ranging from 20°C to 37°C.2,15–20 Combined with the fact that some of the studies were performed with human meibum, whereas others were performed on animal (e.g., rabbit and bovine) MGS, these differences precluded unambiguous characterization of the effects of temperature on the (π/A) isotherms of human meibomian lipids. In one of these papers16 temperature was reported to have no effect on the (π/A) isotherms of rabbit meibum studied at 20°C and 37°C. However, recent data suggest that the melting range of human meibum is 20°C to 40°C.11,13 We have shown13 that waxy human meibum collected from healthy, non-dry-eye donors started to melt at approximately 20°C, reached a clear point at a body temperature of 36.5 ± 1.0°C, and kept melting up to ∼45°C, at which point it became completely clear and liquid. The inflection point of the melting curve was determined to be 32.5 ± 1.0°C,13 which is close to the normal human cornea temperature of 34.3 ± 0.7°C.32 The shape of the recorded melting curve and the simultaneous visual inspection of the meibum samples under the microscope during the melting experiments clearly indicated that, in the range of temperatures between 20°C and 30°C, human meibum remained a quasi-solid (and turbid) wax. It was reasonable to speculate that these temperature-dependent transitions would translate into distinctively different (π/A) isotherms. Thus, a systematic study of the effects of temperature on the properties of human MGS was warranted.
First, we tested the effects of increasing amounts of meibum loaded onto the air–liquid interface at a physiological temperature of 34°C. Unlike standard lipids (Fig. 1B), meibum did not produce any kinks or bulges in the isotherms (which would have been indicative of classical collapsing) in any of the tested conditions, regardless of the amount of meibum loaded. To the best of our knowledge, a rationale for choosing the amount of human meibum needed to form a condensed monolayer has never been provided before, primarily because of the insufficient information on the chemical structures, molecular masses, and relative ratios of lipids present in human meibum. At this moment, the exact calculations of the surface occupancies for a mixture of various compounds as complex as meibum are still not possible. However, our recent publications on the topic13,33,34 allowed us to estimate the possible ranges of these parameters. Postulating that (1) an average molecular weight of a well-characterized meibomian lipid [MWAV] is ∼700 (which is an average of 650 for wax esters and 750 for cholesteryl esters and (O-acyl)-omega-hydroxy fatty acids13,33,34), and (2) its apparent partial molecular area per molecule in a condensed monolayer (Am) should be approximately 60 to 70 Å2 (an average between ∼20 Å2 for compounds such as free fatty acids and wax esters,30,35 60 Å2 for saturated triacylglycerols,31,36 and 80 to 120 Å2 for the bulkiest unsaturated triacylglycerols and cholesteryl esters30,36–38), one would need ∼1.4 × 10¹⁶ molecules or ∼16 μg of meibum per 80-cm2 area to form a condensed monolayer. Tragoulias et al.16 used a very close number of molecules (1.72 × 10¹⁶) in their calculations, but they worked with rabbit meibum, did not provide a rationale for this number, and did not specify whether they considered the rabbit meibum layers to be condensed. The largest amount of meibum used in our experiments presented in Figure 2 was ∼21 μg, which was sufficient to form a condensed monolayer, even when the trough barriers were open, and guaranteed a multilayered structure at higher degrees of lateral compression of the layer. Of importance, under any tested conditions the meibum layer did not show any signs of the classic collapsing via fracturing or solubilization illustrated in Figure 1B. At the same time, a slight drop in πin on adding the increasing amounts of meibum was observed. The factors that lead to such an effect are not yet clear. However, several classes of compounds that cause measurable increases in the surface tension at the water-air interfaces are known and include carbohydrates, amino acids, and salts.39 It is possible that meibum has a small, but important, pool of compounds in its composition that are capable of restructuring the surface layer, leading to the increase in its surface tension and the simultaneous decrease in the surface pressure. Note that the negative πin is small, manifests itself only at very high meibum loads, and quickly disappears once the layers start to compress.
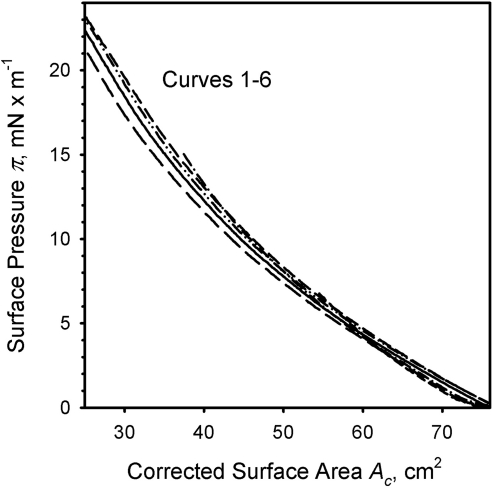
Second, we were able to demonstrate that lipid films formed from various amounts of meibum became functionally similar to each other when the films were laterally compressed to achieve comparable surface pressures (Fig. 4) and densities (Fig. 10) of lipid molecules. When equally limited surface pressures πm were achieved in an experiment with two different meibum loads, their in-plane elasticity moduli became a comparably modest 15 mN/m (Fig. 4). When the (π/A) isotherms depicted in Figure 2 were superimposed to make their ALs coincide, the ascending parts of the isotherms coincided too, regardless of the amount of loaded meibum (Fig. 10). Thus, the viscoelastic properties of these meibomian lipid layers were found to be similar. Our calculations of the in-plane elasticity moduli Cs−1 (Figs. 4, 6, 7) further reinforced this conclusion.
Figure 10.
Parallelism of (π/A) isotherms of human meibomian films formed of varying amounts of meibum after their correction for the areas of 0 elasticity. Curves 1 through 6 were taken from Figure 2, and the ascending portions showing the increases in elasticity have been superimposed. The corrected surface area Ac was calculated as follows: Ac = An + (80 − AL), where 80 is the total surface area of the trough (in cm2), AL is the lift-off area, and An is the current surface area at which a surface pressure π is measured (definitions are in Fig. 1).
Third, we evaluated the hysteresis effects in meibomian lipid films observed for all tested meibum samples in all tested conditions. Hysteresis ΔΔG is determined as the area trapped between the compression and decompression parts of a (π/A) isotherm (Fig. 1A) and is considered a quantitative measure of structural rearrangements during the compression cycle.40 In a recent publication, Girard-Egrot and Blum41 explained that ΔΔG is “…mainly ascribed to a difference in the aggregation (organization of the molecules at the compression) and relaxation (disorganization of the molecules at the decompression) processes, due to the ‘non-return’ of domains formed during the compression to their original state after decompression.” In the case of meibum, a highly irregular surface topography that changes with surface pressure has been well documented for humans and Bovinae.15,18,19,42
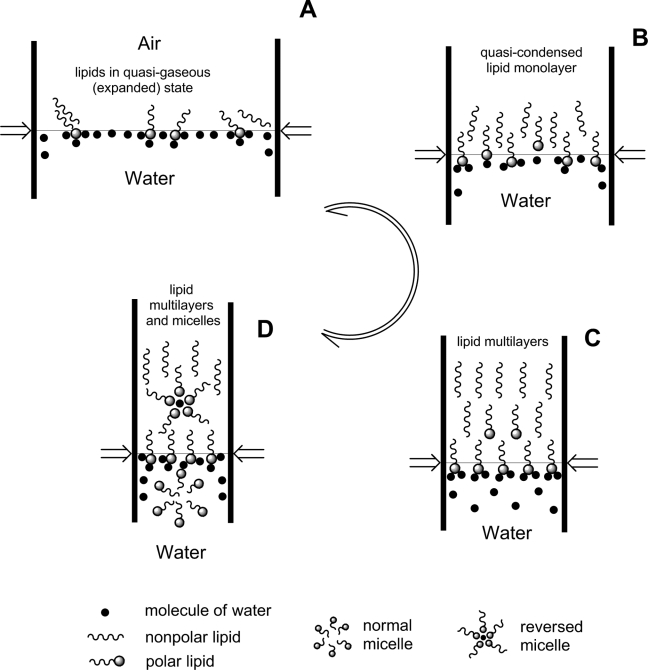
It is worth noting that on a molecular level, closing barriers work to overcome the attraction of amphiphilic lipids to the aqueous subphase43 and to eject them, either into a bulk phase away from water molecules, or inside the aqueous phase, whereas during the decompression part of the cycle the molecules spontaneously return to the interface (Scheme 1). In the case of meibum, which has a notable presence of anionic lipids,33 pushing a portion of those amphiphilic molecules inside the hydrophobic core of the TFLL by compressing the lipid film requires extra energy, as the initially hydrated polar groups of the amphiphiles have to be desolvated, and/or their electrostatic charges must be neutralized before they become miscible with the very hydrophobic lipids of the nonpolar sublayer of the meibomian lipid film. Alternatively, if the neutralization does not occur, they must carry a large pool of water molecules that surround their polar heads inside the lipid layer, which requires extra energy, too. This mechanism is supported by earlier observations of Petrov et al.44
Scheme 1.
Schematic representation of the main phase transitions in the model meibomian lipid film produced by lateral compression forces in the Langmuir trough experiments.
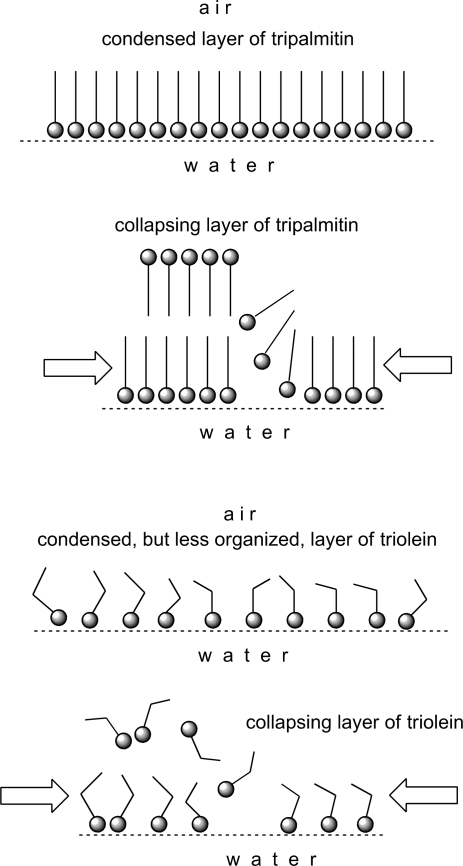
Of note, the magnitude of ΔΔG computed from our data did not exceed 0.8 J/g meibum. This number is an order of magnitude smaller than the ones reported for monolayers of placenta plasma membranes26 and of tripalmitin (∼6 J/g) (Fig. 1). The ΔΔG for meibum layers, however, was close to ΔΔG for triolein layers (∼0.8 J/g). The difference in ΔΔG between tripalmitin and triolein is undoubtedly caused by the differences in their degrees of unsaturation, which leads to a denser packing of tripalmitin molecules than those of triolein (Scheme 2). Denser packing, in turn, facilitates intermolecular Van-der-Waals interactions, which make the layers of tripalmitin more rigid than those of the less densely packed and more fluid triolein. Note the absence of a first-order transition from the liquid-expanded (LE) phase to the condensed (C) phase for meibum in all tested conditions.
Scheme 2.
Condensing and collapsing of tripalmitin and triolein monolayers.
Because of the relatively monotonous nature of the meibum (π/A) isotherms, only a few major states of lipid films are hypothesized (Scheme 1). It appears that, at physiological temperatures and higher, none of these states exists in pure form, as the isotherms do not have any abrupt transition points and definitively different areas that could have been identified as clearly different phases. Phase transitions A⇄B⇄C⇄D are gradual, smooth, and spread over a wide range of surface pressures. An important finding is that the meibomian lipids never produced a purely condensed layer, rather they continuous adapted their aggregation state in response to the increasing surface pressure. There is little doubt that on compression of a surface film made of several compounds of various hydrophobicities, the more hydrophobic compounds with the lowest affinity to water tend to leave the interface first,45 followed by the increasingly more polar types of molecules. Thus, the best definition for this type of behavior would be seamless collapsing. Undoubtedly, this seamless collapsing originates from the heterogeneity of the lipid composition of meibum which causes the microcollapse of various lipid aggregates at multiple and different πc and produces one smooth and almost featureless (π/A) isotherm. It also seems that the phase transitions A⇄B⇄C⇄D in meibomian films are rather effortless and have low potential barriers, as the values of Cs−1 are modest once the lipid film has been formed (Figs. 4, 6, 7). This result was in striking contrast with the tripalmitin layers, which had a Cs−1 of 400 to 500 mN/m, but was very close to the cholesteryl oleate layers (Cs−1 ≅ 15 mN/m).
Such gradual transitions do not take place in homogeneous, densely packed, and rigid films of tripalmitin, which seem to collapse as a whole (Scheme 2). Triolein, on the other hand, is closer to meibum in terms of its unsaturation,13,21 and its layers are apparently less organized than those of tripalmitin. Thus, its intermolecular lipid–lipid interactions have to be weaker, and its layers collapse easier than those of tripalmitin. The films of cholesteryl oleate were functionally the closest to the meibomian layers among tested compounds.
Low temperature had dramatic effects on the structure and functionality of meibomian films. At 3°C, the samples showed no increase in π during the first two-thirds of the compression cycle, whereas at 34°C and 43°C (at which meibum is partly or completely melted13), this initial portion of the isotherm either shortened or disappeared altogether (Figs. 3 and 4). Though the amount of loaded meibum per square centimeter remained the same throughout the experiment, the surface pressure changed dramatically. The decrease in surface pressure at low temperatures was detected regardless of the type of experiment. Both (π/A)- and (π/t)-style showed that lowering the temperature caused the surface pressure to decrease reversibly (Figs. 3, 8). We attribute these changes to the (reversible) aggregation of lipid molecules at low temperatures, leading to the formation of virtually lipid-free zones on the surface of the aqueous subphase. Compression of these lipid-free zones caused no change in the surface pressure until the lipid-free zones were gone and lipid molecules and/or aggregates were brought together close enough to be able to start interacting with one another. As soon as the temperature increased, the lipid aggregates started to melt and eventually restored the film. Clearly, changing temperature caused meibum layers to undergo structural changes that can be described as an expanded→tightly packed transformation.
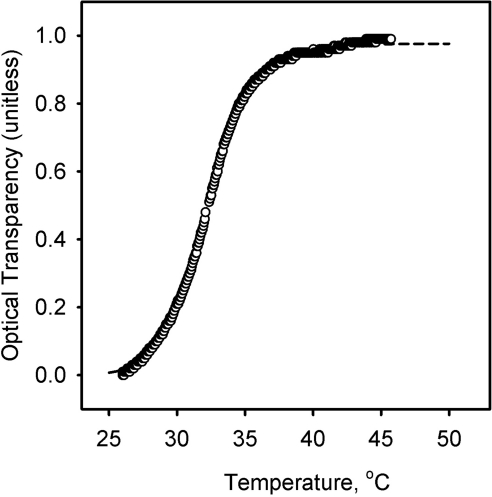
Our experiments accentuated the well-known property of lipids—namely, the often cooperative nature of lipid–lipid interactions and melting.46–48 The increase in surface pressure πT in response to the increase in temperature in the (π/t) experiments clearly had a sigmoidal shape (Fig. 9, inset). Cooperative effects in meibum melting were also observed in our earlier experiments13 with solid samples. In those experiments, melting of bulk meibum was studied by measuring its normalized reflectivity R. However, we have never quantitatively analyzed the data before. These data, based on the measurements of the normalized intensity of the reflected light (R, changing from 1 to 0, and unitless), can also be presented as transparency (1 − R), which was assumed to be directly proportional to the degree of lipid melting (Fig. 11; a solid sample was a turbid but highly reflective wax, whereas the melted sample became a fluid, transparent liquid with low reflectivity). The results of our new experiments and the reflectivity data can be analyzed by using a universal sigmoidal cooperativity equation (also known as the Hill equation49,50):
Here, F(X) is an experimentally measured effect [πT, or (1 − R)] caused by a temperature T; Em is the theoretical maximum of the effect at X→∞; T0.5 is an experimental constant with physical definition of the temperature at which the effect is 50% of maximum; and n is the Hill coefficient, which varies between 0 and +∞ (infinite positive cooperativity). By definition, when 0 < n < 1, the cooperativity is negative, whereas when n = 1, the interactions are noncooperative. The values of these parameters were determined by nonlinear curve fitting with equation 4 (Table 1).
Figure 11.
Cooperative effects in melting bulk meibum. The temperature dependence of optical transparency of dry bulk human meibum was computed using the reflectivity data recorded by a melting-point apparatus as described in another study.13 (○) Experimental data; dashed line: a theoretical curve calculated with equation 4, according to a nonlinear curve-fitting routine and the parameters presented in Table 1.
Table 1.
Cooperative Effects in Meibum Experiments
| Experiment | Measured Effect Em | Hill Coefficient n | T0.5 |
|---|---|---|---|
| (π;/T) | πT | 2.8 ± 0.4 | 19.7 ± 1.2 |
| [(1 − R); T] | (1 − R) | 19.3 ± 0.1 | 32.1 ± 0.1 |
Thus, we can summarize that changes in temperature had a strong impact on the stability and properties of meibomian films formed from normal human meibum in vitro.
The data presented in Table 1 lead to a few conclusions that may have possible physiological significance. First, it became clear that both the temperature of the meibomian lipid films and the amount of lipid material used to make these films have nonlinear effects on their properties, meaning that when the temperature of the layer starts to fall below the physiologically normal 34°C, the lipid film progressively shrinks and becomes stiffer, and these changes accelerate as the temperature drops. The steepest drop occurred between 30°C and 10°C (Fig. 9, inset). The impact of low temperatures is progressively potentiated with the decrease in the amount of the spread lipid material: when the surface is large, small amounts of meibum are incapable of forming a diluted, but continuous, lipid film showing no resistance to the closing barriers of the Langmuir trough (Fig. 2). Either of these two phenomena could compromise TFLL and TF in vivo, even in healthy, non-dry eye subjects. A combination of these two fundamental effects with MG dysfunction may have truly disastrous consequences for the dry eye patients with already impeded TF and TFLL. The current literature is lacking in information on the possible temperature ranges of the eyelids and ocular surface in wintery conditions measured outside the laboratory environment. However, those who reside in cold climates would have little doubt that eyelid temperature could fall far below the normal physiological level. In a controlled laboratory environment, the human corneal temperature has been demonstrated to drop to 26.4 ± 0.9°C if the ambient temperature is kept at −20°C.51 This corneal temperature is far lower than the melting range of bulk meibum and that of the meibomian films studied in our experiments. Thus, lowering corneal temperature to 26°C can have a strong impact on the functionality of the meibomian films. However, the results reported by Geiser et al.51 were obtained in static conditions with no air flow simulating the outdoor conditions, while Freeman and Fatt9 did account for the effects of the air current and measured an even more substantial drop in the corneal temperatures to as low as 5°C, albeit in rabbits.
The second conclusion is an obvious difference between the melting of meibum in thin layer and in bulk. In film, K was estimated to be ∼20°C, while in bulk it was approximately 32°C (Table 1). The astonishingly high value of n in the latter shows that the lipid–lipid interactions in bulk are much more cooperative than in a thin layer at the air–liquid interface. Note that for two-dimensional films of meibum, a change in π from 10% to 90% of the maximum necessitates a change in T from 10°C to 40°C (Fig. 9), whereas for bulk meibum the same change happens in the much narrower temperature range of 30°C to 40°C (Fig. 11). Projecting these observations onto a situation in vivo, it seems that, although the delivery of bulk meibum from MG onto the ocular surface may be severely impeded if the temperature of the eyelids drops below 30°C (a distinctive possibility in cold weather, especially in combination with wind), meibum can still form rudimentary films even at temperatures as low as +10°C. However, their functionality would be severely compromised, and they would not be up to the task of covering and/or protecting the ocular surface.
The third conclusion is that the classic model of TFLL52 seems to be too static and does not reflect the multiple phase transitions that are relevant to the ever-changing TF in vivo and meibomian films in vitro. However, the classic model may be applicable to certain kinds of lipid domains that exist alongside other, even more diverse, supramolecular structures.
Note Added in Proof
When the current article had been finalized, we became aware of a paper by Leiske et al.,53 in which they presented a wealth of information on the rheology of meibomian lipid films formed from meibum of marsupials, Bovinae, and humans. However, that study was conducted at room temperature only. Thus, our publications should be considered as complementary ones because they explore two sides of the same story.
Footnotes
Supported in part by National Institutes of Health Grant R01EY019480 (IAB) and an unrestricted grant from Research to Prevent Blindness (New York, NY).
Disclosure: I.A. Butovich, None; J.C. Arciniega, None; J.C. Wojtowicz, None
References
- 1. Epidemiology Subcommittee of the International Dry Eye WorkShop The epidemiology of dry eye disease: Report of the Epidemiology Subcommittee of the International Dry Eye WorkShop. Ocul Surf. 2007;5:93–107 [DOI] [PubMed] [Google Scholar]
- 2. Holly FJ. Formation and rupture of the tear film. Exp Eye Res. 1973;15:515–525 [DOI] [PubMed] [Google Scholar]
- 3. Nicolaides N, Kaitaranta JK, Rawdah TN, Macy JI, Boswell FM, 3rd, Smith RE. Meibomian gland studies: comparison of steer and human lipids. Invest Ophthalmol Vis Sci. 1981;20:522–536 [PubMed] [Google Scholar]
- 4. Tiffany JM. The lipid secretion of the meibomian glands. Adv Lipid Res. 1987;22:1–62 [DOI] [PubMed] [Google Scholar]
- 5. Bron AJ, Tiffany JM. The meibomian glands and tear film lipids. Structure, function, and control. Adv Exp Med Biol. 1998;438:281–295 [DOI] [PubMed] [Google Scholar]
- 6. Ohashi Y, Dogru M, Tsubota K. Laboratory findings in tear fluid analysis. Clin Chim Acta. 2006;369:17–28 [DOI] [PubMed] [Google Scholar]
- 7. Butovich IA. The Meibomian puzzle: combining pieces together. Prog Retin Eye Res. 2009;28:483–498 [DOI] [PMC free article] [PubMed] [Google Scholar]
- 8. Mathers W. Evaporation from the ocular surface. Exp Eye Res. 2004;78:389–394 [DOI] [PubMed] [Google Scholar]
- 9. Freeman RD, Fatt I. Environmental influences on ocular temperature. Invest Ophthalmol. 1973;12:596–602 [PubMed] [Google Scholar]
- 10. Girardin F, Orgül S, Erb C, Flammer J. Relationship between corneal temperature and finger temperature. Arch Ophthalmol. 1999;117:166–169 [DOI] [PubMed] [Google Scholar]
- 11. Terada O, Chiba K, Senoo T, Obara Y. Ocular surface temperature of meibomia gland dysfunction patients and the melting point of meibomian gland secretions (in Japanese). Nippon Ganka Gakkai Zasshi. 2004;108:690–693 [PubMed] [Google Scholar]
- 12. Bron AJ, Tiffany JM, Gouveia SM, Yokoi N, Voon LW. Functional aspects of the tear film lipid layer. Exp Eye Res. 2004;78:347–360 [DOI] [PubMed] [Google Scholar]
- 13. Butovich IA. On the lipid composition of human meibum and tears: comparative analysis of nonpolar lipids. Invest Ophthalmol Vis Sci. 2008;49:3779–3789 [DOI] [PMC free article] [PubMed] [Google Scholar]
- 14. Gunstone FD, Harwood JL, Padley FB. The Lipid Handbook. 3rd ed Boca Raton, FL: Taylor & Francis Group, LLC; 2007 [Google Scholar]
- 15. Kaercher T, Honig D, Mobius D, Welt R. Morphology of the Meibomian lipid film: results of Brewster angle microscopy. Ophthalmologie. 1995;92:12–16 [PubMed] [Google Scholar]
- 16. Tragoulias ST, Anderton PJ, Dennis GR, Miano F, Millar TJ. Surface pressure measurements of human tears and individual tear film components indicate that proteins are major contributors to the surface pressure. Cornea. 2005;24:189–200 [DOI] [PubMed] [Google Scholar]
- 17. Millar TJ, Tragoulias ST, Anderton PJ, et al. The surface activity of purified ocular mucin at the air-liquid interface and interactions with meibomian lipids. Cornea. 2006;25:91–100 [DOI] [PubMed] [Google Scholar]
- 18. Mudgil P, Millar TJ. Adsorption of apo- and holo-tear lipocalin to a bovine Meibomian lipid film. Exp Eye Res. 2008;86:622–628 [DOI] [PubMed] [Google Scholar]
- 19. Millar TJ, Mudgil P, Butovich IA, Palaniappan CK. Adsorption of human tear lipocalin to human meibomian lipid films. Invest Ophthalmol Vis Sci. 2009;50:140–151 [DOI] [PMC free article] [PubMed] [Google Scholar]
- 20. Brown SI, Dervichian DG. The oils of the meibomian glands: physical and surface characteristics. Arch Ophthalmol. 1969;82:537–540 [DOI] [PubMed] [Google Scholar]
- 21. Butovich IA. Lipidomic analysis of human meibum using HPLC-MSn. Methods Mol Biol. 2009;579:221–246 [DOI] [PubMed] [Google Scholar]
- 22. Grunfeld F. ed. Langmuir-Blodgett Troughs, Operating Manual. 6th ed Coventry, UK: NIMA Technology Ltd; 2004 [Google Scholar]
- 23. Korchowiec B, Paluch M, Corvis Y, Rogalska E. A Langmuir film approach to elucidating interactions in lipid membranes: 1,2- dipalmitoyl-sn-glycero-3-phosphoethanolamine/cholesterol/metal cation systems. Chem Phys Lipids. 2006;144:127–136 [DOI] [PubMed] [Google Scholar]
- 24. Fischer FH, Wiederholt M. Human precorneal tear film pH measured by microelectrodes. Graefes Arch Clin Exp Ophthalmol. 1982;218:168–170 [DOI] [PubMed] [Google Scholar]
- 25. Terry JE, Hill RM. Human tear film osmotic pressure: diurnal variations and the closed eye. Arch Ophthalmol. 1978;96:120–123 [DOI] [PubMed] [Google Scholar]
- 26. Clop EM, Perillo MA. Langmuir films from human placental membranes: preparation, rheology, transfer to alkylated glasses, and sigmoidal kinetics of alkaline phosphatase in the resultant Langmuir-Blodgett film. Cell Biochem Biophys. 2010;56:91–107 [DOI] [PubMed] [Google Scholar]
- 27. Behroozi F. Theory of elasticity in two dimensions and its application to Langmuir-Blodgett films. Langmuir. 1996;12:2289–2291 [Google Scholar]
- 28. Cory CC, Hinks W, Burton JL, Shuster S. Meibomian gland secretion in the red eyes of rosacea. Br J Dermatol. 1973;89:25–27 [DOI] [PubMed] [Google Scholar]
- 29. Sullivan BD, Evans JE, Dana MR, Sullivan DA. Influence of aging on the polar and neutral lipid profiles in human meibomian gland secretions. Arch Ophthalmol. 2006;124:1286–1292 [DOI] [PubMed] [Google Scholar]
- 30. Langmuir I. The constitution and fundamental properties of solids and liquids. II. Liquids. J Am Chem Soc. 1917;39:1848–1906 [Google Scholar]
- 31. Michalski MC BP, da Silva AG, Saramago B. Topography of collapsed triglyceride monolayers on glass. Eur J Lipid Sci Technol. 2001;103:677–682 [Google Scholar]
- 32. Efron N, Young G, Brennan NA. Ocular surface temperature. Curr Eye Res. 1989;8:901–906 [PubMed] [Google Scholar]
- 33. Butovich IA, Wojtowicz JC, Molai M. Human tear film and meibum: very long chain wax esters and (O-acyl)-omega-hydroxy fatty acids of meibum. J Lipid Res. 2009;50:2471–2485 [DOI] [PMC free article] [PubMed] [Google Scholar]
- 34. Butovich IA. Cholesteryl esters as a depot for very long chain fatty acids in human meibum. J Lipid Res. 2009;50:501–513 [DOI] [PMC free article] [PubMed] [Google Scholar]
- 35. Teixeira AC, Brogueira P, Fernandes AC, Gonçalves da Silva AM. Phase behaviour of binary mixtures involving tristearin, stearyl stearate and stearic acid: thermodynamic study and BAM observation at the air-water interface and AFM analysis of LB films. Chem Phys Lipids. 2008;153:98–108 [DOI] [PubMed] [Google Scholar]
- 36. Burke LI, Patil GS, Panganamala RV, Geer JC, Cornwell DG. Surface areas of naturally occurring lipid classes and the quantitative microdetermination of lipids. J Lipid Res. 1973;14:9–15 [PubMed] [Google Scholar]
- 37. Smaby JM, Brockman HL. Thermodynamic equation of state for cholesteryl esters in surface phases. Biochemistry. 1984;23:3312–3317 [DOI] [PubMed] [Google Scholar]
- 38. Smaby JM, Baumann WJ, Brockman HL. Lipid structure and the behavior of cholesteryl esters in monolayer and bulk phases. J Lipid Res. 1979;20:789–795 [PubMed] [Google Scholar]
- 39. Docoslis A, Giese RF, van Oss CJ. Influence of the water-air interface on the apparent surface tension of aqueous solutions of hydrophilic solutes. Colloids Surf B: Biointerfaces. 2000;19:147–162 [Google Scholar]
- 40. Vieira VC, Severino D, Oliveira ON, Jr, et al. Langmuir films of petroleum at the air-water interface. Langmuir. 2009;25:12585–12590 [DOI] [PubMed] [Google Scholar]
- 41. Girard-Egrot AP, Blum LJ. Langmuir-Blodgett technique for synthesis of biomimetic lipid membranes. In: Martin D. ed. Fundamental Biomedical Tecnhologies.. New York: Springer Science; 2007:23–74 [Google Scholar]
- 42. Kaercher T, Hönig D, Möbius D. Brewster angle microscopy: a new method of visualizing the spreading of Meibomian lipids. Int Ophthalmol. 1994–1993; 17:341–348 [DOI] [PubMed] [Google Scholar]
- 43. Adam NK. The properties and molecular structure of thin films of palmitic acid on water. Part I. Proc Royal Soc Lond. 1921;99:336–351 [Google Scholar]
- 44. Petrov PG, Thompson JM, Rahman IB, et al. Two-dimensional order in mammalian pre-ocular tear film. Exp Eye Res. 2007;84:1140–1146 [DOI] [PubMed] [Google Scholar]
- 45. Schulman JH, Rideal EK. Molecular interaction in monolayers: I. complexes between large molecules. Proc Royal Soc London Ser B Biol Sci. 1937;122:29–45 [Google Scholar]
- 46. Haynie DT. Biological Thermodynamics. Cambridge, UK: Cambridge University Press; 2001:82–84 [Google Scholar]
- 47. Anderson TG, McConnell HM. Condensed complexes and the calorimetry of cholesterol-phospholipid bilayers. Biophys J. 2001;81:2774–2785 [DOI] [PMC free article] [PubMed] [Google Scholar]
- 48. Cantu L, Corti M, Brocca P, Del Favero E. Structural aspects of ganglioside-containing membranes. Biochim Biophys Acta. 2009;1788:202–208 [DOI] [PubMed] [Google Scholar]
- 49. Hill A. The possible effects of the aggregation of the molecules of hæmoglobin on its dissociation curves. J Physiol. 1910;22nd:i-vii [Google Scholar]
- 50. [Accessed September 20, 2010]. http://en.wikipedia.org/wiki/Hill_equation.
- 51. Geiser MH, Bonvin M, Quibel O. Corneal and retinal temperatures under various ambient conditions: a model and experimental approach. Klin Monbl Augenheilkd. 2004;221:311–314 [DOI] [PubMed] [Google Scholar]
- 52. McCulley JP, Shine W. A compositional based model for the tear film lipid layer. Trans Am Ophthalmol Soc. 1997;95:79–88, discussion 88–93 [PMC free article] [PubMed] [Google Scholar]
- 53. Leiske DK, Raju SR, Ketelson HA, Millar TJ, Fuller GGl. The interfacial viscoelastic properties and structures of human and animal Meibomian lipids. Exp Eye Res. 2010;90:598–604 [DOI] [PubMed] [Google Scholar]


