Rectangular (6° × 6°) test point arrangements in perimetry (e.g., grid 24-2 or grid 30-2) omit the immediate paracentral visual field region. Perimetry with regionally condensed stimulus arrangements reveals that glaucomatous visual field loss affects the superior paracentral area within an eccentricity of 3° in more than 50% of the eyes with predominantly mild to moderate glaucomatous visual field loss.
Abstract
Purpose.
To assess the spatial distribution of glaucomatous visual field defects (VFDs) obtained with regionally condensed stimulus arrangements.
Methods.
Sixty-three eyes of 63 glaucoma subjects were examined with threshold-estimating automated static perimetry (full threshold 4-2-1 dB strategy with at least three reversals) on an automatic campimeter or a full-field perimeter. Stimuli were added by the examiner to regionally enhance spatial resolution in regions that were suspicious for a glaucomatous VFD. These regions were characterized by contiguous local VFDs, attributable to the retinal nerve fiber bundle course according to the impression of the examiner. The added stimulus locations were subsets of a predefined, dense perimetric grid. All VFD locations with P < 0.05 (total deviation plots) were assessed by superimposing the visual field records of all participants.
Results.
Glaucomatous VFD loss occurred more frequently in the upper than in the lower hemifield, with a typical retinal nerve fiber-related pattern and a preference of the nasal step region. More than 50% of the eyes with predominantly mild to moderate glaucomatous field loss showed defective locations in the immediate superior paracentral region within an eccentricity of 3°.
Conclusions.
Conventional thresholding white-on-white perimetry with regionally enhanced spatial resolution reveals that glaucomatous visual field loss affects the immediate paracentral area, especially the upper hemifield, in many eyes with only mild to moderate glaucomatous visual field loss. Detailed knowledge about the spatial pattern and the local frequency distribution of glaucomatous VFDs is an essential prerequisite for creating regionally condensed stimulus arrangements for adequate detection and follow-up of functional glaucomatous damage.
Typical glaucomatous visual field loss is characterized by arcuate defects, nasal steps, and other patterns corresponding to the course of retinal nerve fibers that respect the nasal horizontal meridian and usually spare the visual field center.1–5 Damage to the immediate paracentral visual field, leading to a so-called split fixation, is usually understood as a sign of advanced loss in cases of end-stage glaucomatous damage.6
In conventional perimetry, rectangular test point arrangements with a spacing of 6° × 6° (e.g., grid 24-2 or 30-2) that omit the 6° central visual field regions are most frequently used and, therefore, lack detailed spatial information.
The aim of this study was to obtain a more detailed pattern and a spatial frequency distribution of glaucomatous visual field loss by using locally condensed stimulus arrangements in regions of manifest or suspected visual field loss.
Subjects and Methods
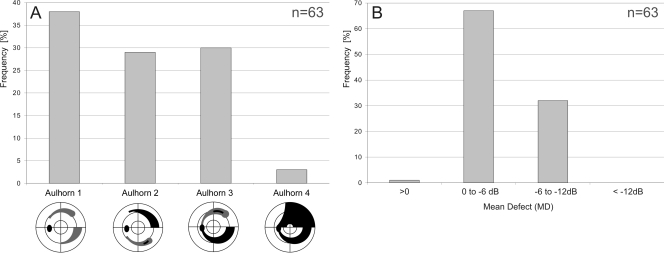
Sixty-three eyes of 63 glaucoma subjects (34 women, 29 men; age range, 33–79 years; mean defect (MD), −11.4 to +0.5 dB; Aulhorn stage 1, 24 eyes; Aulhorn stage 2, 18 eyes; Aulhorn stage 3, 19 eyes; Aulhorn stage 4, two eyes) were examined with automated static perimetry (full threshold 4-2-1 dB strategy with at least three reversals) on an automatic campimeter (Tuebingen Computer Campimeter [TCC]) or on a full-field perimeter (Octopus 101-Perimeter; Haag-Streit Inc., Koeniz, Switzerland).
Patients met the inclusion criteria for high-pressure open-angle glaucoma (n = 39, aged 35 years or older; typical signs of glaucomatous optic neuropathy or retinal nerve fiber loss and typical visual field loss with IOP ≥22 mm Hg) or low-tension glaucoma (n = 24; typical signs of glaucomatous optic neuropathy or retinal nerve fiber loss and typical visual field loss with IOP values <22 mm Hg at any time; best-corrected visual acuity had to be equal to or better than 10/20). Visual field defect (VFD) was defined as at least three non-edge test locations7,8 that had to be located within the superior/inferior hemifield9–11 and had to be depressed to the 5% probability level (P < 0.05), with at least one non-edge point depressed to the 1% probability level (P < 0.01), according to the pattern deviation plot.7
Exclusion criteria were relevant opacities of the central refractive media and ophthalmologic diseases other than glaucoma that might interfere with the visual field.
MD values, as determined with the initial test point arrangement, ranged from −11.4 to +0.5 dB. The frequency distribution of MD and of the visual field stages according to the classification system of Aulhorn and Karmeyer12 are shown in Figure 1. Sixty-two subjects had a best-corrected distant visual acuity above 10/20, and one subject had a visual acuity of 10/20. The study was approved by all local institutional review boards and adhered to the tenets of the Declaration of Helsinki.
Figure 1.
(A) Frequency distribution of the perimetric glaucoma stages of the 63 eyes of 63 patients according to the classification system of Aulhorn and Karmeyer.12 (B) Frequency distribution of the MD.
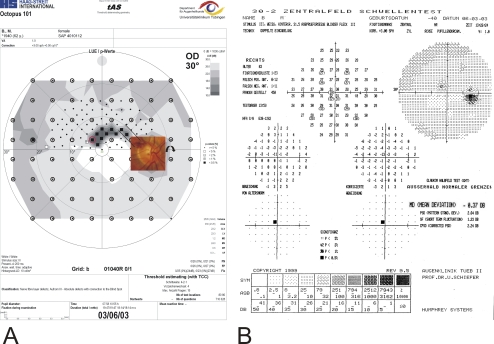
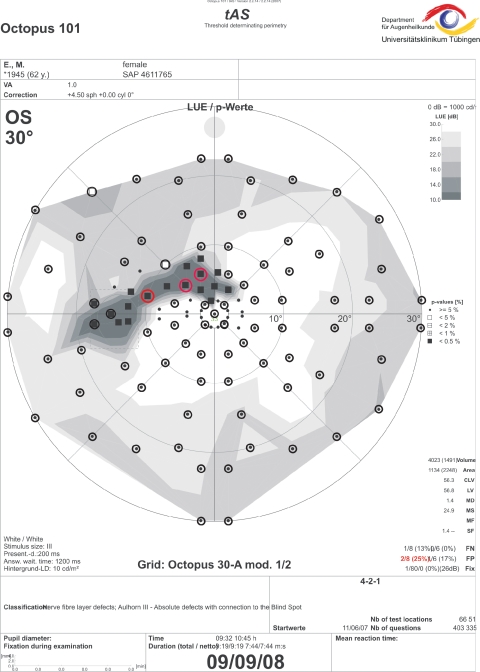
Visual fields were initially assessed with automated static perimetry (full-threshold 4-2-1 dB strategy with at least 3 reversals) on the TCC with a 6° × 6° rectangular grid (77 test locations; Fig. 2A) or on the full-field perimeter (Octopus 101-Perimeter; Haag-Streit Inc.) on the 30-A grid (comprising 83 test locations in a polar arrangement within the 30° visual field that respected the horizontal and vertical meridians and that were more condensed toward the visual field center; Fig. 3). In subsequent sessions, the operator added stimuli in suspicious regions around the VFD to enhance the spatial resolution within these areas. Suspicious regions were defined as a cluster of at least three non-edge test locations that were suspicious for a glaucomatous VFD.7,13 They had to be located within the superior/inferior hemifield10,11 and had to be depressed to the 5% probability level (P < 0.05), with at least one non-edge point depressed to the 1% probability level (P < 0.01), according to the pattern deviation plot.7 One physician (US) demarcated the region of test point condensation with the help of a lasso tool. The line was placed around the cluster of pathologic visual field locations. This procedure is now automated in the most recent version of the condensation procedure (see Discussion).
Figure 2.
(A) Threshold-estimating static perimetry with regional stimulus condensation in the superior paracentral visual field clearly demarcates a circumscribed paracentral small retinal nerve fiber–related scotoma corresponding to a previous splinter hemorrhage shown in the (inset) optic disc photograph (the optic disc is turned upside down). Circles: rectangular 6° × 6° grid. (B) In the corresponding Humphrey 30-2 visual field, only one pathologic location was detected within the paracentral nasal superior quadrant.
Figure 3.
Threshold-estimating static perimetry with regional stimulus condensation in the superior paracentral visual field clearly demarcates a circumscribed paracentral small retinal nerve fiber-related scotoma. Circles: 30-A grid with polar test point arrangement. Only three pathologic locations were detected without condensed stimulus arrangement (red circles).
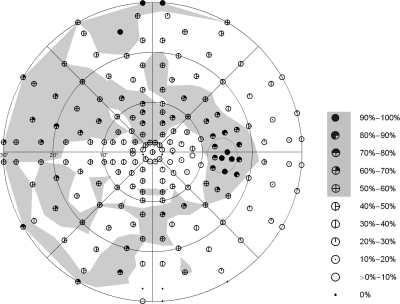
The added stimulus locations were subsets of a predefined, dense, perimetric grid (total of 191 locations within the 30° field) in a polar arrangement (Fig. 4). The stimulus locations respected the horizontal and vertical meridians and were more condensed toward the visual field center.
Figure 4.
Spatial frequency distributions of all glaucomatous visual field defects with P < 0.05, according to the individual total deviation plots. This result was assessed by electronically superimposing the visual field records of all participants. Local frequency values in which more than 50% of the eyes showed P < 0.05 are shaded in light gray to highlight the pattern distribution of glaucomatous visual field loss in the upper and lower hemifields.
The visual field results from the left eye format were converted into right eye format. Spatial frequency distributions of all visual field defect locations with P < 0.05, according to the total deviation plots, were summed across all participants to determine the percentage of eyes with a VFD at each location.
Results
As expected, maximum spatial frequency counts (above 90%) occurred in the blind spot area and in the upper rim region of the visual field, exceeding 25° of eccentricity (Fig. 4). Areas with local frequency values that exceeded 50% were shaded in gray for better visibility. In general, the area and extent of areas shaded in gray were greater in the upper than in the lower hemifield. Locations exceeding a local frequency of 50% occurred in the upper and lower hemifield, following an arcuate retinal nerve fiber–related pattern, with a regional preference of the (upper) nasal quadrant/nasal step. Areas with a local frequency exceeding 50% spared the lower paracentral hemifield and clearly involved its counterpart in the upper paracentral region; more than 50% of the eyes showed defective locations in the immediate superior paracentral region within an eccentricity of 3°. Locations within the temporal quadrant were rarely involved.
Two typical clinical findings with regionally enhanced test point condensation are demonstrated in Figures 2 and 3. The field record with the regionally condensed grid shows a deep circumscribed arcuate defect with connection to the blind spot area that affects the immediate superior paracentral region. The defect in Figure 2 was classified as Aulhorn stage 312 with the condensed test grid. Results of conventional thresholding perimetry, based on a rectangular 6° × 6° test point arrangement, would have been classified as Aulhorn stage 1 and classified as “early” (MD −0.37 dB) according to the classification system of Hodapp et al.14 or its more recent modification according to the classification system of Mills et al.15 Similarly, the example in Figure 3 shows a glaucomatous scotoma staged as Aulhorn 3 with the condensed grid and a scotoma staged as Aulhorn 2 with the original grid 30-A (polar test point arrangement).
Discussion
Previous pattern analyses based on rectangular grids primarily described the arcuate pattern of the field loss and the loss in the nasal horizontal meridian (nasal step).2,3,14–24 Thus far, only a few studies have analyzed glaucomatous scotoma patterns with spatially high-resolution stimulus arrangements.25–30 Previous pattern analyses based on static perimetry with enhanced test point density referred to the results of supraliminal static perimetry and, therefore, might have overlooked shallow visual field defects.31 Other results with a polar test point arrangement, similar to the one applied in this study, have already demonstrated that glaucomatous visual field loss occurs preferentially in the upper hemifield and affects the paracentral regions in a considerable number of cases.1,2,19,32–37
We chose to grade the severity of glaucomatous field loss according to the classification system of Aulhorn and Karmeyer12 because it primarily considered scotoma shape and extent. Scoring systems such as the Hodapp et al.14 algorithm and its modification by Mills et al.15 could not be applied in this case because these are based on rectangular test point arrangements. Glaucomatous visual field loss approaching the visual field center in only one hemifield is also called split fixation6 and has to be rated as a serious event or an impairment. Paracentral regions of the retina are used for reading38–42 and numerous activities of daily living, such as driving and other steering, monitoring, or surveillance tasks.43–49 Involvement of the paracentral region, especially in case of local overlap of binocular visual field defects, is often accompanied by serious impairment of quality of life.35,42,45,46,48,50–53 Deva et al.54 found a paracentral visual field defect in 56% of their 107 glaucoma patients, however, applying a 24-2 grid.
Threshold assessment in perimetry is characterized by an unstable outcome with regard to defect depth. Even in normal visual field areas, variations approaching 3 dB (factor of 0.5–2.0 with regard to the local luminance value) are rated as stable.55–57 This critically interferes with detection of change in follow-up analyses and can be only partially fixed by repeated perimetric sessions at baseline and follow-up. In contrast, we are not aware of any study demonstrating fluctuations of that magnitude with regard to defect size in glaucomatous visual field loss.
Local enhancement of test point condensation is not only an option for more exact delineation of the present scotoma pattern, it may also provide the information needed to detect progression earlier than can be detected with conventional perimetric grids.58,59
A method for a computer-based, automated condensation of test locations (autoSCOPE [automated SCotoma-Oriented Perimetry]) has recently been developed and was presented at the 2010 meeting of the Imaging and Perimetric Society (Dietzsch J, et al. autoSCOPE: an algorithm for automated regional condensation of stimulus density for polar and rectangular perimetric grids).
In conclusion, conventional thresholding perimetry with enhanced spatial resolution reveals that glaucomatous visual field loss affects the immediate pericentral area, especially the upper hemifield, in many eyes with only mild to moderate glaucomatous visual field loss. Detailed knowledge about the spatial pattern and the local frequency distribution of glaucomatous visual field defects is an essential prerequisite for creating regionally condensed stimulus arrangements for adequate detection and follow-up of functional glaucomatous damage.
Footnotes
Supported by National Eye Institute Grant EY08208 (PAS, US).
Disclosure: U. Schiefer, Haag-Streit (C, P); E. Papageorgiou, None; P.A. Sample, Haag-Streit, (C) Carl Zeiss-MediTech (C), Welch Allen (C); J.P. Pascual, None; B. Selig, Haag-Streit (F); E. Krapp, Haag-Streit (F); J. Paetzold, Haag-Streit (F)
References
- 1. Sihota R, Gupta V, Tuli D, et al. Classifying patterns of localized glaucomatous visual field defects on automated perimetry. J Glaucoma. 2007;16:146–152 [DOI] [PubMed] [Google Scholar]
- 2. Lau LI, Liu CJ, Chou JC, Hsu WM, Liu JHK. Patterns of visual field defects in chronic angle-closure glaucoma with different disease severity. Ophthalmology. 2003;110:1890–1894 [DOI] [PubMed] [Google Scholar]
- 3. Hoffmann EM, Boden C, Zangwill LM, et al. Inter-eye comparison of patterns of visual field loss in patients with glaucomatous optic neuropathy. Am J Ophthalmol. 2006;141:703–708 [DOI] [PubMed] [Google Scholar]
- 4. Sample PA, Chan K, Boden C, et al. Using unsupervised learning with variational Bayesian mixture of factor analysis to identify patterns of glaucomatous visual field defects. Invest Ophthalmol Vis Sci. 2004;45:2596–2605 [DOI] [PMC free article] [PubMed] [Google Scholar]
- 5. Goldbaum MH, Sample PA, Zhang Z, et al. Using unsupervised learning with independent component analysis to identify patterns of glaucomatous visual field defects. Invest Ophthalmol Vis Sci. 2005;46:3676–3683 [DOI] [PMC free article] [PubMed] [Google Scholar]
- 6. Kolker AE. Visual prognosis in advanced glaucoma: a comparison of medical and surgical therapy for retention of vision in 101 eyes with advanced glaucoma. Trans Am Ophthalmol Soc. 1977;75:539–555 [PMC free article] [PubMed] [Google Scholar]
- 7. Katz J, Sommer A, Gaasterland DE, Anderson DR. Comparison of analytic algorithms for detecting glaucomatous visual field loss. Arch Ophthalmol. 1991;109:1684–1689 [DOI] [PubMed] [Google Scholar]
- 8. European Glaucoma Society Terminology and Guidelines for Glaucoma. 2nd ed Savona: Editrice Dogma; 2008 [Google Scholar]
- 9. Asman P, Heijl A. Glaucoma hemifield test: automated visual field evaluation. Arch Ophthalmol. 1992;110:812–819 [DOI] [PubMed] [Google Scholar]
- 10. Chauhan BC, LeBlanc RP, Nicolela MT; Canadian Glaucoma Study Group Canadian Glaucoma Study, 1: study design, baseline characteristics, and preliminary analyses. Can J Ophthalmol. 2006;41:566–575 [DOI] [PubMed] [Google Scholar]
- 11. CNTG study group Comparison of glaucomatous progression between untreated patients with normal-tension glaucoma and patients with therapeutically reduced intraocular pressures: Collaborative Normal-Tension Glaucoma Study Group. Am J Ophthalmol. 1998;126:487–497 [DOI] [PubMed] [Google Scholar]
- 12. Aulhorn E, Karmeyer H. Frequency distribution in early glaucomatous visual field defects. Doc Ophthalmol Proc Series. 1977;14:75–83 [Google Scholar]
- 13. European Glaucoma Society Terminology and Guidelines for Glaucoma. 3nd ed Savona: Editrice Dogma; 2009 [Google Scholar]
- 14. Hodapp E, Parrish RU, Anderson DR. Classification of glaucomatous field loss by HFA. In: Hodapp E, et al., eds. Clinical Decisions in Glaucoma. St. Louis: CV Mosby; 1993:52–61 [Google Scholar]
- 15. Mills RP, Budenz DL, Lee PP, et al. Categorizing the stage of glaucoma from pre-diagnosis to end-stage disease. Am J Ophthalmol. 2006;141:24–30 [DOI] [PubMed] [Google Scholar]
- 16. Hoffmann EM, Medeiros FA, Sample PA, et al. Relationship between patterns of visual field loss and retinal nerve fiber layer thickness measurements. Am J Ophthalmol. 2006;141:463–471 [DOI] [PubMed] [Google Scholar]
- 17. Airaksinen PJ, Drance SM, Douglas GR, Schulzer M, Wijsman K. Visual field and retinal nerve fiber layer comparisons in glaucoma. Arch Ophthalmol. 1985;103:205–207 [DOI] [PubMed] [Google Scholar]
- 18. Lee AJ, Wang JJ, Rochtchina E, et al. Patterns of glaucomatous visual field defects in an older population: the Blue Mountains Eye Study. Clin Exp Ophthalmol. 2003;31:331–335 [DOI] [PubMed] [Google Scholar]
- 19. Keltner JL, Johnson CA, Cello KE, et al. Classification of visual field abnormalities in the ocular hypertension treatment study. Arch Ophthalmol. 2003;121:643–650 [DOI] [PubMed] [Google Scholar]
- 20. Kitazawa Y, Yamamoto T. Glaucomatous visual field defects: their characteristics and how to detect them. Clin Neurosci. 1997;4:279–283 [PubMed] [Google Scholar]
- 21. Damms T, Dannheim F, Dannheim D. Visual field indices for the nasal step: different calculation procedures and their correlation with the clinical classification of visual field defects. Eur J Ophthalmol. 1993;3:21–25 [DOI] [PubMed] [Google Scholar]
- 22. Werner EB, Beraskow J. Peripheral nasal field defects in glaucoma. Ophthalmology. 1979;86:1875–1878 [DOI] [PubMed] [Google Scholar]
- 23. Zingirian M, Calabria G, Gandolfo E. The nasal step in normal and glaucomatous visual fields. Can J Ophthalmol. 1979;14:88–94 [PubMed] [Google Scholar]
- 24. Rönne HKT. Über das Gesichtsfeld beim Glaukom. Klin Monatsbl Augenheilkd. 1909;47:12–33 [Google Scholar]
- 25. Haeberlin H, Fankhauser F. Adaptive programs for analysis of the visual field by automatic perimetry—basic problems and solutions: efforts oriented towards the realisation of the generalised spatially adaptive Octopus program SAPRO. Doc Ophthalmol. 1980;50:123–141 [DOI] [PubMed] [Google Scholar]
- 26. Fankhauser F, Funkhouser A, Kwasniewska S. Advantages and limitations of the spatially adaptive program SAPRO in clinical perimetry. Int Ophthalmol. 1986;9:179–189 [DOI] [PubMed] [Google Scholar]
- 27. Fankhauser F, Funkhouser A, Kwasniewska S. Evaluating the applications of the spatially adaptive program (SAPRO) in clinical perimetry, I. Ophthalmic Surg. 1986;17:338–342 [PubMed] [Google Scholar]
- 28. Fankhauser F, Funkhouser A, Kwasniewska S. Evaluating the applications of the spatially adaptive program (SAPRO) in clinical perimetry, II. Ophthalmic Surg. 1986;17:415–428 [PubMed] [Google Scholar]
- 29. Westcott MC, Garway-Heath DF, Fitzke FW, Kamal D, Hitchings RA. Use of high spatial resolution perimetry to identify scotomata not apparent with conventional perimetry in the nasal field of glaucomatous subjects. Br J Ophthalmol. 2002;86:761–766 [DOI] [PMC free article] [PubMed] [Google Scholar]
- 30. Kaiser HJ, Flammer J, Bucher PJ, et al. High-resolution perimetry of the central visual field. Ophthalmologica. 1994;208:10–14 [DOI] [PubMed] [Google Scholar]
- 31. Aulhorn E, Durst W. Rasterperimetrie in der augenarztlichen Praxis. Fortschr Ophthalmol. 1982;79:350–353 [PubMed] [Google Scholar]
- 32. Airaksinen PJ, Heijl A. Visual field and retinal nerve fibre layer in early glaucoma after optic disc haemorrhage. Acta Ophthalmol Copenh. 1983;61:186–194 [DOI] [PubMed] [Google Scholar]
- 33. Gaasterland DE. Advanced glaucoma intervention study. Ophthalmology. 1994;101:1445–1455 [PubMed] [Google Scholar]
- 34. Jürgens C, Koch T, Burth R, Schiefer U, Zell A. Skotomklassifizierung mit künstlichen neuronalen Netzwerken. Ophthalmologe. 2001;(suppl 1):83 [Google Scholar]
- 35. Ramrattan RS, Wolfs RC, Panda-Jonas S, et al. Prevalence and causes of visual field loss in the elderly and associations with impairment in daily functioning: the Rotterdam Study. Arch Ophthalmol. 2001;119:1788–1794 [DOI] [PubMed] [Google Scholar]
- 36. Flammer J, Pache M, Resink T. Vasospasm, its role in the pathogenesis of diseases with particular reference to the eye. Prog Retin Eye Res. 2001;20:319–349 [DOI] [PubMed] [Google Scholar]
- 37. Sample PA, Goldbaum MH, Chan K, et al. Using machine learning classifiers to identify glaucomatous change earlier in standard visual fields. Invest Ophthalmol Vis Sci. 2002;43:2660–2665 [PubMed] [Google Scholar]
- 38. Aulhorn E. Über Fixationsbreite und Fixationsfrequenz beim Lesen gerichteter Konturen. Pflugers Arch. 1953;257:318–328 [DOI] [PubMed] [Google Scholar]
- 39. McDonald SA, Spitsyna G, Shillcock RC, Wise RJ, Leff AP. Patients with hemianopic alexia adopt an inefficient eye movement strategy when reading text. Brain. 2006;129:158–167 [DOI] [PubMed] [Google Scholar]
- 40. Trauzettel-Klosinski S, Teschner C, Tornow R-P, Zrenner E. Reading strategies in normal subjects and in patients with macular scotoma-assessed by two new methods of resistration. Neuro-Ophthalmology. 1994;14:15–30 [Google Scholar]
- 41. Trauzettel-Klosinski S. The significance of the central visual field for reading ability and the value of perimetry for its assessment. In: Wall M, Heijl A. eds. Perimetry Update 1996/1997. Amsterdam/New York: Kugler; 1997:417–426 [Google Scholar]
- 42. Trauzettel-Klosinski S, Reinhard J. The vertical field border in hemianopia and its significance for fixation and reading. Invest Ophthalmol Vis Sci. 1998;39:2177–2186 [PubMed] [Google Scholar]
- 43. Haymes SA, LeBlanc RP, Nicolela MT, Chiasson LA, Chauhan BC. Risk of falls and motor vehicle collisions in glaucoma. Invest Ophthalmol Vis Sci. 2007;48:1149–1155 [DOI] [PubMed] [Google Scholar]
- 44. Owsley C, McGwin G., Jr Vision impairment and driving. Surv Ophthalmol. 1999;43:535–550 [DOI] [PubMed] [Google Scholar]
- 45. Skalicky S, Goldberg I. Depression and quality of life in patients with glaucoma: a cross-sectional analysis using the Geriatric Depression Scale-15, assessment of function related to vision, and the Glaucoma Quality of Life-15. J Glaucoma. 2008;17:546–551 [DOI] [PubMed] [Google Scholar]
- 46. Adler G, Bauer MJ, Rottunda S, Kuskowski M. Driving habits and patterns in older men with glaucoma. Soc Work Health Care. 2005;40:75–87 [DOI] [PubMed] [Google Scholar]
- 47. Chisholm CM, Rauscher FG, Crabb DC, et al. Assessing visual fields for driving in patients with paracentral scotomata. Br J Ophthalmol. 2007;92:225–230 [DOI] [PubMed] [Google Scholar]
- 48. Haymes SA, LeBlanc RP, Nicolela MT, Chiasson LA, Chauhan BC. Glaucoma and on-road driving performance. Invest Ophthalmol Vis Sci. 2008;49:3035–3041 [DOI] [PubMed] [Google Scholar]
- 49. Szlyk JP, Mahler CL, Seiple W, Edward DP, Wilensky JT. Driving performance of glaucoma patients correlates with peripheral visual field loss. J Glaucoma. 2005;14:145–150 [DOI] [PubMed] [Google Scholar]
- 50. Viswanathan AC, Crabb DP, Fitzke FW, Hitchings RA. Prevalence and characteristics of central binocular visual field defects in patients attending a glaucoma perimetry service. In: Wall M, Mills RP. eds. Perimetry Update 2002/2003. The Hague, The Netherlands: Kugler Publications; 2003:83–85 [Google Scholar]
- 51. Crabb DP, Viswanathan AC. Integrated visual fields: a new approach to measuring the binocular field of view and visual disability. Graefes Arch Clin Exp Ophthalmol. 2005;243:210–216 [DOI] [PubMed] [Google Scholar]
- 52. Aspinall PA, Johnson ZK, Azuara-Blanco A, et al. Evaluation of quality of life and priorities of patients with glaucoma. Invest Ophthalmol Vis Sci. 2008;49:1907–1915 [DOI] [PubMed] [Google Scholar]
- 53. McGwin G, Jr, Xie A, Mays A, et al. Visual field defects and the risk of motor vehicle collisions among patients with glaucoma. Invest Ophthalmol Vis Sci. 2005;46:4437–4441 [DOI] [PubMed] [Google Scholar]
- 54. Deva NC, Insull E, Gamble G, Danesh-Meyer HV. Risk factors for first presentation of glaucoma with significant visual field loss. Clin Exp Ophthalmol. 2008;36:217–221 [DOI] [PubMed] [Google Scholar]
- 55. Jampel HD, Vitale S, Ding Y, et al. Test-retest variability in structural and functional parameters of glaucoma damage in the glaucoma imaging longitudinal study. J Glaucoma. 2006;15:152–157 [DOI] [PubMed] [Google Scholar]
- 56. Blumenthal EZ, Sample PA, Berry CC, et al. Evaluating several sources of variability for standard and SWAP visual fields in glaucoma patients, suspects, and normals. Ophthalmology. 2003;110:1895–1902 [DOI] [PubMed] [Google Scholar]
- 57. Heijl A, Lindgren A, Lindgren G. Test-retest variability in glaucomatous visual fields. Am J Ophthalmol. 1989;108:130–135 [DOI] [PubMed] [Google Scholar]
- 58. Nevalainen J, Paetzold J, Papageorgiou E, et al. Specification of progression in glaucomatous visual field loss, applying locally condensed stimulus arrangements. Graefes Arch Clin Exp Ophthalmol. 2009;247:1659–1669 [DOI] [PMC free article] [PubMed] [Google Scholar]
- 59. Schiefer U, Flad M, Stumpp F, et al. Increased detection rate of glaucomatous visual field damage with locally condensed grids: a comparison between fundus-oriented perimetry and conventional visual field examination. Arch Ophthalmol. 2003;121:458–465 [DOI] [PubMed] [Google Scholar]


