Discovery of new heritable phenotypes aids gene discovery by enriching a group of subjects for that phenotype. The authors have succeeded in automating this thus far largely intuitive process and have discovered complex phenotypes in color images of the optic nerve head.
Abstract
Purpose.
Discovery and description of heritable optic nerve head (ONH) phenotypes have been haphazard. In this preliminary study, the authors test the hypothesis that inheritable phenotypes can be discovered and quantified computationally by estimating three-dimensional ONH shape parameters from stereo color photographs from the Twins Eye Study in Tasmania and determining how much of the variability in ONH shape is accounted for by genetic influence.
Methods.
Three-dimensional ONH shape was estimated by an automated algorithm from stereoscopic optic disc color photographs of a random sample of 172 subjects (344 eyes, 45 pairs of monozygotic [MZ] and 41 dizygotic [DZ] twins). Shape resemblances between eyes were quantified with a distance metric. The heritability of the shape resemblance was determined both through the distribution of the discongruence indices and through structural equation modeling techniques (ACE model).
Results.
Significantly different discongruence indices were found for MZ (1.0286; 95% CI, 0.9872–1.0701) and DZ twins (1.4218; 95% CI, 1.2631–1.5804); larger indices for DZ twins indicated that variability was substantially determined by genetic factors. The standardized variances of the A(dditive genetic), C(ommon environmental), and (nonshared) E(nvironmental) components were 0.80, 2.00 × 10⁻¹⁵ and 0.20, respectively, for all OD, and 0.79, 3.24 × 10⁻¹⁴, and 0.21 for all OS.
Conclusions.
This preliminary study shows that quantitative phenotyping of the ONH shape from color images leads to phenotypes that can be measured and are largely under genetic control. The association of these inherited phenotypes with genotypes deserves confirmation and further study.
Discovery of new phenotypes aids gene discovery by enriching a group of subjects for that phenotype. Images may contain complex phenotypes that are difficult to determine and quantify for human experts. The optic nerve head (ONH), where the retinal nerve fibers leave the eye to start their path in the optic nerve to the brain, plays a central role in glaucoma. Recent evidence has suggested that its morphology, especially its diameter (disc size), as well as its general shape forms phenotypes that are heritable.1,2 These ONH phenotypes were determined qualitatively in the form of an intuitive Gestalt by human experts and did not allow measurement and quantification.
Glaucoma is the second leading cause of irreversible blindness in the world.3 Several genes, including MYOC, encoding myocilin,4,5 OPTN, encoding optineurin,6 and the primary congenital glaucoma gene cytochrome P450 1B1 (CYP1B1),7 have been discovered that play a role in the risk for and progression of this disease.4,8 However, the risks attributed to the genes discovered thus far are moderate to small; therefore, the search for additional genes is ongoing. Abnormalities in the shape of the ONH play an essential role in the diagnosis and management of glaucoma. Because the ONH varies substantially between subjects without glaucoma, separating normal variation from glaucomatous change is a challenge.9
Unraveling of the genetic factors, if any, that contribute to the shape of the ONH is, therefore, of dual significance: it can help differentiate between the normal and the abnormal ONH and can assist in the discovery of new genes related to glaucoma.
Classic twins studies compare the correlation and covariance of phenotypes within monozygotic (MZ) twins to those within dizygotic (DZ) twins and estimate the heritability of a trait by disentangling the sharing of genes and environments.10 Phenotypic variability may be attributed to genetic and environmental control using structural equation modeling, also known as the ACE model, for additive genetic effects (A), shared environmental effects (C), and nonshared environmental effects (E).11 Maximum likelihood estimates of these effects determine what proportion of variance in the trait is heritable compared with that attributable to environmental elements.12
Optical coherence tomography (OCT) has recently become the method of choice for imaging the three-dimensional shape of the ONH.13 OCT-based ONH phenotypes would thus be the obvious choice for determining genetic and environmental factors that determine ONH shape. A single horizontal scan of anterior segment optical coherence tomography was collected in the Guangzhou Twin Eye Study to estimate the heritability of the iridotrabecular angle width.14 Unfortunately, it may take years before a sufficient number of three-dimensional OCT data can be obtained from twins to perform twin studies. However, a plethora of stereo color images of the optic disc in twin studies has been collected in the past.15 If we are able to quantify ONH shape from these stereo images, classic twin studies of ONH shape become achievable.
We have previously developed and tested methods to estimate three-dimensional measures of ONH shape from stereo color photographs.16 Stereoscopic optic disc photographs encode the three-dimensional shape of the ONH as disparities between pixel correspondences.17 Shape descriptions using these disparities provide comprehensive information of the underlying structure compared with two-dimensional measurements. Subtle ONH properties, such as neuroretinal rim slope and curvature of the retinal nerve fiber layer (RNFL), which may have significance in assessment of the phenotype, cannot be adequately described by two-dimensional parameters. Therefore, three-dimensional measures of the topography are essential to improve the discriminatory power of computerized ONH analysis.
The purpose of this study was, therefore, to investigate whether we can estimate three-dimensional ONH shape parameters from stereo color photographs from a well-known twin study15 and whether some of the shape parameters are under genetic control and, if so, how much of the variability is accounted for by genetic influence.
Methods
Data Collection
In this preliminary study, a random sample of MZ and DZ twins were selected from the Twins Eye Study in Tasmania (TEST), whose subjects were originally recruited from the general population through the Australian twin registry.2 The relevant ethics committees of the University of Tasmania and the Royal Victorian Eye and Ear Hospital approved the study, and the protocol adhered to the tenets of the Declaration of Helsinki. The Institutional Review Board of the University of Iowa approved the analysis of the deidentified images, and a waiver of consent was granted. Each subject or his or her respective legal guardian provided written informed consent before participation.15 Zygosity of all twin pairs was confirmed by DNA analysis with polymorphic microsatellite markers. According to the models developed by Nyholt,18 the genotyping protocol falsely classifies a DZ pair as MZ in 1 of 4907 cases.2
Simultaneous stereoscopic optic disc photographs were obtained from both eyes of recruited twins with a fundus camera (3-Dx/F; Nidek, Gamagori, Japan) on 35-mm slide film (Ektachrome; Eastman Kodak, Melbourne, Australia). All identifying information was removed from each stereoscopic photograph before further processing. The slide films for these subjects were digitized at 4096 × 4096 pixels using a scanner (Coolpix; Nikon, Tokyo, Japan), and copies of the slides were sent to Iowa. Left and right stereo images were resampled and cropped to 512 × 512 pixels by locating the optic disc in its entirety in all images.19
ONH Shape Estimate from Stereoscopic Photographs
ONH shape was estimated from stereoscopic color photographs of the optic disc by finding dense correspondences between image pairs with our stereo correspondence algorithm.16 The horizontal disparities between these correspondences form a disparity map relative to the reference image, which contains shape information of the ONH.20
Our approach used a variable-scale Gaussian kernel to extract stereo pairs at different scales. At each scale, certain features were selected as the salient ones with a simplified and specified descriptions.21 Both the metrics of the pixel features and the metrics for the matching correspondences are described in scale space. Pixel features are extracted by encoding the intensity of the reference pixel and its context (i.e., the intensity variations relative to its surroundings and information collected from its neighborhood), using filter banks.19,22,23 The result is a multiscale pixel feature vector.
A matching score formulates the stereo correspondence problem as the estimation of a continuous scale space evolution of disparity maps so that the paths through which different structures of the retinal surface evolve across scales interact with each other and provide globally coherent disparity estimates. This multiscale approach provided robust estimates of the disparity map in the presence of spatially varying reflectance, limited illumination, noise, and low-contrast or density of the features, which are commonly observed in stereoscopic optic disc photographs. Its efficacy was verified quantitatively by comparing results with depth information obtained from spectral domain optical coherence tomography (SD-OCT) images.24,25 The representation of the three-dimensional structure of the ONH as a disparity map made objective quantification of its three-dimensional shape possible.
Appearance-Based Feature Selection
In a preprocessing stage, the 512 × 512 disparity maps were aligned according to the position of the optic disc and cropped to 361 × 361 pixels to exclude edge effects. Left eye (OS) maps were flipped to match right eye (OD) maps for shape comparison and then were smoothed by a 2D Gaussian filter and down sampled to 40 × 40 pixels.
Principal component analysis (PCA) was applied to project the 40 × 40 dimensional image space of disparity maps to a reduced 1 × N dimensional feature space.26 Disparity maps were first normalized to have zero mean and unit variance, and the projection was then chosen to maximize the “scatter” of all disparity maps in the reduced feature space, represented as a linear transformation matrix with orthonormal columns. These columns, which we call eigen-disparity maps, are the set of eigenvectors corresponding to the N largest eigenvalues of the covariance matrix of all disparity maps. The eigen-disparity maps can also be seen as the primary features or characteristics of the ONH map, expressing such features as, for example, temporal versus nasal prominence of the ONH. New N-dimensional feature vectors were formed accordingly by projection of each disparity map through the transformation matrix.
Discrepancy Index: ONH Shape Variation between Twin Pairs
Thus, we had an adequate estimate of the ONH shape for each eye of each subject of each twin, in multiple dimensions, as given by the first N components. The next step was to determine whether there was a discrepancy in the shape between eyes and, if so, whether this discrepancy was larger, on average, between DZ than between MZ twins.
We computed the Euclidean distance between feature vectors, d(I1,I2), to provide a quantitative assessment of the resemblance of two disparity maps, I1 and I2. Given the distance of the ONH shape between any two disparity maps d(I1,I2), a discrepancy index between a pair of twins is then calculated to indicate their resemblance in terms of ONH shape.
Imagine a pair of twins, subjects A and B. ONH disparity maps estimated from OS and OD stereoscopic photographs of both subjects are denoted as AOS, AOD and BOS, BOD, respectively. The discrepancy index between the twin pair D(A,B) is then defined as the ratio of the average inter-twin distances to the intra-twin distances of the four involved disparity maps:
Inter-twin distances refer to the ONH shape differences between eyes of different subjects, and intra-twin distances refer to the differences between both eyes of the same subject. Thus, the phenotype of the eyes of two subjects with shared genetic influences is compared with the eyes of the same subject with shared genetic and environmental influences. If the shape of the ONH is primarily genetically determined and eye laterality is relatively less important in ONH embryogenesis, the inter-twin distances on the numerator should not be larger than the intra-twin distances on the denominator in cases of MZ twins because they share 100% of their genes. Any dissimilarity between the members of a MZ twin pair provides evidence for nonshared environmental influences. DZ twins share only 50% of their genes but are usually more similar than expected from this genetic basis because of shared environmental factors.27 On the other hand, if we take account of the measurement error and the existence of nonshared environmental factors, both MZ and DZ correlations may have the tendency to decrease proportionally from their population values.12 Thus, if ONH shape is at least partially under genetic influence, MZ twins are expected to have a discrepancy index close to 1, with a narrow distribution, whereas DZ twins are expected to have a discrepancy index larger than 1 with a wider distribution.
Structural Equation Modeling
We have described our method to determine whether ONH shape is (partially) under genetic control. As an independent confirmation of this analysis and to assess how much of the ONH shape variability is explained by genetic (vs. environmental) effects, we determined the distance between each disparity map and the mean shape to perform structural equation modeling (SEM). Thus, effects could be separated into additive genetic effects (A), shared environmental effects (C), and nonshared environmental effects (E).11 SEM has the ability to construct these latent variables by explicitly capturing measurement error in the model and allowing the structural relations between latent variables to be accurately estimated.28
In the ACE model, additive genetic effects result from additively combined influences of multiple genes.27 Environmental effects are assumed to be independent of a person's genotype. The correlations reflecting the similarity of MZ and DZ twins were calculated and expressed in terms of the A, C, and E components of the model.12 We used the OpenMx package for R language,29 which is widely used to maximize the likelihood estimates of components over the entire sample that best reproduce the observed variance-covariance matrices for the MZ and DZ twins.27 In practice, positive correlations for MZ and DZ twins are predicted by the ACE model. Specifically, the DZ correlation is expected to be half the MZ correlation if it fits a pure AE model without any shared environmental influences (C) and to be the same if it fits a pure CE model without any additive genetic influences (A).12
We chose the OD images for all twins for ACE analysis. In addition, we repeated the analysis for the OS images for all twins to verify these results because some genetic effects could operate on right and left eyes differently.30
Results
Quantification of the ONH Shape from Stereo Fundus Images
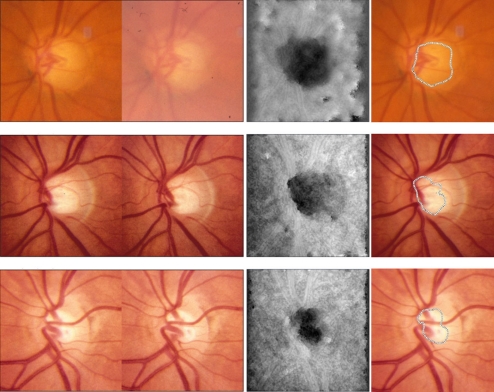
A sample of 86 pairs of twins (172 subjects) was selected at random from the TEST data set; 90 subjects were MZ twins and 82 were DZ twins. The mean age of the twins in the sample was 31.4 ± 10.8 years (range, 15–50 years). Three hundred forty-four disparity maps for 344 eyes were produced from 688 stereo fundus images at the same dimension (512 × 512 pixels) by our automated stereo correspondence algorithm16 and were analyzed, estimating the ONH shape of both eyes from 172 subjects (Fig. 1).
Figure 1.
Three pairs of stereoscopic optic disc photographs and their disparity maps produced by our multiscale stereo correspondence algorithm. The disparity of each pixel is shown as an intensity value in the disparity map (third column), in which darker pixel represents greater distance of the point to the camera. Shape features of the ONH are encoded in disparity maps without distractions from vascular features. One of the contour lines of the disparity map was superimposed on the reference (left) image (far right column) to delineate the bottom part of the estimated cupping. Accuracy can be verified by binocular fusion of the stereoscopic photographs (first two columns) by holding the page at approximately 30 cm (12 inches) from the eye and gazing into infinity.
Principal Components of ONH Shape Variation
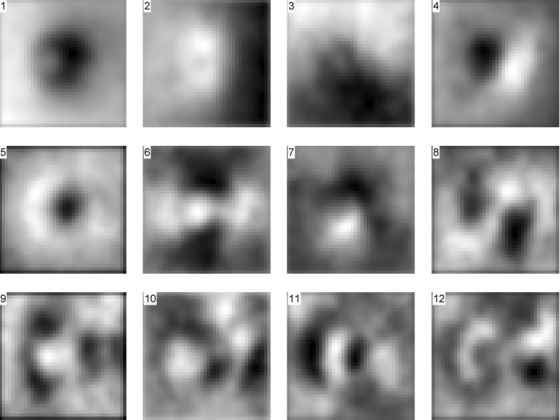
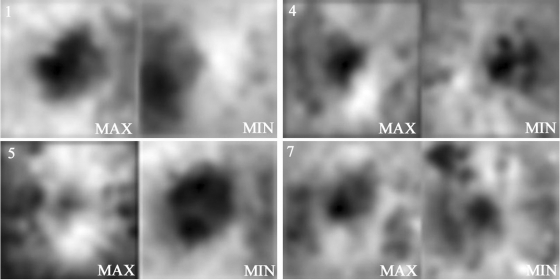
The first N (N = 25) eigen-disparity maps were chosen (Fig. 2) using appearance-based feature selection26 to summarize the statistical properties of the structure in the test population, which accounted for 86.66% of its ONH shape variation.26 The first eigen-disparity map represented the average shape in the entire dataset, and, as expected, variance explained dropped off rapidly after the 25th eigen-disparity map. Figure 3 is an attempt to interpret the morphology of the eigen-disparity maps by which vertical and horizontal tilts of the optic disc seem to be visible in the second and third eigen-disparity maps (Fig. 2) and temporal and nasal components in the fourth map (Fig. 3 top right), whereas the fifth eigen disparity map seemed to show the size variation of cupping (Fig. 3, bottom left).
Figure 2.
Eigen disparity maps corresponding to the 12 largest eigenvalues of the covariance matrix in descending order. The first eigen disparity map represents the average shape of the ONH in the dataset. Given that the OS images are mirrored horizontally, the eigen disparity maps correspond to OD discs in which the temporal side is on the left side of the figure.
Figure 3.
Disparity extrema. Disparity maps with the maxima and minima coefficients associated with four salient eigen disparity maps (from top left to bottom right: 1, 4, 5, 7 displayed in Fig. 2) represent the ONH shape variability in this twin group.
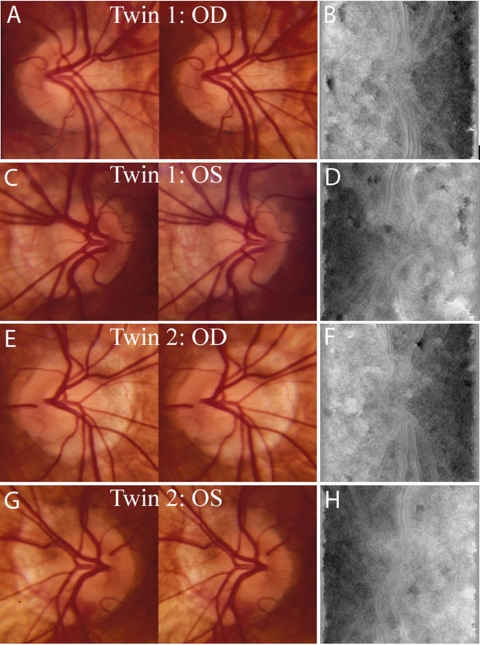
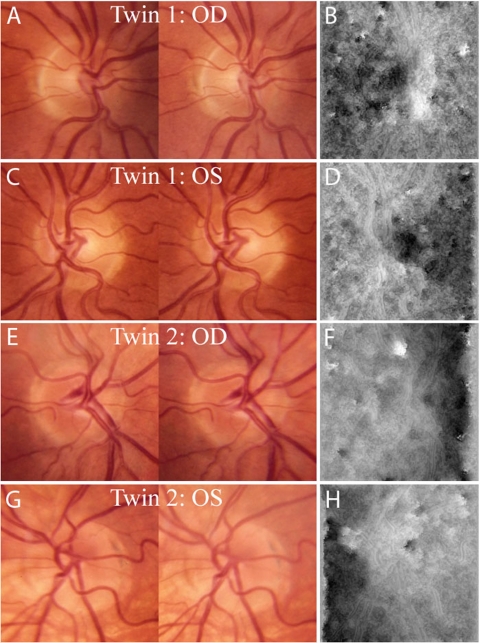
The feature vectors associated with ONH shape were used to quantify the phenotypic resemblance between all pairs of twins. The minimum normalized Euclidean distance (0.1149) between these features was from the OD images of a pair of MZ twins (see Fig. 6, first and third rows) despite apparent differences between the stereo images.
Figure 6.
Minimum intra- and inter-twin distances observed in a pair of MZ twins. Shown are images of both eyes of the two subjects. (A) Subject 1, OD stereoscopic photographs. (B) Subject 1, OD disparity map. (C) Subject 1, OS stereoscopic photographs. (D) Subject 1, OS disparity map. (E) Subject 2, OD stereoscopic photographs. (F) Subject 2, OD disparity map. (G) Subject 2, OS stereoscopic photographs. (H) Subject 2, OS disparity map.
Discrepancy Indices of ONH Shape
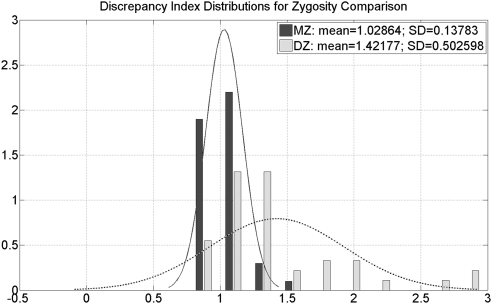
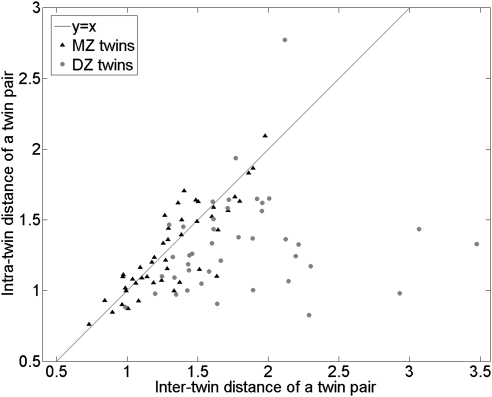
The discrepancy index for twin pairs averaged 1.0286 (95% confidence interval [CI], 0.9872–1.0701) in the 45 pairs of MZ twins and 1.4218 (95% CI, 1.2631–1.5804) in the 41 pairs of DZ twins (Fig. 4). Thus, on average, MZ twins had consistently similar inter-twin and intra-twin distances, whereas DZ twins had larger inter-twin distances (Fig. 5). The discrepancy index was able to predict twin-pair zygosity with an area under the receiver operating characteristic curve (AUC) of 0.83. The minimum intra- and inter-twin distances were observed in a pair of MZ twins (Fig. 6), whereas the maximum inter-twin distance was found in a DZ twin pair (Fig. 7).
Figure 4.
Different distributions of the discrepancy index between MZ and DZ twins. On average, MZ twins have a discrepancy index close to 1 with a smaller SD, whereas DZ twins have the discrepancy index larger than 1 with a greater SD.
Figure 5.
Scatter plot of the average intra-twin distances of ONH shape as a function of average inter-twin distances. The distributions of MZ twins are consistently close to the diagonal y = x, whereas those of DZ twins are more scattered and have larger inter-twin distances.
Figure 7.
Maximum inter-twin distance found in a pair of DZ twins. Shown are images of both eyes of the two subjects. (A) Subject 1, OD stereoscopic photographs. (B) Subject 1, OD disparity map. (C) Subject 1, OS stereoscopic photographs. (D) Subject 1, OS disparity map. (E) Subject 2, OD stereoscopic photographs. (F) Subject 2, OD disparity map. (G) Subject 2, OS stereoscopic photographs. (H) Subject 2, OS disparity map.
Structural Equation Modeling
The standardized variances of the A, C, and E components were 0.80, 2.00 × 10⁻¹⁵, and 0.20, respectively, for all OD and were 0.79, 3.24 × 10⁻¹⁴ and 0.21 for all OS. The full ACE model suggested that a substantial portion of the variation in ONH shape was caused by genetic effects (A), with minor nonshared environmental effects (E) and shared environmental effects (C) negligible. When the C component was removed from the model, the resultant, more restricted AE model explained almost the entire observed variance-covariance for MZ and DZ twins.
Discussion
Results of this preliminary study show that we can quantify inherited three-dimensional ONH shape parameters from stereo color photographs of twins and that approximately 80% of the variability in ONH shape parameters is determined genetically.
We used a novel approach to computationally discover the ONH shape phenotypes from stereo disc color photographs. The shape of the ONH was computed from disparities between pixel correspondences of the stereo images of each optic disc. Then we used two independent, but complementary, approaches to determine the hereditability of ONH shape.
First, using a discrepancy index approach calculated from the ONH shape distances between all four eyes in a twin pair, we found that the discrepancy indices were distributed differently for MZ and DZ twins. In fact, the mean of the distribution for DZ twins was larger than that for MZ twins, and the distribution was more skewed and wider in DZ twins, implying that a significant portion of ONH shape is heritable.
Second, using a classic twin study approach with an ACE model, we were able to quantify the amount of genetically determined variability in ONH shape. The results show that approximately 80% of the variability of the ONH shape in this twin group is a result of genetic factors and that 20% is caused by nonshared environmental effects. Similar results were observed independently for both eyes, all right eyes, and all left eyes.
Interestingly, the approach we used to quantify the three-dimensional shape was similar to the qualitative assessment of stereoscopic optic disc photographs by human experts but tended to remove any influence from blood vessels. It was previously found that experts who state that they use ONH shape to predict whether stereo photographs from a twin pair are MZ or DZ are better at this prediction than experts who state that they use primarily retinal vessel patterns.2
To our knowledge, determining and quantifying ONH shape phenotypes from stereo images is novel and offers an entirely objective approach for phenotype discovery. Although images are often widely available, condensing the information therein into complex phenotypes that can be measured and that are in part inherited is not simple.
Our approach can also be applied to the identification of phenotypic polymorphisms in large cohorts of non-twins, in whom identification and analysis of phenotypes by human experts is difficult or impossible. Such studies can facilitate the discovery of genes that regulate ONH shape, for both genes that regulate normal variation in ONH appearance, and genes that confer risk for glaucoma.
A disadvantage of this study was that the subjects form only a sample of the entire TEST dataset, because of its preliminary study. Now that the feasibility of our approach has been confirmed, we will start quantifying the ONH shape in the entire TEST dataset. Another disadvantage was that we measured the ONH phenotype from retinal stereo color images because they were available for these twins. OCT is the modality of choice to image the three-dimensional shape of the optic nerve head. However, no datasets of three-dimensional OCT ONH scans from twins are yet available.
It is clear from this twin study that features of ONH appearance are determined to a large degree by genetics. However, this preliminary study does not yet provide insight into the number of genes that have a role in ONH appearance or the relative importance of each of these genes. In addition, we propose that this method of phenotype discovery from images using image analysis and a distance metric to measure heritable versus nonheritable variation has the potential to discover phenotypes in other organ systems that can also be imaged.
We plan to extend this preliminary study to all subjects in TEST, perform a similar study on ONH phenotypes in Asian subjects, and elucidate the genotypes determining the heritable phenotypes by Genome Wide Association Study (GWAS).
In summary, we successfully used quantitative phenotyping from stereo color images to show that the shape of the ONH is largely under genetic control. Results of this preliminary study further support efforts to search for the genes that control ONH shape with a range of gene discovery approaches such as GWAS.
Footnotes
Supported by the National Eye Institute Grants R01 EY017066 and R01 EY018853, Research to Prevent Blindness, NY, Department for Veterans Affairs, American Glaucoma Society, Carver Center for Macular Degeneration, Marlene S. and Leonard A. Hadley Glaucoma Research Fund, American Health Assistance Foundation, Ophthalmic Research Institute of Australia, and National Health and Medical Research Council.
Disclosure: L. Tang, P; T.E. Scheetz, None; D.A. Mackey, None; A.W. Hewitt, None; J.H. Fingert, None; Y.H. Kwon, None; G. Quellec, None; J.M. Reinhardt, None; M.D. Abràmoff, P
References
- 1. Sanfilippo PG, Cardini A, Hewitt AW, Crowston JG, Mackey DA. Optic disc morphology: rethinking shape. Prog Retinal Eye Res. 2009;28:227–248 [DOI] [PubMed] [Google Scholar]
- 2. Hewitt AW, Poulsen JP, Alward WL, et al. Heritable features of the optic disc: a novel twin method for determining genetic significance. Invest Ophthalmol Vis Sci. 2007;48:2469–2475 [DOI] [PubMed] [Google Scholar]
- 3. Kingman S. Glaucoma is second leading cause of blindness globally. Bull World Health Organ. 2004;82:887–888 [PMC free article] [PubMed] [Google Scholar]
- 4. Stone EM, Fingert JH, Alward WL, et al. Identification of a gene that causes primary open angle glaucoma. Science. 1997;275:668–670 [DOI] [PubMed] [Google Scholar]
- 5. Fingert JH, Heon E, Liebmann JM, et al. Analysis of myocilin mutations in 1703 glaucoma patients from five different populations. Hum Mol Genet. 1999;8:899–905 [DOI] [PubMed] [Google Scholar]
- 6. Rezaie T, Child A, Hitchings R, et al. Adult-onset primary open-angle glaucoma caused by mutations in optineurin. Science. 2002;295:1077–1079 [DOI] [PubMed] [Google Scholar]
- 7. Stoilov I, Akarsu AN, Sarfarazi M. Identification of three different truncating mutations in cytochrome P4501B1 (CYP1B1) as the principal cause of primary congenital glaucoma (Buphthalmos) in families linked to the GLC3A locus on chromosome 2p21. Hum Mol Genet. 1997;6:641–647 [DOI] [PubMed] [Google Scholar]
- 8. Kwon YH, Fingert JH, Kuehn MH, Alward WL. Primary open-angle glaucoma. N Engl J Med. 2009;360:1113–1124 [DOI] [PMC free article] [PubMed] [Google Scholar]
- 9. Kwon YH, Kim YI, Pereira ML, Montague PR, Zimmerman MB, Alward WL. Rate of optic disc cup progression in treated primary open-angle glaucoma. J Glaucoma. 2003;12:409–416 [DOI] [PubMed] [Google Scholar]
- 10. Rende RD, Plomin R, Vandenberg SG. Who discovered the twin method? Behav Genet. 1990;20:277–285 [DOI] [PubMed] [Google Scholar]
- 11. Posthuma DB, de Geus AL, van Baal EJC, et al. Theory and practice in quantitative genetics. Twin Res. 2003;6:361–376 [DOI] [PubMed] [Google Scholar]
- 12. Seddon JM, Cote J, Page WF, Aggen SH, Neale MC. The US twin study of age-related macular degeneration: relative roles of genetic and environmental influences. Arch Ophthalmol. 2005;123:321–327 [DOI] [PubMed] [Google Scholar]
- 13. Schuman JS, Hee MR, Arya AV, et al. Optical coherence tomography: a new tool for glaucoma diagnosis. Curr Opin Ophthalmol. 1995;6:89–95 [DOI] [PubMed] [Google Scholar]
- 14. He M, Ge J, Wang D, et al. Heritability of the iridotrabecular angle width measured by optical coherence tomography in Chinese children: the Guangzhou twin eye study. Invest Ophthalmol Vis Sci. 2008;49:1356–1361 [DOI] [PubMed] [Google Scholar]
- 15. Mackey DA, Mackinnon JR, Brown SA, et al. Twins Eye Study in Tasmania (TEST): rationale and methodology to recruit and examine twins. Twin Res Hum Genet. 2009;12:441–454 [DOI] [PMC free article] [PubMed] [Google Scholar]
- 16. Tang L, Kwon YH, Alward WLM, et al. 3D reconstruction of the optic nerve head using stereo fundus images for computer-aided diagnosis of glaucoma. SPIE Med Imaging. 2010;7624 [Google Scholar]
- 17. Marr D, Poggio T. Cooperative computation of stereo disparity. Science. 1976;194:209–236 [DOI] [PubMed] [Google Scholar]
- 18. Nyholt D. On the probability of dizygotic twins being concordant for two alleles at multiple polymorphic loci. Twin Res Hum Genet. 2006;9:194–197 [DOI] [PubMed] [Google Scholar]
- 19. Abràmoff MD, Alward WL, Greenlee EC, et al. Automated segmentation of the optic disc from stereo color photographs using physiologically plausible features. Invest Ophthalmol Vis Sci. 2007;48:1665–1673 [DOI] [PMC free article] [PubMed] [Google Scholar]
- 20. Jenny CA, Read BGC. Does depth perception require vertical-disparity detectors? J Vis. 2006;6:1323–1355 [DOI] [PubMed] [Google Scholar]
- 21. ter Haar Romeny BM. Front End Vision and Multi-scale Image Analysis. Dordrecht: Kluwer Academic Publishers; 2003 [Google Scholar]
- 22. Niemeijer M, van Ginneken B, Staal J, Suttorp-Schulten MS, Abràmoff MD. Automatic detection of red lesions in digital color fundus photographs. IEEE Trans Med Imaging. 2005;24:584-592 [DOI] [PubMed] [Google Scholar]
- 23. Staal J, Abràmoff MD, Niemeijer M, Viergever MA, van Ginneken B. Ridge-based vessel segmentation in color images of the retina. IEEE Trans Med Imaging. 2004;23:501–509 [DOI] [PubMed] [Google Scholar]
- 24. Haeker M, Abràmoff M, Kardon R, Sonka M. Segmentation of the surfaces of the retinal layer from OCT images. Med Image Comput Assist Interv. 2006;9:800–807 [DOI] [PubMed] [Google Scholar]
- 25. Garvin MK, Abràmoff MD, Kardon R, Russell SR, Wu X, Sonka M. Intraretinal layer segmentation of macular optical coherence tomography images using optimal 3-D graph search. IEEE Trans Med Imaging. 2008;27:1495–1505 [DOI] [PMC free article] [PubMed] [Google Scholar]
- 26. Belhumeur PN, Hespanha JP, Kriegman DJ. Eigenfaces vs. fisherfaces: recognition using class specific linear projection. IEEE Trans Pattern Anal Machine Intelligence. 1997;19:711–720 [Google Scholar]
- 27. Simberg S, Santtila P, Soveri A, Varjonen M, Sala E, Sandnabba NK. Exploring genetic and environmental effects in dysphonia: a twin study. J Speech Language Hearing Res. 2009;52:153–163 [DOI] [PubMed] [Google Scholar]
- 28. Pearl J. Causality: Models, Reasoning, and Inference. Cambridge: Cambridge University Press; 2000 [Google Scholar]
- 29. OpenMx Advanced Structural Equation Modeling. The OpenMx Project; 2007–2009. http://openmx.psyc.virginia.edu/ Accessed June 30, 2010 [Google Scholar]
- 30. Zhu G, Hewitt AW, Ruddle JB, et al. Genetic dissection of myopia: evidence for linkage of ocular axial length to chromosome 5q. Ophthalmology. 2008;115:1053–1057, e1052 [DOI] [PubMed] [Google Scholar]


