Abstract
Atazanavir (ATV) is an antiretroviral drug of the protease inhibitor class. Multiple adverse effects of ATV have been reported in clinical practice, such as jaundice, nausea, abdominal pain, and headache. The exact mechanisms of ATV-related adverse effects are unknown. It is generally accepted that a predominant pathway of drug-induced toxicity is through the generation of reactive metabolites. Our current study was designed to explore reactive metabolites of ATV. We used a metabolomic approach to profile ATV metabolism in mice and human liver microsomes. We identified 5 known and 13 novel ATV metabolites. Three potential reactive metabolites were detected and characterized for the first time: one aromatic aldehyde, one α-hydroxyaldehyde, and one hydrazine. These potential reactive metabolites were primarily generated by CYP3A. Our results provide a clue for studies on ATV-related adverse effects from the aspect of metabolic activation. Further studies are suggested to illustrate the impact of these potential reactive metabolites on ATV-related adverse effects.
Introduction
Atazanavir (Reyataz) (ATV), is a protease inhibitor (PI) used for the treatment of the human immunodeficiency virus (HIV) infection (Swainston Harrison and Scott, 2005; Croom et al., 2009). ATV was approved by the U.S. Food and Drug Administration in 2003 and is used in combination with other antiretroviral agents, such as ritonavir (RTV). The Food and Drug Administration also approved the use of ATV without cotreatment with RTV in selective PI-naive patients. The recommended dose for treatment-naive patients is 300 mg of ATV with 100 mg of RTV once daily. ATV can be given in a dose of 400 mg once daily without RTV for selected PI-naive patients who cannot tolerate RTV (Rivas et al., 2009). ATV has particular advantages over other PIs because of its moderate resistance profile, minimal effect on lipid profiles, low capsule burden, and once-daily dosing (Rivas et al., 2009).
Despite these advantages, ATV is associated with various adverse drug reactions (Busti et al., 2004; Havlir and O'Marro, 2004). Nausea was reported in ∼35% of the patients receiving ATV, followed by abdominal pain, headache, and diarrhea (Goldsmith and Perry, 2003). The most common laboratory abnormality is hyperbilirubinemia, which was reported in ∼40% of patients who received 400 mg of ATV once daily. ATV-induced hyperbilirubinemia rarely led to discontinuation of treatment; however, ∼8% of patients developed clinical jaundice (Goldsmith and Perry, 2003; Sulkowski, 2004). In addition, elevation of alanine aminotransferase and aspartate aminotransferase activity was noted in ∼14% of the patients receiving ATV and was unrelated to bilirubin levels (Goldsmith and Perry, 2003). Monitoring of liver function is recommended for ATV-treated patients, in particular for the patients with existing liver diseases (Eholié et al., 2004). The exact mechanisms of ATV-related adverse effects are unknown.
It is generally accepted that a predominant pathway of drug-induced toxicity is via the generation of reactive metabolites (Baillie, 2006; Guengerich and MacDonald, 2007). The reactive metabolites, such as aldehyde, epoxide, quinone methide, and hydroxylamine, can cause various adverse side effects (O'Brien et al., 2005; Tang and Lu, 2010). For instance, felbamate, a broad-spectrum antiepileptic agent, resulted in hepatotoxicity by way of its metabolite atropaldehyde (Dieckhaus et al., 2002). Until now, limited information has been available on ATV metabolism. In 2009, five ATV metabolites were reported, which included one N-dealkylation product, two metabolites resulting from carbamate hydrolysis, one hydroxylated product, and one keto metabolite (ter Heine et al., 2009). Reactive metabolites of ATV have not been identified.
In the current study, we used a metabolomic approach, which has been proved to be a powerful tool in studying drug metabolism (Chen et al., 2006; Li et al., 2010), to investigate the metabolism of ATV in mice and human liver microsomes (HLM). We identified 5 known and 13 novel ATV metabolites. Three potential reactive metabolites were detected and characterized: one aromatic aldehyde, one α-hydroxyaldehyde, and one hydrazine. CYP3A4 was identified as the primary enzyme involved in the formation of the two aldehydes and one hydrazine. These results provide a clue for studies on ATV-related adverse effects from the aspect of metabolic activation.
Materials and Methods
Chemicals and Reagents.
ATV (methyl N-[(2S)-1-[2-[(2S,3S)-2-hydroxy-3-[[(2S)-2-(methoxycarbonylamino)-3,3-dimethylbutanoyl]amino]-4-phenylbutyl]-2-[(4-pyridin-2-ylphenyl) methyl]hydrazinyl]-3,3-dimethyl-1-oxobutan-2-yl]carbamate) was supplied by the National Institutes of Health AIDS Research and Reference Reagent Program. The recombinant human P450s and HLM were purchased from XenoTech, LLC (Lenexa, KS). Isoniazid (INH), methoxylamine, ketoconazole (KCZ), semicarbazide, and NADPH were obtained from Sigma-Aldrich (St. Louis, MO). 4-(Pyridin-2-yl)-benzaldehyde and 4-(pyridin-2-yl)benzoic acid were purchased from SynChem, Inc. (Des Plaines, IL). All the solvents for liquid chromatography and mass spectrometry were of the highest grade commercially available.
Animals and Treatments.
All mice (2–4 months old) were maintained under a standard 12-h dark/light cycle with water and chow provided ad libitum. Handling was in accordance with study protocols approved by the University of Kansas Medical Center Institutional Animal Care and Use Committee. The mice were treated (orally) with ATV (50 mg/kg) or 4-(pyridin-2-yl)-benzaldehyde (12 mg/kg) and housed separately in metabolic cages for 18 h. Urine and feces were collected for metabolite analysis. In brief, urinary samples were prepared by mixing 40 μl of urine with 160 μl of 50% acetonitrile and were centrifuged at 20,000 relative centrifugal forces (rcf) for 10 min. Feces were homogenized in water (1 mg of feces in 10 μl of H2O). Then 200 μl of acetonitrile was added to 200 μl of the resulting mixture, followed by centrifugation at 20,000 rcf for 10 min. The supernatant was transferred to a new Eppendorf vial for a second centrifugation (20,000 rcf for 10 min). Each supernatant was transferred to an autosampler vial, and 5.0 μl was injected into a system (Waters, Milford, MA) combining ultraperformance liquid chromatography (UPLC) and time-of-flight mass spectrometry (TOFMS) for metabolite analysis.
ATV Metabolism In Vitro.
Incubations were conducted in 1× phosphate-buffered saline (PBS) (pH 7.4) containing 50 μM ATV, 0.1 mg of HLM, or 2 pmol of each cDNA-expressed P450 enzyme (control, CYP1A2, 2A6, 2B6, 2C8, 2C9, 2C19, 2D6, 2E1, and CYP3A4) in a final volume of 190 μl. After 5 min of preincubation at 37°C, the reaction was initiated by the addition of 10 μl of 20 mM NADPH (final concentration 1.0 mM) and continued for 30 min with gentle shaking. Incubations in the absence of NADPH were used as controls. Coincubations of KCZ (10 μM) were performed to determine the role of CYP3A in ATV metabolism. Incubations were terminated by adding 200 μl of acetonitrile and vortexing for 1 min and centrifuging at 20,000 rcf for 10 min. Each supernatant was transferred to an autosampler vial, and 5.0 μl was injected into the UPLC-TOFMS system for metabolite analysis. All incubations were performed in duplicate.
Biomarkers of Metabolic Activation.
Because most reactive metabolites are not stable, it is difficult to detect them directly. Reactive intermediates can form adducts with trapping agents, such as GSH, potassium cyanide, methoxylamine, and semicarbazide, which predict potential binding with cellular proteins and/or some other molecules. For example, methoxylamine can form a Schiff base with aldehydes, a process mimicking reactions between aldehyde metabolites and lysine residues on proteins (Evans et al., 2004). UPLC-TOFMS can be used to detect adducts of reactive metabolites and trapping agents. In the current study, methoxylamine, semicarbazide, and INH were used as trapping agents.
Synthesis and Characterization of Methyl Oxime of 4-(Pyridin-2-yl) benzaldehyde.
Methoxylamine hydrochloride (172 mg, 2.1 mmol) and pyridine (167 mg, 2.1 mmol) were added to a solution of 4-(pyridin-2-yl)benzaldehyde (366 mg, 2.0 mmol) in methanol (10 ml). The reaction mixture was refluxed for 30 min in a water bath. After most of the methanol had been removed in vacuo, water (5.0 ml) was added to the residue, and the mixture was extracted with CH2Cl2 (two 15-ml extractions). The organic phases were washed with H2O (two 10-ml washes) and dried with MgSO4. After removal of the organic solvent under vacuum, the residue was subject to flash chromatography on silica gel (hexane-ethyl acetate 6:1) to yield the oxime ether (338 mg, 80%) as a colorless oil. 1H NMR (400 MHz, CDCl3): δ 8.70 (dd, 3J = 8.1 Hz, 4J = 1.5 Hz, 1H, pyridinyl-H), 8.10 (s, 1H, CH = NOCH3), 8.01 (d, 3J = 8.0 Hz, 2H, phenyl-H), 7.72–7.80 (2H, pyridinyl-H), 7.67 (d, 3J = 8.0 Hz, 2H, phenyl-H), 7.25 (m, 1H, pyridinyl-H), 3.99 (s, 1H, CH = NOCH3); 13C NMR (100 MHz, CDCl3): δ 156.5 (CH = NOCH3), 149.7 (pyridinyl-C), 148.2 (pyridinyl-C), 140.5 (phenyl-C), 136.8 (pyridinyl-C), 132.6 (phenyl-C), 127.7, (phenyl-C), 127.1 (phenyl-C), 122.4 (pyridinyl-C), 120.5 (pyridinyl-C), 62.1 (CH = NOCH3); high-resolution mass spectrometry (electrospray ionization, positive): m/z [M + H]+ calculated for C13H13N2O: 213.1028; found: 213.1024. 1H and 13C NMR spectra were recorded on a 400 MHz Varian spectrometer. Chemical shifts are reported in parts per million, and coupling constants, J, are reported in Hertz (Supplemental Fig. 1).
Trapping 4-(Pyridin-2-yl)benzaldehyde Using Methoxylamine.
One aromatic aldehyde, namely, 4-(pyridin-2-yl)benzaldehyde, was detected in our study using methoxylamine as a trapping agent. The experiment was performed in 1× PBS containing 50 μM ATV, 0.1 mg of HLM, and 20.0 μl of 50 mM methoxylamine (dissolved in 1× PBS, final concentration 5 mM) in a final volume of 190 μl. After 5 min of preincubation at 37°C, the reaction was initiated by the addition of 10 μl of 20 mM NADPH (final concentration 1.0 mM) and continued for 30 min with gentle shaking. The same incubations were conducted without NADPH as the control. The workup is identical to the procedure described under ATV Metabolism In Vitro.
Trapping Methyl (S)-1-((2S,3R)-3-hydroxy-4-oxo-1-phenylbutan-2-ylamino)-3,3-dimethyl-1-oxobutan-2-ylcarbamate Using INH.
One α-hydroxyaldehyde, namely, methyl (S)-1-((2S,3R)-3-hydroxy-4-oxo-1-phenylbutan-2-ylamino)-3,3-dimethyl-1-oxobutan-2-ylcarbamate, was detected in our study. INH was used to trap this α-hydroxyaldehyde. The experiment was performed in 1× PBS containing 50 μM ATV, 0.1 mg of HLM, and 20.0 μl of 50 mM INH (dissolved in H2O, final concentration 5 mM) in a final volume of 190 μl. After 5 min of preincubation at 37°C, the reaction was initiated by the addition of 10 μl of 20 mM NADPH (final concentration 1.0 mM) and continued for 1 h with gentle shaking. The same incubations without NADPH were conducted as the control. The reactions were quenched by adding 200 μl of ice-cold acetonitrile. The mixture was vortexed for 1 min and centrifuged at 20,000 rcf for 10 min. The supernatant was transferred to an autosampler vial, and 5.0 μl was injected into the UPLC-TOFMS system for metabolite analysis. In addition to INH, semicarbazide was also used to trap this α-hydroxyaldehyde.
UPLC-TOFMS Analysis.
ATV and its metabolites were separated using a 100 × 2.1-mm (Acquity 1.7 μm) UPLC BEH C-18 column (Waters). The flow rate of the mobile phase was 0.3 ml/min with a gradient ranging from 2 to 98% aqueous acetonitrile containing 0.1% formic acid in a 10-min run. TOFMS was operated in both positive and negative modes with electrospray ionization. The source temperature and desolvation temperature were set at 120 and 350°C, respectively. Nitrogen was applied as the cone gas (10 l/h) and desolvation gas (700 l/h). Argon was applied as the collision gas. TOFMS was calibrated with sodium formate and monitored by the intermittent injection of lock mass leucine enkephalin in real time. The capillary voltage and the cone voltage were set at 3.5 kV and 35 V in positive ion mode. Metabolites were screened by using MarkerLynx software (Waters) on the basis of accurate mass measurement (mass errors less than 10 ppm). The structures of ATV and its metabolites were elucidated by tandem mass spectrometry fragmentation with collision energy ramp ranging from 10 to 40 eV.
Data Analysis.
Mass chromatograms and mass spectra were acquired by MassLynx software in centroid format from m/z 50 to 1000. Centroid and integrated mass chromatographic data were processed by MarkerLynx software to generate a multivariate data matrix. Principal component analysis (PCA) and orthogonal projection to latent structures-discriminant analysis (OPLS-DA) were conducted on Pareto-scaled data. The corresponding data matrices were then exported into SIMCA-P+12 (Umetrics, Kinnelon, NJ) for multivariate data analysis.
Results
Profile of ATV Metabolism in Mice Using a Metabolomic Approach.
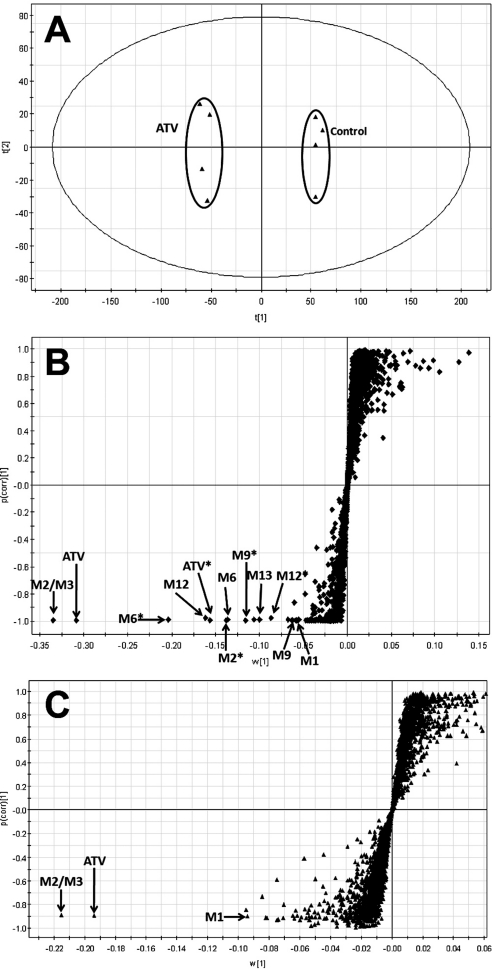
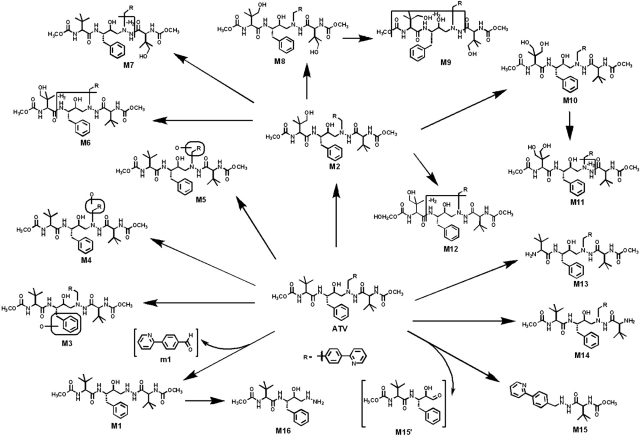
ATV and its metabolites were found in the feces and urine but mainly in the feces. The results of chemometric analysis on the ions produced by UPLC-TOFMS assay of control and ATV-treated mouse urine and feces are shown in Fig. 1. The unsupervised PCA analysis score plot of the feces (Fig. 1A) revealed two clusters corresponding to the control and ATV-treated groups. The S-plots (Fig. 1, B and C) generated from OPLS-DA display the ion contribution to the group separation in the feces and urine, respectively. The top ranking ions were identified as ATV and its metabolites, which were marked in the S-plots (Fig. 1, B and C). The MS/MS spectra of M2–M14 and their structural elucidations are provided in Supplemental Fig. 2. The patterns of ATV metabolites in urine and feces are similar, but most of them are much more abundant in feces (Supplemental Figs. 3 and 4). The metabolic map of ATV in mice is summarized in Fig. 2. Overall, 18 ATV metabolites were identified, including 5 previously reported metabolites (M1, M2, M6, M13, and M14) (ter Heine et al., 2009) and 13 novel metabolites (Fig. 2). Among these novel ATV metabolites, 3 potential reactive metabolites were detected and characterized: one aromatic aldehyde (m1), one α-hydroxyaldehyde (M15′), and one hydrazine (M16).
Fig. 1.
Metabolomic analysis of control and ATV-treated mouse urine and feces. Wild-type mice (n = 4) were treated with 50 mg/kg ATV (orally). Urine and feces were collected for analysis. A, separation of control and ATV-treated mouse feces in a PCA score plot. The t[1] and t[2] values represent the score of each sample in principal component 1 and 2, respectively. B, loading S-plot generated by OPLS-DA analysis of metabolome in ATV-treated mouse feces. C, loading S-plot generated by OPLS-DA analysis of metabolome in ATV-treated mouse urine. The x-axis is a measure of the relative abundance of ions, and the y-axis is a measure of the correlation of each ion to the model. These loading plots represent the relationship between variables (ions) in relation to the first and second components present in the PCA score plot. ATV and its metabolites were labeled. The number of ions (metabolite identification) was accordant with that in Fig. 2.
Fig. 2.
The metabolite map of ATV. All metabolites were determined by accurate mass and mass fragmentations. Overall, 18 ATV metabolites were identified, including 5 previously reported metabolites (M1, M2, M6, M13, and M14) (ter Heine et al., 2009) and 13 novel metabolites. Among these novel ATV metabolites, one aromatic aldehyde (m1), one α-hydroxyaldehyde (M15′), and one hydrazine (M16) were detected and characterized.
Identification of an Aromatic Aldehyde (m1) in ATV Metabolism.
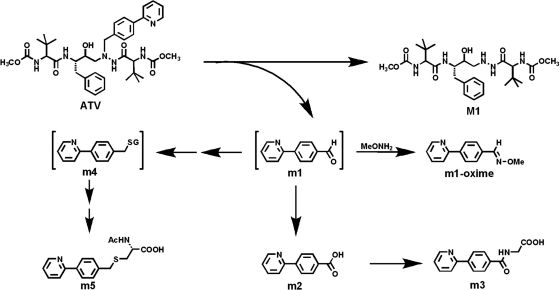
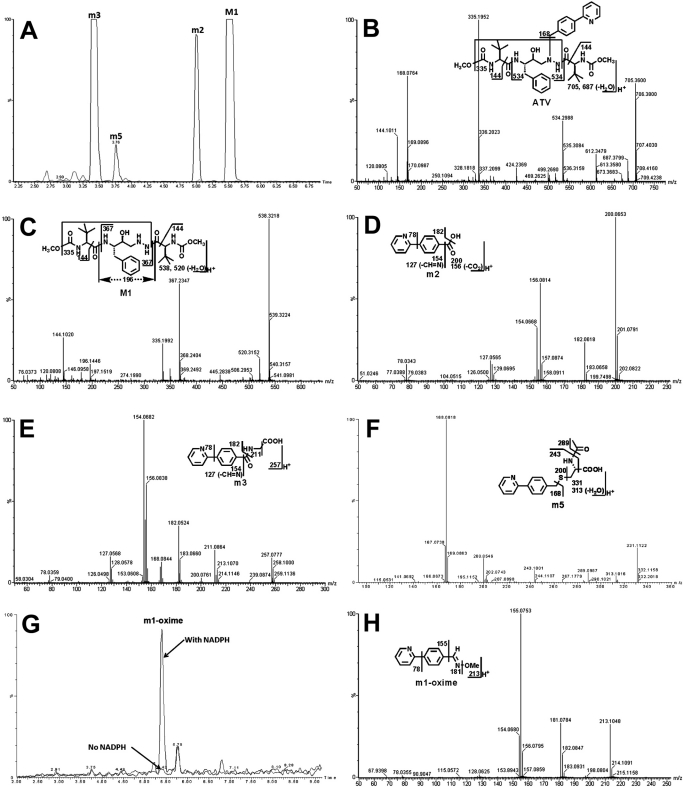
A dealkylated ATV metabolite (M1) was reported in a previous study (ter Heine et al., 2009). In theory, an aldehyde should be generated together with the formation of M1. We confirmed the existence of the aldehyde (m1) in ATV metabolism (Figs. 3 and 4). In the ATV-treated mouse urine samples, the dealkylated ATV metabolite (M1) was detected, but the expected aldehyde (m1) was not found. However, further metabolites of m1 were detected, which included an acid (m2), a glycine-conjugate product (m3), and an N-acetylcysteine-conjugate product (m5) (Fig. 3). In addition, the existence of m1 was confirmed in incubations with HLM using methoxylamine as a trapping agent. The evidence for m1 formation is summarized in Fig. 4. The chromatograms of M1, m2, m3, and m5 are presented in Fig. 4A. M1 was eluted at 5.51 min and had a protonated molecule [M + H]+ at m/z = 538 Da. Compared with the MS/MS of ATV (Fig. 4B), M1 had the same fragments at m/z 335 and 144. The fragment ion at m/z 367 and the absence of ion at m/z 168 suggested that the 4-(pyridin-2-yl)-benzyl moiety was lost from ATV. The other fragment ions are interpreted in the inlaid structural diagram (Fig. 4C).
Fig. 3.
A scheme of m1 formation and its further metabolism. m1 was generated from ATV spontaneously with M1, and it was trapped using methoxylamine (MeONH2). In mice, m1 can be further metabolized to acid (m2) and conjugated with glycine (m3). m1 may interact with GSH (m4) and be further metabolized to an N-acetylcysteine-conjugate product (m5).
Fig. 4.
Identification of metabolite m1. Urine and feces from mice were collected for 18 h after ATV treatment (50 mg/kg p.o.). In addition, in vitro studies were performed to trap m1 using methoxylamine. Structural elucidations were performed on the basis of accurate mass measurement (mass errors less than 10 ppm) and MS/MS fragmentations. MS/MS fragmentation was conducted with collision energy ramping from 10 to 40 eV. Major daughter ions from fragmentation were interpreted in the inlaid structural diagrams. A, chromatograms of metabolite M1, m2, m3, and m5 in urine. B, MS/MS of ATV. C, MS/MS of M1. D, MS/MS of m2. E, MS/MS of m3. F, MS/MS of m5. G, chromatograms of m1-oxime in the incubation with HLM. H, MS/MS of m1-oxime.
4-(Pyridin-2-yl)benzoic Acid (m2).
m2 is an oxidized metabolite of m1. In both the ATV-treated and 4-(pyridin-2-yl)benzaldehyde (m1)-treated mouse urine samples, m2, which had a protonated molecule [M + H]+ at m/z = 200 Da, was detected. The fragment ions of m2, at m/z 182, 154, 127, and 78, are interpreted in the inlaid diagram (Fig. 4D). In addition, m2 was confirmed by comparison of retention time and accurate mass with an authentic standard sample.
2-(4-(Pyridin-2-yl)benzamido)acetic Acid (m3).
m3 is a glycine-conjugated product of m2. Metabolite m3 was eluted at 3.42 min, having a protonated molecule [M + H]+ at m/z = 257 Da. The major ions at m/z 182, 154, 127, and 78 are interpreted in Fig. 4E. The ion at m/z 211 was formed by loss of the HCOOH moiety.
2-Acetamido-3-(4-(pyridin-2-yl)benzylthio)propanoic acid (m5).
m5 is a further metabolite of m1, which is conjugated with N-acetylcysteine, a moiety of GSH. Metabolite m5, eluted at 3.76 min, had a protonated molecule [M + H]+ at m/z = 331 Da. MS/MS of m5 produced the major ions at m/z 289, 243, 200, and 168. The structural elucidation was interpreted in Fig. 4F. Metabolite m5 was observed in both ATV and 4-(pyridin-2-yl)benzaldehyde (m1)-treated mouse urine samples.
4-(Pyridin-2-yl)benzaldehyde (m1).
In the incubation with HLM and ATV, 4-(pyridin-2-yl)benzaldehyde (m1) was trapped using methoxylamine. The formed oxime was eluted at 5.47 min (Fig. 4G), having a mass of [M + H]+ = 213 m/z. MS/MS of the m1-oxime generated the ions at 181 (loss of CH3OH) and 155 (loss of C2H4NO). The ions were interpreted in the inlaid structural diagram (Fig. 4H). The structure of m1-oxime was confirmed by comparing the retention time and accurate mass with those of the synthetic authentic standard sample, which was characterized by NMR.
Identification of an α-Hydroxyaldehyde (M15′) in ATV Metabolism.
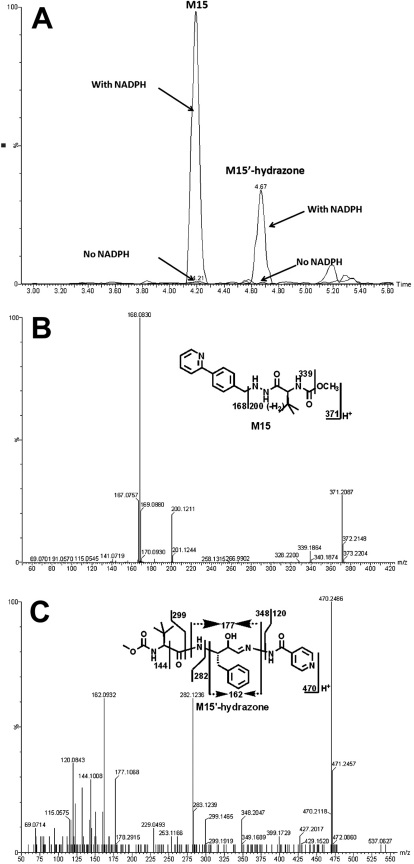
In ATV-treated mouse urine samples and in vitro study using HLM, a novel dealkylated metabolite (M15) of ATV was identified. Meanwhile, an α-hydroxyaldehyde (M15′) was trapped by INH (Fig. 5) and semicarbazide (data not shown) in the incubation of ATV in HLM. The formations of M15 and M15′ were NADPH-dependent (Fig. 5A). The chromatograms of M15 and M15′-hydrazone are depicted in Fig. 5A. Metabolite M15 was eluted at 4.23 min, having a protonated molecule [M + H]+ at m/z = 371 Da, 321 Da (loss of C17H25N2O4) less than that of ATV. The fragment ions at m/z 339 (loss of CH3OH), 200 (loss of C12H10N), and 168 (C12H10N) were interpreted in the inlaid structural diagram (Fig. 5B). The formed M15′-hydrazone of INH, eluted at 4.67 min, had a protonated molecule [M + H]+ at m/z = 470 Da. MS/MS of the M15′-hydrazone produced the major ions 282 (loss of C8H15N2O3) and 162 (C10H12NO). The structural elucidation was interpreted in the inlaid structural diagram (Fig. 5C).
Fig. 5.
Identification of metabolite M15′. Duplicate incubations were conducted in 1× PBS (pH 7.4) containing ATV (50 μM), HLM (0.5 g of protein/l), and INH (5.0 mM), with or without NADPH (1.0 mM). The metabolites were analyzed using UPLC-TOFMS. A, chromatograms of M15 and M15′-hydrazone. B, MS/MS of M15. C, MS/MS of M15′-hydrazone.
Identification of a Hydrazine (M16) in ATV Metabolism.
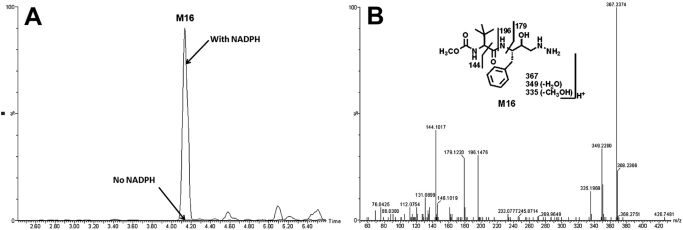
In the incubation with ATV and HLM, a hydrazine (M16), resulting from the dealkylation and hydrolysis, was identified (Fig. 6). The formations of M16 were NADPH-dependent (Fig. 6A). M16, eluted at 4.18 min, had a protonated molecule [M + H]+ at m/z = 367 Da, 171 (C8H13NO3) Da less than that of M1. MS/MS of M16 produced the major fragment ions at m/z 349 (loss of H2O), 179 (C10H15NO2), and 144 (C7H14NO2). The fragment ions were interpreted in the inlaid structural diagram (Fig. 6B).
Fig. 6.
Identification of the metabolite M16. Duplicate incubations were conducted in 1× PBS (pH 7.4) containing ATV (50 μM) and HLM (0.5 g of protein/l), with or without NADPH (1.0 mM). The metabolites were analyzed using UPLC-TOFMS. A, chromatogram of M16. B, MS/MS of M16.
ATV Metabolism in HLM.
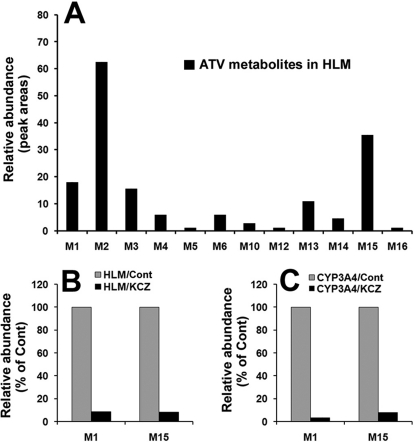
Fourteen ATV metabolites were identified in the incubation with HLM (Supplemental Table 1), including two dealkylated ATV metabolites (M1 and M15), two aldehydes (m1 and M15′), four monohydroxylated ATV metabolites (M2, M3, M4, and M5), one monohydroxylated + monodehydrogenated metabolite (M6), one dihydroxylated ATV metabolite (M10), one dihydroxylated + monodehydrogenated metabolite (M12), two hydrolyzed metabolites (M13 and M14), and one hydrazine (M16). Their relative abundance is displayed in Fig. 7A. M2 is the most abundant metabolite of ATV in the incubation with HLM, followed by M15 and M1. The metabolic pathways of M1 and M15 should be emphasized because 1) they are major metabolic pathways in ATV metabolism, 2) two aldehydes (m1 and M15′) are generated simultaneously with the formation of metabolites M1 and M15, and 3) the generation of the hydrazine (M16) is also dependent on M1.
Fig. 7.
ATV metabolism in HLM and the role of CYP3A in ATV metabolism. Duplicate incubations were conducted in 1× PBS (pH 7.4) containing ATV (50 μM), NADPH (1.0 mM), HLM (0.5 g of protein/l), or CYP3A4 (10 nM). KCZ (10 μM) was used in the inhibitory test. A, relative abundance of ATV metabolites generated from HLM. B, effects of KCZ (10 μM) on the formations of M1 and M15 in the incubation with HLM. C, effects of KCZ (10 μM) on the formations of M1 and M15 in the incubation with cDNA-expressed CYP3A4. The data are expressed as means.
Role of P450s in ATV Metabolism.
The incubation of ATV with nine different human cDNA-expressed P450s (CYP1A2, 2A6, 2B6, 2C8, 2C9, 2C19, 2D6, 2E1, and 3A4) revealed that CYP3A4 is the primary enzyme contributing to ATV metabolism (Supplemental Table 1). CYP3A4 and CYP2D6 cocontributed to the metabolic pathway of metabolite M1, but CYP3A4 was more important than CYP2D6 (Supplemental Table 1). CYP3A4 was the dominant enzyme responsible for the formation of metabolite M15 (Fig. 7, B and C). The inhibitory effect on the M1 and M15 metabolic pathways was further verified by coincubation of KCZ with HLM and cDNA-expressed CYP3A4. In the incubation with HLM, the formations of M1 and M15 were suppressed up to 90% by KCZ at 10 μM (Fig. 7B). In the incubation with CYP3A4, KCZ at 10 μM inhibited the formations of M1 to 95% and M15 to 90% (Fig. 7C).
Discussion
In our current study, we used a liquid chromatography-mass spectrometry-based metabolomic approach to profile ATV metabolism. We identified 18 ATV metabolites, including 5 previously reported metabolites (M1, M2, M6, M13, and M14) (ter Heine et al., 2009) and 13 novel metabolites (Fig. 2; Supplemental Fig. 2). Three potential reactive metabolites, one aromatic aldehyde (m1), one α-hydroxyaldehyde (M15′), and one hydrazine (M16), were detected and characterized for the first time. The levels of the two aldehydes (m1 and M15′) were high because they were generated from two primary metabolic pathways of ATV, M1, and M15 (Figs. 2 and 7A).
The aromatic aldehyde (m1) that we identified in ATV metabolism (Figs. 3 and 4) was further oxidized to the corresponding acid m2 and then conjugated with glycine to yield the metabolite m3. This pathway may contribute to the detoxication of aldehyde m1. On the other hand, an N-acetylcysteine-conjugate product (m5) was detected in the ATV-treated mouse urines. The formation of metabolite m5 indicates that the further metabolite of m1 can interact and form an adduct with GSH (m4) (Fig. 3). The exact mechanism of m5 formation was not determined in the current study. On the basis of a previous report (Ji et al., 2007), an intermediate sulfate is proposed. In brief, m1 can be reduced to an alcohol, and subsequently sulfated to form a sulfate that serves as a leaving group. The resulting sulfate reacts with GSH to form m4, which is further metabolized to an N-acetylcysteine-conjugate product (m5). Clarification of the mechanism of this interaction with GSH and its implication in ATV-related adverse effects is desired in future studies.
The hydrazine (M16) that we identified is a further metabolite of M1. It has been reported that hydrazine can cause hepatic lesions and neurotoxicity (Waterfield et al., 1993; Nicholls et al., 2001). The detection of metabolite M16 provided more insight for the study of ATV toxicity. The α-hydroxyaldehyde (M15′) is predicted as the most active metabolite of ATV, which cannot be directly detected in mouse urine or the HLM incubation system. Previous studies have suggested that α-hydroxyaldehyde can form a Schiff base with the amino group on the protein. The unstable imine can be converted into a stable 1-amino-2-keto protein adduct by an intramolecular Amadori rearrangement, resulting in the toxicity (Spahn-Langguth and Benet, 1992; Tang and Lu, 2010).
CYP3A4 was determined as the primary enzyme contributing to metabolic pathways of M1 and M15. Thus, cotreatment with ATV and a CYP3A4 inducer will increase the formation of reactive metabolites M15′, m1, and M16, which may augment ATV toxicity. Rifampicin, which is also a CYP3A4 inducer, is a first-line drug for tuberculosis (TB) treatment. According to the guideline of the World Health Organization, HIV/TB coinfected patients are required to be treated with anti-TB drugs for at least 2 weeks before the initiation of anti-HIV treatment. In a recent clinical trial, nausea, vomiting, and elevation of alanine aminotransferase activity were reported in all healthy volunteers who were pretreated with rifampicin followed by treatment with ATV and RTV (Haas et al., 2009). It is possible that rifampicin induces CYP3A4 expression, which accelerates ATV metabolism to reactive metabolites, such as m1, M15′, and M16, resulting in liver injury.
In summary, we identified three potential reactive metabolites of ATV, which included two aldehydes and one hydrazine. CYP3A4 was determined to be the primary enzyme contributing to the formation of these aldehydes and hydrazine. Further studies are suggested to illustrate the role of these potential reactive metabolites in ATV-related adverse effects.
Supplementary Material
Acknowledgments
We thank the National Institutes of Health AIDS Research and Reference Reagent Program for providing the HIV protease inhibitors; Jin Chou and Dr. Zhonghua Peng (University of Missouri-Kansas City) for NMR service; and Dr. Martha Montello for editing the manuscript.
This work was supported by the National Institutes of Health National Center for Research Resources [Grant COBRE 5P20-RR021940].
Article, publication date, and citation information can be found at http://dmd.aspetjournals.org.
doi:10.1124/dmd.110.036327.
The online version of this article (available at http://dmd.aspetjournals.org) contains supplemental material.
ABBREVIATIONS:
- ATV
- atazanavir
- PI
- protease inhibitor
- HIV
- human immunodeficiency virus
- RTV
- ritonavir
- HLM
- human liver microsomes
- P450
- cytochrome P450
- INH
- isoniazid
- KCZ
- ketoconazole
- rcf
- relative centrifugal forces
- UPLC
- ultraperformance liquid chromatography
- TOFMS
- time-of-flight mass spectrometry
- PBS
- phosphate-buffered saline
- PCA
- principal component analysis
- OPLS-DA
- orthogonal projection to latent structures-discriminant analysis
- MS/MS
- tandem mass spectrometry
- TB
- tuberculosis.
Authorship Contributions
Participated in research design: Li and Ma.
Conducted experiments: Li, Lu, and Wang.
Contributed new reagents or analytic tools: Li.
Performed data analysis: Li and Ma.
Wrote or contributed to the writing of the manuscript: Li and Ma.
References
- Baillie TA. (2006) Future of toxicology-metabolic activation and drug design: challenges and opportunities in chemical toxicology. Chem Res Toxicol 19:889–893 [DOI] [PubMed] [Google Scholar]
- Busti AJ, Hall RG, Margolis DM. (2004) Atazanavir for the treatment of human immunodeficiency virus infection. Pharmacotherapy 24:1732–1747 [DOI] [PubMed] [Google Scholar]
- Chen C, Meng L, Ma X, Krausz KW, Pommier Y, Idle JR, Gonzalez FJ. (2006) Urinary metabolite profiling reveals CYP1A2-mediated metabolism of NSC686288 (aminoflavone). J Pharmacol Exp Ther 318:1330–1342 [DOI] [PMC free article] [PubMed] [Google Scholar]
- Croom KF, Dhillon S, Keam SJ. (2009) Atazanavir: a review of its use in the management of HIV-1 infection. Drugs 69:1107–1140 [DOI] [PubMed] [Google Scholar]
- Dieckhaus CM, Thompson CD, Roller SG, Macdonald TL. (2002) Mechanisms of idiosyncratic drug reactions: the case of felbamate. Chem Biol Interact 142:99–117 [DOI] [PubMed] [Google Scholar]
- Eholié SP, Lacombe K, Serfaty L, Wendum D, Girard PM. (2004) Acute hepatic cytolysis in an HIV-infected patient taking atazanavir. AIDS 18:1610–1611 [DOI] [PubMed] [Google Scholar]
- Evans DC, Watt AP, Nicoll-Griffith DA, Baillie TA. (2004) Drug-protein adducts: an industry perspective on minimizing the potential for drug bioactivation in drug discovery and development. Chem Res Toxicol 17:3–16 [DOI] [PubMed] [Google Scholar]
- Goldsmith DR, Perry CM. (2003) Atazanavir. Drugs 63:1679–1693; discussion 1694–1675 [DOI] [PubMed] [Google Scholar]
- Guengerich FP, MacDonald JS. (2007) Applying mechanisms of chemical toxicity to predict drug safety. Chem Res Toxicol 20:344–369 [DOI] [PubMed] [Google Scholar]
- Haas DW, Koletar SL, Laughlin L, Kendall MA, Suckow C, Gerber JG, Zolopa AR, Bertz R, Child MJ, Hosey L, et al. (2009) Hepatotoxicity and gastrointestinal intolerance when healthy volunteers taking rifampin add twice-daily atazanavir and ritonavir. J Acquir Immune Defic Syndr 50:290–293 [DOI] [PMC free article] [PubMed] [Google Scholar]
- Havlir DV, O'Marro SD. (2004) Atazanavir: new option for treatment of HIV infection. Clin Infect Dis 38:1599–1604 [DOI] [PubMed] [Google Scholar]
- Ji T, Ikehata K, Koen YM, Esch SW, Williams TD, Hanzlik RP. (2007) Covalent modification of microsomal lipids by thiobenzamide metabolites in vivo. Chem Res Toxicol 20:701–708 [DOI] [PMC free article] [PubMed] [Google Scholar]
- Li F, Wang L, Guo GL, Ma X. (2010) Metabolism-mediated drug interactions associated with ritonavir-boosted tipranavir in mice. Drug Metab Dispos 38:871–878 [DOI] [PMC free article] [PubMed] [Google Scholar]
- Nicholls AW, Holmes E, Lindon JC, Shockcor JP, Farrant RD, Haselden JN, Damment SJ, Waterfield CJ, Nicholson JK. (2001) Metabonomic investigations into hydrazine toxicity in the rat. Chem Res Toxicol 14:975–987 [DOI] [PubMed] [Google Scholar]
- O'Brien PJ, Siraki AG, Shangari N. (2005) Aldehyde sources, metabolism, molecular toxicity mechanisms, and possible effects on human health. Crit Rev Toxicol 35:609–662 [DOI] [PubMed] [Google Scholar]
- Rivas P, Morello J, Garrido C, Rodríguez-Nóvoa S, Soriano V. (2009) Role of atazanavir in the treatment of HIV infection. Ther Clin Risk Manag 5:99–116 [PMC free article] [PubMed] [Google Scholar]
- Spahn-Langguth H, Benet LZ. (1992) Acyl glucuronides revisited: is the glucuronidation process a toxification as well as a detoxification mechanism? Drug Metab Rev 24:5–47 [DOI] [PubMed] [Google Scholar]
- Sulkowski MS. (2004) Drug-induced liver injury associated with antiretroviral therapy that includes HIV-1 protease inhibitors. Clin Infect Dis 38 (Suppl 2):S90–S97 [DOI] [PubMed] [Google Scholar]
- Swainston Harrison T, Scott LJ. (2005) Atazanavir: a review of its use in the management of HIV infection. Drugs 65:2309–2336 [DOI] [PubMed] [Google Scholar]
- Tang W, Lu AY. (2010) Metabolic bioactivation and drug-related adverse effects: current status and future directions from a pharmaceutical research perspective. Drug Metab Rev 42:225–249 [DOI] [PubMed] [Google Scholar]
- ter Heine R, Hillebrand MJ, Rosing H, van Gorp EC, Mulder JW, Beijnen JH, Huitema AD. (2009) Identification and profiling of circulating metabolites of atazanavir, a HIV protease inhibitor. Drug Metab Dispos 37:1826–1840 [DOI] [PubMed] [Google Scholar]
- Waterfield CJ, Turton JA, Scales MD, Timbrell JA. (1993) Investigations into the effects of various hepatotoxic compounds on urinary and liver taurine levels in rats. Arch Toxicol 67:244–254 [DOI] [PubMed] [Google Scholar]
Associated Data
This section collects any data citations, data availability statements, or supplementary materials included in this article.


