Abstract
A recent X-ray crystal structure of a rabbit cytochrome P450 2B4 (CYP2B4)-ticlopidine complex indicated that the compound could be modeled with either the thiophene or chlorophenyl group oriented toward the heme prosthetic group. Subsequent NMR relaxation and molecular docking studies suggested that orientation with the chlorophenyl ring closer to the heme was the preferred one. To evaluate the predictive value of these findings, the oxidation of ticlopidine by reconstituted CYP2B4 was studied and compared with CYP2B6, in which the thiophene portion of the molecule likely orients toward the heme. In vitro incubation of ticlopidine with both enzymes yielded the same set of metabolites: 7-hydroxyticlopidine (M1), 2-oxoticlopidine (M2), 5-(2-chlorobenzyl)thieno[3,2-c]pyridin-5-ium metabolite (M3), 5-(2-chlorobenzyl)thieno[3,2-c]pyridin-5-ium metabolite (M4), ticlopidine N-oxide (M5), and ticlopidine S-oxide dimer, a dimerization product of ticlopidine S-oxide (M6). The rates of metabolite formation deviated markedly from linearity with time, consistent with the known inactivation of CYP2B6 by ticlopidine. Fitting to a first-order equation yielded similar rate constants (kobs) for both enzymes. However, the amplitude (Rmax) of M1 and M6 formation was 4 to 5 times higher for CYP2B6 than CYP2B4, indicating a greater residence time of ticlopidine with its thiophene ring closer to heme in CYP2B6. In contrast, CYP2B4 formed M4 and M5 in more abundance than CYP2B6, indicating an alternate orientation. Overall, the results suggest that the preferential orientation of ticlopidine in the active site of CYP2B4 predicted by X-ray crystallography and NMR studies is unproductive and that ticlopidine likely reorients within CYP2B4 to a more productive mode.
Introduction
Cytochromes P450 (P450s) constitute a superfamily of heme-containing proteins that play a predominant role in the oxidative metabolism of xenobiotics (Johnson and Stout, 2005). Of the 57 identified human P450s, CYP1A2, CYP2A6, CYP2B6, CYP2C8, CYP2C9, CYP2C19, CYP2D6, CYP2E1, and CYP3A4 are mainly involved in the metabolism of drugs (Lewis and Ito, 2008). CYP2B6 constitutes approximately 6% of the total human liver P450 and metabolizes a number of important pharmaceuticals (Guengerich, 2005). Moreover, recent crystal structure analysis of a genetic variant of CYP2B6 in the presence of 4-(4-chlorophenyl)imidazole provided the first atomic level view of this P450 (Gay et al., 2010a). In the past few years, a series of crystal structures of rabbit CYP2B4, which shares 78% sequence identity with CYP2B6, revealed the remarkable plasticity that these enzymes exhibit to accommodate various small imidazole-based inhibitors such as 4-(4-chlorophenyl)imidazole or 1-(4-chlorophenyl)imidazole, as well as the bulkier ligands bifonazole or 1-(4-phenyl)benzylimidazole (Scott et al., 2004; Zhao et al., 2006, 2007; Gay et al., 2009). Very recently, crystallization and structure determination of CYP2B4 in complex with the antiplatelet drugs ticlopidine and clopidogrel, which are not anchored to the heme iron by a coordinate bond, helped to further understand CYP2B plasticity and catalytic function (Gay et al., 2010b).
In addition to being a potent thienopyridine antiplatelet drug, ticlopidine is a strong mechanism-based inhibitor of CYP2B6 (Richter et al., 2004) and CYP2C19 (Ha-Duong et al., 2001). It is used to prevent atherothrombosis by irreversibly inhibiting ADP binding to the platelet receptor P2Y12 (Sharis et al., 1998; Kam and Nethery, 2003), and it also prevents platelet aggregation and reduces the risk of cardiovascular, cerebrovascular, and peripheral vascular diseases (Richter et al., 2004). However, there is substantial incidence of harmful side-effects, including, but not limited to, agranulocytosis (Ono et al., 1991), aplastic anemia (Mataix et al., 1992), thrombocytopenia (Steinhubl et al., 1999), and ticlopidine-induced hepatotoxicity (Grieco et al., 1998). This drug is extensively metabolized in humans and animals by P450s (Onyeji et al., 1999; Farid et al., 2010) via N-dealkylation, N-oxidation, S-oxidation, and oxidation of the tetrahydropyridine and the thiophene ring (Tuong et al., 1981; Panak et al., 1983; Ha-Duong et al., 2001; Dalvie and O'Connell, 2004). Human metabolism of ticlopidine is primarily catalyzed by CYP3A4, CYP2C19, and CYP2B6 (Farid et al., 2010). Recent studies have indicated that the oxidation of the thiophene ring of ticlopidine is important for the formation of reactive metabolites, resulting in inhibition of CYP2B6 (Nishiya et al., 2009), CYP2C19, and CYP2D6 (Ko et al., 2000; Walsky et al., 2006; Farid et al., 2010). Despite previous studies, which inferred that the primary human P450-mediated metabolic pathway of ticlopidine is via the formation of pharmacologically active 2-oxoticlopidine (M2) and/or ticlopidine S-oxide, no formal studies have been conducted to show the specific metabolites formed by CYP2B6.
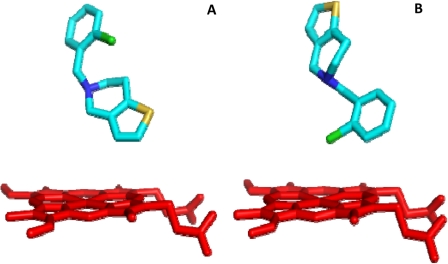
In our recent crystal structure of the CYP2B4-ticlopidine complex, the preferred orientation of the drug in the active site (Fig. 1, A and B) was not clear from the electron density. Further studies involving NMR relaxation and molecular docking suggested that the major orientation is with the chlorophenyl ring closer to the heme (Gay et al., 2010b), which is not consistent with the major products hypothesized for CYP2B6. In the present study, the specific metabolites of ticlopidine produced by CYP2B6 were identified for the first time and compared with those formed by metabolism of ticlopidine by CYP2B4. The products are correlated with predictions from X-ray crystallography, modeling, and NMR relaxation studies, and the insights gained are used to propose chemical mechanisms for metabolite formation, including those involved in the antiplatelet action and P450 inactivation.
Fig. 1.
Ribbon-and-stick diagram of CYP2B4-ticlopidine complex (3KW4) showing the two different orientations of ticlopidine in the active site. The heme moiety is shown in red, and ticlopidine is shown in cyan. A, thiophene ring in close proximity to the heme; B, chlorophenyl group in close proximity to the heme.
Materials and Methods
Materials.
Ticlopidine hydrochloride, reduced β-NADPH, buspirone, bupropion, and Tris-HCl were purchased from Sigma-Aldrich (St. Louis, MO). 7-Hydroxy-4-(trifluoromethyl) coumarin, 7-ethoxy-4-(trifluoromethyl) coumarin (7-EFC), and 7-methoxy-4-trifluoromethylcoumarin were purchased from Invitrogen (Carlsbad, CA). 5-Cyclo-hexylpentyl-β-d-maltoside (Cymal-5) was obtained from Anatrace (Maumee OH). Recombinant NADPH cytochrome P450 reductase (CPR) was prepared as described previously (Harlow and Halpert, 1997). Macroprep CM cation exchange resin was obtained from Bio-Rad Laboratories (Hercules, CA). TOPP3 and JM109 cells were from Stratagene (La Jolla, CA). The molecular chaperone plasmid pGro7, which expresses GroES/EL, was obtained from TAKARA BIO (Shiba, Japan). Ni-NTA affinity resin was purchased from QIAGEN (Valencia, CA). Pooled human liver microsomes were prepared under contract by BD Gentest (Woburn, MA). Aliquots from the individual preparations from 60 individual human livers were pooled on the basis of equivalent protein concentrations to yield a representative microsomal pool with a protein concentration of 20.4 mg/ml (determined using the Bicinchoninic Acid Assay; Pierce, Rockford, IL). The P450 content in the pooled microsomes was 0.35 nmol/mg and was determined from the reduced CO difference spectrum (Omura and Sato, 1964). Baculovirus/insect cells expressing full-length CYP2B6 enzyme (protein concentration 15 mg/ml or 100 pmol P450/ml) were purchased from BD Biosciences (Franklin Lakes, NJ). Ticlopidine was dissolved in methanol to prepare the stock solution. All other chemicals were of the highest grade available and were obtained from standard commercial sources.
Expression and Purification.
CYP2B4 and CYP2B6 were expressed in Escherichia coli TOPP3 cells and JM109 cells, respectively (Stratagene). CYP2B6 was coexpressed with the chaperone GroES/EL (pGro7 plasmid) as described earlier (Mitsuda and Iwasaki, 2006). The expression and purification protocol used herein has been described previously (Scott et al., 2001; Kumar et al., 2007). In brief, the proteins were purified on a Ni-NTA column, which was washed with buffer containing 100 mM potassium phosphate (pH 7.4 at 4°C), 100 mM NaCl, 20% (v/v) glycerol, 10 mM 2-mercaptoethanol, 0.5 mM phenylmethylsulfonyl fluoride, 4.8 mM Cymal-5, and 1 mM histidine. The protein was eluted using 40 mM histidine in the same buffer described above. Pooled P450-containing Ni fractions were diluted 10-fold in buffer containing 5 mM potassium phosphate (pH 7.4 at 4°C), 20% (v/v) glycerol, 1 mM EDTA, 0.2 mM dithiothreitol (DTT), 0.5 mM phenylmethylsulfonyl fluoride, and 4.8 mM Cymal-5, before being loaded onto a Macroprep CM cation exchange column. The column was washed using 5 mM potassium phosphate (pH 7.4 at 4°C), 20 mM NaCl, 20% (v/v) glycerol, 1 mM EDTA, and 0.2 mM DTT, and the protein was eluted with high-salt buffer containing 50 mM potassium phosphate (pH 7.4 at 4°C), 500 mM NaCl, 20% (v/v) glycerol, 1 mM EDTA, and 0.2 mM DTT (Gay et al., 2010a). Eluted protein was dialyzed three times at 4°C against 10 mM potassium phosphate (pH 7.4) buffer containing 10% glycerol and 1 mM EDTA. The P450 content was measured from the reduced CO-difference spectrum (Omura and Sato, 1964).
Ticlopidine Metabolism.
Incubations for metabolite identification (total volume 1.0 ml) were conducted at 37°C for 60 min in 100 mM potassium phosphate buffer (pH 7.4) containing magnesium chloride (10 mM), NADPH (1 mM), and protein. The final concentration of the protein in the incubation mixture was as follows: human liver microsomes (1 mg/ml), baculovirus-expressed full-length CYP2B6, reconstituted CYP2B6, and reconstituted CYP2B4 (100 pmol/ml). The reconstituted system contained a 1:1 M ratio of protein (CYP2B6 or CYP2B4) and CPR. Reactions were initiated by addition of ticlopidine (10 μM) after preincubation of the incubation mixture for 1 min. The final concentration of organic solvent in the incubation mixture was <1%. Incubations lacking NADPH served as negative controls. Reactions were terminated by addition of 1 ml of acetonitrile followed by centrifugation at 3000g for 10 min. The supernatant was decanted to a new tube and evaporated to dryness under a stream of N2 at 35°C. The resulting residue was reconstituted in 30% acetonitrile containing 0.1% formic acid (0.200 ml), vortex mixed, and centrifuged. Aliquots (0.035 ml) of the final reconstituted mixture were analyzed by high-performance liquid chromatography (HPLC)-mass spectrometry (MS) as described below.
Kinetic Experiments.
The rates of formation of each metabolite were determined by incubating ticlopidine (1 μM) with either reconstituted CYP2B6 or reconstituted CYP2B4 (25 pmol/ml) in 100 mM phosphate buffer (pH 7.4) containing MgCl2 (10 mM). The reconstituted system contained a 1:1 M ratio of protein (CYP2B6 or CYP2B4) and CPR. The reactions were initiated by the addition of NADPH (1 mM) to the incubation mixture that had been preincubated for 1 min. After addition, 0.100-ml aliquots of the mixture were drawn at 1, 2, 3, 4, and 5 min and added to tubes containing a solution of buspirone in acetonitrile (50 nM), which was used as an internal standard. A 0.015-ml aliquot of the supernatant obtained after centrifugation of the protein was injected directly onto the HPLC-MS for determination of the peak areas. All experiments were conducted in duplicate.
HPLC-MS Analysis.
Metabolite identification.
Metabolites in the CYP2B4- and CYP2B6-mediated incubation mixtures were separated on a Luna C8(2) 100A column (3.0 μm, 150 × 2.0 mm; Phenomenex, Torrance, CA) at ambient temperature. The mobile phase consisted of 0.1% formic acid (solvent A) and acetonitrile (solvent B) and was delivered at 0.200 ml/min for 50 min. The initial composition of solvent B was maintained at 1% for 5 min and then increased in a linear manner as follows: 30% at 25 min, 50% at 35 min, and 90% at 40 min. Solvent B was then maintained at 90% for up to 45 min and then decreased to 1% in the next 2 min. The column was allowed to equilibrate at 1% solvent B for 5 min before the next injection. The HPLC effluent going to the mass spectrometer was directed to waste through a divert valve for the initial 5 min after sample injection. Mass spectrometric analyses were performed on a ThermoFinnigan LTQ ion trap mass spectrometer (Thermo Fisher Scientific, Waltham, MA), which was interfaced to an Agilent HP-1100 HPLC system (Agilent Technologies, Palo Alto, CA) and equipped with an electrospray ionization source (ESI). The parameters for the ESI source were as follows: capillary temperature 350°C; spray voltage 4.5 kV; capillary voltage 39.0 V; sheath gas flow rate 30 and auxiliary gas flow rate 5.0. The mass spectrometer was operated in a positive ion mode with data-dependent scanning. The ions were monitored over a full mass range of m/z 100 to 1000. For a full scan, the automatic gain control was set at 5.0 × 10⁸, maximum ion time was 10 ms, and the number of microscans was set at 1. For MSn scanning, the automatic gain control was set at 1.0 × 10⁸, maximum ion time was 100 ms, and the number of microscans was set at 1. For data-dependent scanning, the default charge-state was 1, default isolation width was 3.0, and the normalized collision energy was 35.0. The data obtained was analyzed using XCalibur version 2.1 software (Thermo Fisher Scientific).
Kinetic studies.
Metabolites were separated by a HPLC system consisting of PAL autosampler (Leap Technologies, Carrboro, NC) and Accela pump (Thermo Fisher Scientific) that was connected to ThermoFinnigan LTQ Velos ion trap mass spectrometer equipped with an electrospray ionization source. Chromatography was performed by injecting 0.15 ml of the supernatant on a C18 column (3.5 μm, 150 × 2.0 mm; Phenomenex) at 8°C. Elution was performed using a mobile phase of 0.1% formic acid (solvent A) and acetonitrile (solvent B), which was delivered at 0.400 ml/min for 12 min. The initial composition of solvent B was maintained at 10% and then increased as follows: 20% at 7.25 min, 30% at 8.5 min, and 90% at 8.6 min. It was then maintained at 90% for 1 min and then decreased to 10% for the next 0.4 min. The column was allowed to equilibrate at 10% solvent B for 2 min before the next injection. The HPLC effluent going to the mass spectrometer was directed to waste through a divert valve for the initial 1.25 min after sample injection. The mass spectrometer was operated in a positive ion mode. The parameters for the ESI source were as follows: capillary temperature 300°C; sheath and auxiliary gas flow rate were maintained at 50 and 18, respectively. The source voltage and source current were 3.0 kV and 100 μA, respectively. The normalized collision energy for tandem mass spectrometry (MS/MS) was 35.0%. The metabolites were detected by single reaction monitoring mode. The transitions used were m/z 280 → 125 (for 2-oxoticlopidine M2, at retention time of 4.9), m/z 280 → 262 (for hydroxyl ticlopidine M1, at retention time of 4.56 min), m/z 280 → 171 (for ticlopidine N-oxide M5, at retention time of 8.0 min), m/z 559 → 511 [for ticlopidine S-oxide dimer (TSOD) M6, at retention time of 10.3 min], and m/z 386 → 122 (for buspirone at retention time of 9.7 min). Because the authentic standards of the metabolites were not available, the rate of formation for metabolite was estimated from the plot of metabolite/buspirone peak area ratio versus time. Because the amount of product formed over time was nonlinear, it was fitted to a first-order rate equation (eqs. 1 and 2) using Sigma Plot 11 software (Khan et al., 2002).
where, r and Rmax are amplitude of the product formation at a particular time, t, and at infinity, and kobs is the observed rate constant.
Isolation of Metabolites M1, M2, M5, and M6 and NMR Analysis.
Ticlopidine metabolites were generated by the method described above except that the final volume of incubation was 60 ml. The metabolites were separated using an Agilent HP-1100 HPLC system (Agilent Technologies) and an Aqua C18, 125A column (5 μM, 10 × 250 mm; Phenomenex) and eluted using a linear gradient starting with acetonitrile at 6 and 0.1% formic acid (94%) and ramped to 70% acetonitrile over 50 min at a flow rate of 4 ml/min. Fractions were collected every 1 min throughout the run. All fractions were analyzed by mass spectrometry using the conditions described previously, and the fractions containing the same metabolite were pooled. The four pooled fractions were refractionated after HPLC separation using a Luna C8 column (4.6 × 250 mm; Phenomenex) under similar gradient conditions described above but at a flow rate of 1 ml/min. Fractions were collected every 30 s throughout the run, and those containing the metabolite were collected, combined, and evaporated under N2 using a SpeedVac concentrator (Thermo Fisher Scientific). The resulting residue was reconstituted in 0.150 ml of deuterated dimethyl sulfoxide-d6 (Cambridge Isotope Laboratories, Andover, MA) and placed in 3-mm diameter tubes for NMR experiments, and a sample (0.010 ml) was analyzed by liquid chromatography-MS/MS to examine its purity.
NMR spectra were recorded on a Bruker Avance 600 MHz system controlled by TopSpin version 2.1, equipped with a 5-mm TCI cryoprobe (Bruker, Rheinstetten, Germany). 1D NMR spectra were recorded using a sweep width of 12,000 Hz and a total recycle time of 7.2 s. The resulting time-averaged free induction decays were transformed using an exponential line broadening of 1.0 Hz to enhance signal to noise. All spectra were referenced using residual dimethyl sulfoxide-d6 (1H δ = 2.5 ppm relative to tetramethylsilane, δ = 0.00 and 13C δ = 39.5 ppm relative to tetramethylsilane, δ = 0.00). Phasing, baseline correction, and integration were all performed manually. If needed, the BIAS and SLOPE functions for the integral calculation were adjusted manually. COSY, multiplicity-edited HSQC, and HMBC data were recorded using the standard pulse sequence provided by Bruker. Two-dimensional experiments and were typically acquired using a 1K × 128 data with 16 dummy scans and a spectral width of 8000 Hz in the f2 dimension. The data were zero-filled to a size of 1K × 1K. The above process was repeated for each of the metabolites.
Mechanism-Based Inactivation of CYP2B6 and CYP2B4 by Ticlopidine Using Bupropion and 7-EFC as Substrates.
Assays were carried out according to Richter et al. (2004). The reconstituted system for the assay contained a 1:1 M ratio of protein (CYP2B6 or CYP2B4) and CPR. The mixture was preincubated for 10 min at room temperature. Ticlopidine (100 μM) dissolved in methanol was added to the reconstituted protein system in 100 mM potassium phosphate buffer (pH 7.4). The protein-ticlopidine mixture was further incubated for 2 min at 37°C, and the reaction was initiated by addition of NADPH (1 mM final concentration). A final concentration of 5 pmol enzyme preparation in 0.200 ml was used in all experiments. Aliquots (0.025 ml) of this mixture were withdrawn at 0, 1, 2, 3, 4, and 5 min and added to a secondary reaction mixture (0.225 ml) containing 100 mM potassium phosphate buffer (pH 7.4), 500 μM bupropion, and 1 mM NADPH prewarmed to 37°C. After 10 min, the reactions were quenched with 0.050 ml of a 1:1 (v/v) mixture of 2 N HCl and buspirone solution (50 nM) in acetonitrile.
The samples were centrifuged at 13,800g for 15 min, and an aliquot of the supernatant was analyzed by HPLC-MS for the residual hydroxybupropion peak. The conditions and the parameters for liquid chromatography-MS analysis of hydroxybupropion were similar to those described in the kinetic studies section (described above) except that the metabolite was monitored in single reaction monitoring mode using a transition of m/z 256 → 238. For studies using 7-EFC (100 μM) as a secondary substrate, the enzyme reconstitution and preincubation conditions were essentially the same as described above. The reaction was arrested after 10 min by the addition of 20% trichloroacetic acid followed by dilution to 1 ml with 0.1 M Tris-HCl, pH 8. The concentration of the product 7-hydroxy-4-(trifluoromethyl) coumarin was measured by a fluorescence assay as previously reported (Kumar et al., 2005).
Results
Metabolism of Ticlopidine by CYP2B4 and CYP2B6.
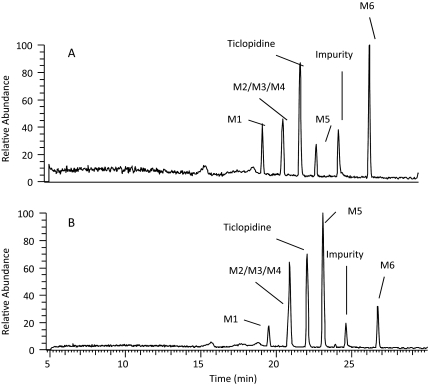
Because the metabolites formed by CYP2B6 and CYP2B4 were unknown, incubations for metabolite identification were conducted at ticlopidine concentrations of 10 μM so that all possible metabolites produced in vitro could be detected. Reconstituted CYP2B6 and CYP2B4 showed six major peaks in the full-scan chromatograms, including unchanged ticlopidine (Fig. 2). The peak at 24.5 min was a solvent-related impurity and was present in the control samples (incubation without NADPH). All other peaks were drug related, because they were absent in experiments that lacked NADPH. In addition, all these peaks revealed an isotopic-protonated molecular ion (MH+) due to 37Cl isotope, suggesting that these were ticlopidine-related products. The product profile obtained from incubations with reconstituted CYP2B6 and CYP2B4 was similar to that obtained after incubation of ticlopidine with human liver microsomes or recombinant full-length CYP2B6 expressed in baculovirus-infected insect cells (data not shown).
Fig. 2.
HPLC-MS chromatograms of mixtures after incubation of ticlopidine (10 μM) with NADPH supplemented CYP2B6 (A) and CYP2B4 (B) for 60 min. The metabolite peaks are represented as M1–M6 and the structures are shown in Fig. 5. The preparation and the experimental conditions of sample preparation are described under Materials and Methods. All the incubations contained 100 pmol of reconstituted P450.
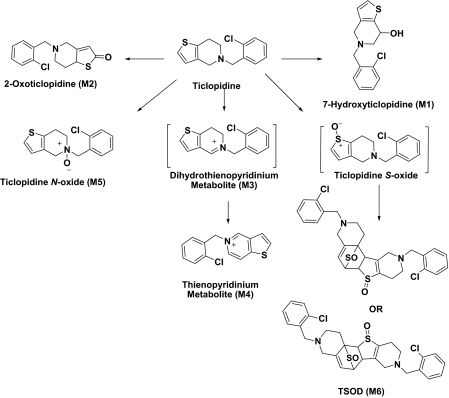
Unchanged ticlopidine eluted at 22 min and gave a protonated molecular ion (MH+) of m/z 264 (35Cl) and 266 (37Cl) in the metabolic profiles that were generated after CYP2B4 and CYP2B6 incubations (Fig. 2). The mass spectrum of MH+ ion at m/z 264 gave fragment ions at m/z 154 and 125, whereas the corresponding mass spectrum of MH+ at m/z 266 gave fragment ions at m/z 156 and 127 (Table 1). These ions were most likely due to the chlorobenzyl group (fragment a in Table 1) and chlorobenzyl methyliminium moiety in ticlopidine (fragment b in Table 1). The peaks at 19.5, 20.8, and 23 min gave a molecular ion at m/z 280, an addition of 16 atomic mass units (amu) to the molecular ion, suggesting hydroxylation of ticlopidine. The mass spectrum (MS2) of hydroxyticlopidine (M1) at m/z 280 showed a major fragment ion at m/z 262 and a minor fragment ion at m/z 154 (Table 1). Further fragmentation of the ion m/z 262 in a data-dependent manner (MS3) resulted in a major fragment ion at m/z 125. The ion at m/z 262 resulted from loss of a water molecule from m/z 280, suggesting that the position of hydroxylation in this metabolite was possibly on the tetrahydropyridine portion of ticlopidine. The ions at m/z 154 in the MS2 spectrum and m/z 125 in the MS3 spectrum were similar to those observed in the mass spectrum of ticlopidine (Table 1). The MS2 and MS3 mass spectra obtained from on MH+ at m/z 282 that contained 37Cl isotope showed fragment ions at m/z 264, 156, and 127, further indicating that this product was hydroxylated on the tetrahydropyridine ring of ticlopidine.
TABLE 1.
Molecular ions (35Cl or 37Cl) and mass spectral fragment ions of ticlopidine and its metabolites following incubation of ticlopidine with CYP2B4 and CYP2B6
| Metabolite | Structure | Molecular Ions |
Fragment Ions |
||||
|---|---|---|---|---|---|---|---|
| MH+ | a | b | c | d | e | ||
| Ticlopidine | 264 | 125 | 154 | ||||
| 266 | 127 | 156 | |||||
| M1 Hydroxyticlopidine | 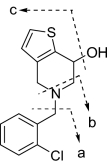 |
280 | 125 | 154 | 262 | ||
| 282 | 127 | 156 | 264 | ||||
| M2 2-Oxoticlopidine | 280 | 125 | 154 | ||||
| 282 | 125 | 154 | |||||
| M3 Dihydropyridinium Metabolite | 262 | 125 | |||||
| 264 | 127 | ||||||
| M4 Thienopyridinium Metabolite | 260 | 125 | |||||
| 262 | 127 | ||||||
| M5 Ticlopidine N-oxide | 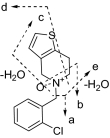 |
280 | 125 | 170 | 262 | 235 | 138 |
| 282 | 127 | 172 | 264 | 237 | 138 | ||
| M6a TSOD |
 or or 
|
559 | See Fig. 3 | ||||
The positional isomers of TSOD could not be differentiated by the MS spectrum.
For M2, the mass spectrum of MH+ at m/z 280 and 282 resulted in one major fragment ion at m/z 125 and 127, respectively. This addition of 16 amu indicated insertion of oxygen into the molecule, but the lack of an ion resulting from loss of a water molecule in the mass spectra suggested that either the chlorobenzyl group or the thiophene ring was modified. Modification of the chlorobenzyl group was ruled out by the presence of a fragment ion at m/z 125 (or 127) in the mass spectrum of M2. Thus, the thiophene moiety was the most likely site of modification (Table 1). Although the exact position of hydroxylation on the thiophene ring could not be ascertained from this data, the metabolite was consistent with the structure of hydroxyticlopidine that was reported previously (Dalvie and O'Connell, 2004; Shimizu et al., 2009).
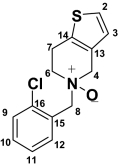
The mass spectrum of ticlopidine N-oxide (M5) at m/z 280 gave fragment ions at m/z 262, 235, 170, 138, and 125. The fragment ions at m/z 262 and 125 and the presence of corresponding isotopic ions at m/z 264 and 127 in the mass spectrum of m/z 282 were similar to those observed in the mass spectrum of hydroxyticlopidine (M1), suggesting modification of carbons or the nitrogen atom of the tetrahydropyridine ring. The fragment ions at m/z 235 and 170 in the mass spectrum of m/z 280 ion and the corresponding ions at m/z 237 and 172 in the mass spectrum of m/z 282 suggested that the nitrogen or the carbon atom at the 4 position of the tetrahydropyridine ring was modified. The structures of these metabolites were confirmed by NMR after isolation of these compounds (Table 2; Supplemental Fig. S1). The peak at 20.8 min also showed two additional drug-related MH+ at m/z 262 and 260 corresponding to dihydrothienopyridinium (M3) and thienopyridinium (M4) metabolites (Fig. 2) that were 2 and 4 amu lower than the molecular ion of ticlopidine, respectively. The molecular ions and the fragments observed in the mass spectra of these two metabolites were consistent to that originally characterized (Table 1) (Dalvie and O'Connell, 2004).
TABLE 2.
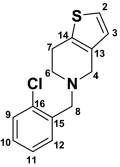
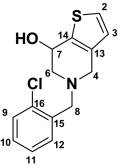
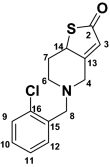
1H and 13C NMR (δ) chemical shift assignments of ticlopidine, hydroxyticlopidine (M1), 2-oxoticlopidine (M2), and ticlopidine N-oxide (M5)
The 13C chemical shifts for positions 13, 14, 15, and 16 were not assigned. 13C NMR for ticlopidine N-oxide (M5) was not assigned due to insufficient sample. NMR spectra shown in the Supplemental Fig. S1.
| Position |
 Ticlopidine Ticlopidine |
 Hydroxyticlopidine (M1) Hydroxyticlopidine (M1) |
 2-Oxoticlopidine (M2) 2-Oxoticlopidine (M2) |
 Ticlopidine N-Oxide (M5) Ticlopidine N-Oxide (M5) |
|||||||
|---|---|---|---|---|---|---|---|---|---|---|---|
| Chemical Shifts |
Chemical Shifts |
Chemical Shifts |
Chemical Shift |
||||||||
| 1H (δ) | J (Hz) | 13C (δ) | 1H (δ) | J (Hz) | 13C (δ) | 1H (δ) | J (Hz) | 13C (δ) | 1H (δ) | J (Hz) | |
| 2 | 7.45 (d, 1H) | 5.2 | 125.4 | 7.38 (d, 1H) | 5.2 | 124.7 | 198.4 | 7.27 (d, 1H) | 5.0 | ||
| 3 | 6.92 (d, 1H) | 5.2 | 125.1 | 6.79 (d, 1H) | 5.2 | 124.7 | 6.23 (s, 1H) | 124.8 | 6.78 (d, 1H) | 5.0 | |
| 4 | 4.28 (bd, 2H) | 15.7 | 44.9 | 3.44–3.57 (d, 2H) | 14.7 | 52.3 | 3.08–3.81 (d, 2H) | 12.7 | 53.4 | 2.78–3.50 (m, 2H) | |
| 6 | 3.53–3.69 (bs, 2H) | 48.9 | 2.46–2.96 (dd, 2H) | 11.2, 5.1 | 58.4 | 2.48–2.93 (d, 2H) | 12.0 | 51.2 | 3.72 (m, 2H) | ||
| 7 | 3.11–3.22 (bs, 2H) | 21.7 | 4.7 (t, 1H) | 6.7 | 63.5 | 1.63–2.40 (dd, 2H) | 12.6 | 33.6 | 2.66–2.94 (m, 2H) | ||
| 8 | 4.6 (bs, 2H) | 54.5 | 3.76–3.8 (d, 2H) | 14.1 | 57.1 | 3.69, 3.73 (d, 2H) | 14.5 | 56.4 | 3.76 (s, 2H) | ||
| 9 | 7.59 (d, 1H) | 7.8 | 130.0 | 7.44 (dd, 1H) | 8.7, 1.4 | 128.7 | 7.29–7.50 (m, 4H) | 127.3 | 7.29–7.50 (m, 4H) | ||
| 10 | 7.50 (m, 1H) | 131.5 | 7.27 (m, 1H) | 128.2 | 127.8 | ||||||
| 11 | 7.46 (m, 1H) | 7.46 | 127.5 | 7.34 (m, 1H) | 127.1 | 129.4 | |||||
| 12 | 8.06 (d, 1H) | 7.6 | 134.0 | 7.58 (dd, 1H) | 7.6, 1.8 | 134.0 | 131.6 | ||||
s, singlet; bs, broad singlet; d, doublet; bd, broad doublet; dd, doublet of doublets; m, multiplet; t, triplet.
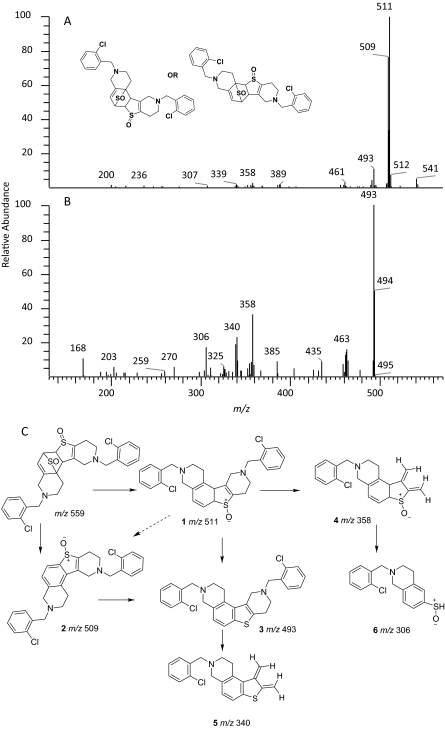
The peak TSOD (M6) eluting at 26.7 min in the chromatogram gave MH+ at m/z 559. This result was similar to the molecular ion of a TSOD, originally proposed by Ha-Doung et al. (2001). The peak also showed a corresponding molecular ion at m/z 561, which was ∼70% of the molecular ion at m/z 559, indicating the presence of two chlorine atoms. The mass spectrum of m/z 559 showed major fragment ions at m/z 511 and 509 in the MS2 spectra (Fig. 3A). The data-dependent mass spectrum (MS3) of the fragment ion at m/z 511 resulted in fragment ions at m/z 493, 358, 340, and 306 (Fig. 3B). The ion 1 at m/z 511 indicated a loss of 48 amu (loss of sulfur monoxide) from m/z 559, whereas the ion at m/z 509 indicated a loss of 50 amu and was formed after aromatization (2) (Fig. 3C). As shown, fragment ion 3 at m/z 493 was possibly formed after a loss of water from m/z 511 or a loss of 16 amu from m/z 509. The latter is characteristic of N-oxides (Dalvie and O'Connell, 2004) or S-oxides (Dansette et al., 2009), which lose 16 or 17 amu. The fragment ions at m/z 511 and 493 yielded the corresponding ions 4 and 5 at m/z 358 and 340, indicating loss of the 153 amu corresponding to a chlorobenzylmethylimine moiety. Finally, the fragment ion 6 at m/z 306 was the result of loss of 52 amu from m/z 358 (Fig. 3C). The mass spectrum obtained from the molecular ion that contained the 37Cl isotope (m/z 561) showed ions corresponding to fragments 1 to 6 that were 2 amu heavier (data not shown). This mass spectral interpretation supported the structure of TSOD. Further structure confirmation of TSOD was obtained from its NMR spectrum after isolation of the metabolite (Table 3; Supplemental Fig. S1). The positional isomers of TSOD could not be differentiated from either MS or the NMR spectra. The presence of TSOD in the incubation mixtures indicated the likelihood of formation of ticlopidine S-oxide by CYP2B6 and CYP2B4. This inference was based on previous reports which indicated that the unstable ticlopidine S-oxide can readily dimerize via a cycloaddition reaction (Ha-Duong et al., 2001).
Fig. 3.
Mass spectra of TSOD (M6) in a positive ion mode. A, MS/MS spectrum of m/z 559 ion (MH+ containing 35Cl isotope. B, mass spectrum of m/z 559 ion (MS3) obtained in a data-dependent mode after fragmentation of m/z 511 ion. C, structures of fragment ions observed in the MS/MS and MS3 spectra of m/z 559. The proposed structure of only one isomer is shown. The positional isomers of TSOD could not be differentiated from the mass spectral fragment ions.
TABLE 3.
1H and 13C NMR (δ) chemical shift assignments of TSOD (M6)
The positional isomers of TSOD could not be differentiated by NMR data. 13C chemical shifts for positions 24 to 30 were not assigned. NMR spectrum shown in Supplemental Fig. S1.
 or or 
| |||
|---|---|---|---|
| TSOD (M6) | |||
| Chemical Shifts |
|||
| 1H (δ) | J (Hz) | 13C (δ) | |
| 2 | 4.09 (m, 1H) | 61.4 | |
| 3 | 5.94 (m, 1H) | 118.9 | |
| 4 | 3.17–3.25 (d, 2H) | 15.2 | 52.6 |
| 6 | 2.23–2.83 (m, 2H) | 48.5 | |
| 7 | 2.21–2.39 (m, 2H) | 23.2 | |
| 8, 20 | 3.56–3.76 (m, 4H) | 14.4, 14.0 | 56.9, 57.8 |
| 9, 21 | 7.28–7.50 (m, 8H) | 126.9 | |
| 10, 22 | 128.5 | ||
| 11, 23 | 129.1 | ||
| 12, 24 | 130.5 | ||
| 13 | 74.9 | ||
| 14 | 3.88 (dd, 1H) | 7.9, 2.5 | 56.8 |
| 15 | 2.05–2.21 (m, 2H) | 23.8 | |
| 16 | 2.44–2.63 (m, 2H) | 48.9 | |
| 17 | 3.37–3.54 (d, 2H) | 16.8 | 52.8 |
| 18 | 4.72 (dd, 1H) | 7.8, 3.8 | 60.4 |
d, doublet; dd, doublet of doublets; m, multiplet.
Kinetic Studies.
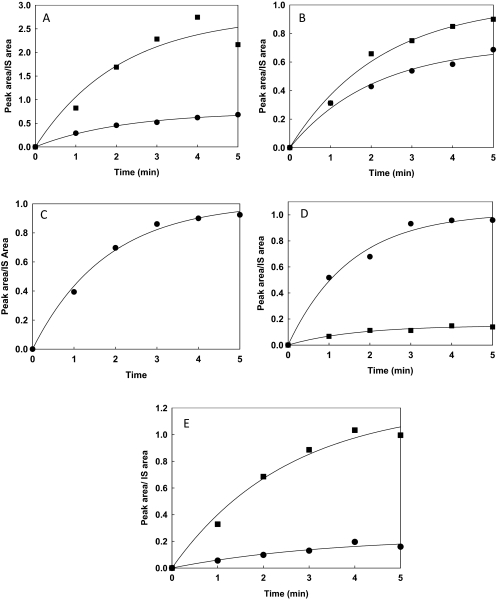
Rates of formation of all ticlopidine metabolites observed in reactions with CYP2B4 or CYP2B6 were determined to make a quantitative comparison of the metabolism profiles of the enzymes. Quantitative incubations were performed using ticlopidine concentrations of 1 μM. Because the synthetic standards of the metabolites were not available, the ratio of the peak area of each metabolite to the peak area of the buspirone peak used as internal standard, termed peak area ratio, was used to determine the kinetic constants for each product. Figure 4 shows the peak area ratio versus time profile of each metabolite. All metabolites were formed in a nonlinear fashion by both enzymes.
Fig. 4.
Kinetics of formation of ticlopidine metabolites by CYP2B6 and CYP2B4. The details of the time-dependent metabolite formation by CYP2B6 and CYP2B4 are described under Materials and Methods. The solid lines through the experimental data points show the fit to the first-order exponential rate equation, r = Rmax [1 − exp (−kobs × t)]. The fitting was done using Sigma Plot 11 as described under Materials and Methods. A to E represent the plot of peak area/internal standard (IS) area versus time. In particular, A, hydroxyticlopidine (M1); B, 2-oxoticlopidine (M2); C, thienopyridinium metabolite (M4); D, ticlopidine N-oxide (M5); E, TSOD (M6); ■, CYP2B6; ●, CYP2B4. All experiments were run in duplicate.
The parameters Rmax and kobs were calculated by fitting the experimental data to eq. 2. The rate of product formation decreased as a function of time (t), consistent with enzyme inactivation. Thus, the kobs obtained by this fit would be equal to the rate constant for enzyme inactivation, as shown previously with CYP3A4 and midazolam (Khan et al., 2002). For both CYP2B4 and CYP2B6, kobs for all metabolites (M1 through M6) ranged from 0.4 to 0.6 min−1 (Table 2) and were comparable with inactivation constants obtained in previous studies with ticlopidine (Richter et al., 2004; Nishiya et al., 2009). The Rmax values for M1 and M6 were ∼4- and 5-fold greater in incubations with CYP2B6 than those catalyzed by CYP2B4 (Table 4). In contrast, CYP2B4 formed ticlopidine N-oxide (M5) in 7-fold greater amounts than CYP2B6. Even though the thienopyridinium metabolite (M4) was detected in incubations containing CYP2B6 and CYP2B4, its kobs and Rmax could only be estimated in incubations containing CYP2B4 (Table 4). Because the dihydropyridinium metabolite (M3) is unstable and can be auto-oxidized to the thienopyridinium metabolite (M4) (Dalvie and O'Connell, 2004), its formation in the two incubations could not be measured accurately.
TABLE 4.
Observed rate constants (kobs) and amplitude of product formation (Rmax) for ticlopidine metabolites; hydroxyticlopidine (M1), 2-oxoticlopidine (M2), thienopyridinium metabolite (M4), ticlopidine N-oxide (M5), and TSOD (M6) after incubation of ticlopidine with CYP2B4 and CYP2B6
| CYP2B4 |
CYP2B6 |
|||
|---|---|---|---|---|
| kobs min−1 | Rmax | kobs min−1 | Rmax | |
| Hydroxyticlopidine (M1) | 0.49 | 0.74 | 0.48 | 2.78 |
| 2-Oxoticlopidine (M2) | 0.48 | 0.72 | 0.50 | 0.94 |
| Thienopyridinium (M4) | 0.56 | 1.00 | N.D. | N.D. |
| Ticlopidine N-oxide (M5) | 0.66 | 1.02 | 0.61 | 0.15 |
| TSOD (M6) | 0.42 | 0.23 | 0.39 | 1.23 |
N.D., not determined because a trace of M4 was observed during analysis of the samples at each sampling time.
Inactivation of CYP2B4 and CYP2B6 by Ticlopidine.
To assess inactivation of the enzymes directly, preincubations were carried out at a single concentration of ticlopidine (1 μM) and residual activity was measured using bupropion or 7-EFC (Talakad et al., 2010). Enzyme inactivation followed pseudo–first-order kinetics, and the kinact was derived from the negative slope of the lines. The kinact values for CYP2B4 and CYP2B6 when bupropion was used as a substrate were 0.08 and 0.32 min−1, respectively (Table 5). Relatively lower kinact values of 0.02 min−1 for CYP2B4 and 0.1 min−1 for CYP2B6 were observed with 7-EFC as the substrate.
TABLE 5.
Inactivation rate constants (kinact) of ticlopidine, bupropion, and 7-ethoxy-4-trifluoromethylcoumarin for CYP2B4 and CYP2B6
| Compounds | CYP2B4 |
CYP2B6 |
|---|---|---|
| kinact min−1 | kinact min−1 | |
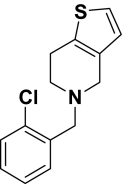 Ticlopidine |
0.50a | 0.52a |
 Bupropion |
0.08 | 0.32 |
 7-Ethoxy-4-trifluoromethylcoumarin |
0.02 | 0.10 |
Average of kobs determined by fitting the nonlinear time courses of metabolite formation.
Discussion
This study establishes for the first time the specific metabolites of ticlopidine produced by CYP2B6 and CYP2B4, correlates the products with predictions from X-ray crystallography, modeling, and NMR relaxation studies, and proposes chemical mechanisms for metabolite formation. The results presented here indicated that reconstituted CYP2B6 and CYP2B4 generated multiple and similar metabolites but in different ratios. Figure 5 depicts the metabolites of ticlopidine formed by these two enzymes. As shown, the major metabolic sites of ticlopidine metabolism were the tetrahydropyridine and the thiophene rings. The modification of the tetrahydropyridine ring yielded 7-hydroxyticlopidine (M1), dihydrothienopyridinium metabolite (M3), thienopyridinium metabolite (M4), and ticlopidine N-oxide (M5) (Fig. 5), whereas the thiophene ring was oxidized to 2-oxoticlopidine (M2) and TSOD (M6), a dimerization product of ticlopidine S-oxide (Fig. 5). The latter result also suggested that both CYP2B6 and CYP2B4 were capable of forming ticlopidine S-oxide like CYP2C19 (Ha-Duong et al., 2001).
Fig. 5.
Metabolic scheme of ticlopidine after incubations with reconstituted CYP2B4 and CYP2B6. The positional isomers of TSOD could not be differentiated from MS and NMR data. The metabolites detected were similar to those observed in incubations with human liver microsomes and CYP2B6 Supersomes from Gentest.
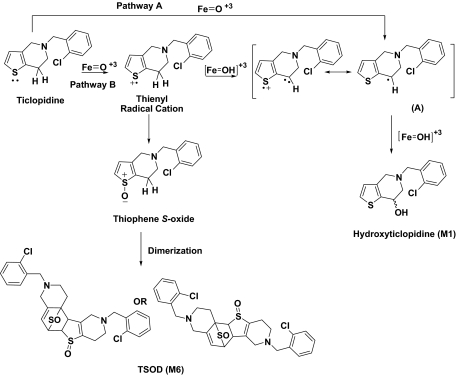
Given the similarity in the overall metabolites produced, kinetic studies were conducted to assess the differences in the rates of each metabolite formation by the two P450s. In all cases, time courses of product formation were nonlinear (Fig. 4), which is consistent with previous studies that demonstrated inactivation of CYP2B6 by ticlopidine (Richter et al., 2004). Therefore, the data were fit to an exponential equation, from which the observed rate constants (kobs) for formation of each metabolite and the amplitude (Rmax) of each metabolite formed by these two reconstituted enzymes systems were derived. The kobs values were the same for all products and both enzymes, whereas examination of Rmax revealed differences in the abundances of M1, M4, M5, and M6 (Table 4). A 5-fold higher Rmax of M6 formation by CYP2B6 than CYP2B4 (Table 4) was consistent with the increased residence time of ticlopidine in an orientation in which the thiophene ring was closer to the heme moiety in the CYP2B6 active site, as proposed by prior docking studies (Richter et al., 2004; Gay et al., 2010a). This inference was supported by the fact that M6 is a measure of ticlopidine S-oxide formation (Ha-Duong et al., 2001), which in turn is formed via oxidation of the sulfur atom in the thiophene ring (Fig. 6). The S-oxidation step is only feasible if the sulfur atom of the thiophene ring is in close proximity to the activated oxygen species in the active site.
Fig. 6.
Mechanism for formation of hydroxyticlopidine (M1) and TSOD (M6) by CYP2B6.
In addition to M6, the Rmax for hydroxyticlopidine (M1) formation also showed a 4-fold difference between CYP2B6 and CYP2B4 (Table 4). A most accepted mechanism for conventional hydrocarbon hydroxylation generally involves a hydrogen atom abstraction/oxygen rebound mechanism (Fig. 6, Pathway A). Thus, formation of M1 implied that one of the binding modes in the CYP2B6 active site brings the carbon atom vicinal to the thiophene ring in close proximity of the heme iron. However, an alternative mechanism for the formation M1 could also be envisioned (Fig. 6, Pathway B). This pathway by P450 could involve initial abstraction of an electron from the thiophene sulfur atom to yield a thienyl radical cation. Subsequent rearrangement of the thienyl radical cation via deprotonation from the carbon atom vicinal to the thiophene ring could produce a carbon radical (A). This radical intermediate could then combine with the iron bound oxygen to yield the corresponding alcohol M1. Thus, this mechanism, which is analogous to reactions involving oxidation of nitrogen-containing compounds, can lead to the formation of ticlopidine S-oxide or M1 (Fig. 6), depending upon the differential partitioning of the thienyl radical cation intermediate. Therefore, this result supports the orientation in which the thiophene ring is closer to the heme in the active site of CYP2B6.
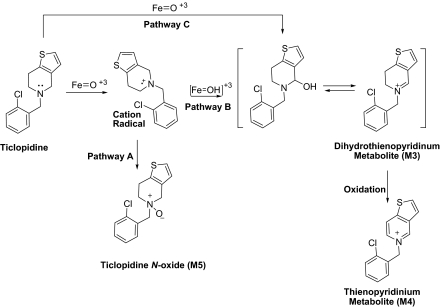
In contrast, Rmax for the formation of M5 by CYP2B4 was 7-fold higher than CYP2B6, and M4 was only measurable in the CYP2B4-mediated incubations. These findings suggest that one of the productive binding modes of ticlopidine in the CYP2B4 active site was an orientation in which the tetrahydropyridine ring was in close proximity to the heme. As shown in Fig. 7, one possible mechanism for formation of M4 and M5 involves oxidation of the nitrogen atom to a cation radical, which could collapse to form an N-oxide (Fig. 7, Pathway A) or yield M4 (Fig. 7, Pathway B). Alternatively, carbon hydroxylation could occur by an independent hydrogen atom abstraction/oxygen rebound pathway (Fig. 7, Pathway C). In either case, this ticlopidine would require the nitrogen atom or its vicinal carbon to be in proximity to the activated oxygen species in the active site of CYP2B4.
Fig. 7.
Mechanism for formation of thienopyridinium metabolite (M4) and ticlopidine N-oxide (M5) by CYP2B4.
As noted previously, incubations of ticlopidine with reconstituted CYP2B4 also revealed the formation of 2-oxoticlopidine (M2) and hydroxyticlopidine (M1). Although Rmax of M1 formation by CYP2B4 was 4-fold less than CYP2B6, the Rmax for M2 formation by the two enzymes was almost similar (0.72 and 0.94 for CYP2B4 and CYP2B6, respectively) (Table 4). These results suggested that ticlopidine could also occupy the active site of CYP2B4 in a binding mode that is similar to the one described for CYP2B6, with the thiophene ring positioned down toward the heme. The results and the formation of M6 were also consistent with the previous studies, which suggested that the thiophene ring could transiently interact with the heme in the CYP2B4 active site (Gay et al., 2010b).
It is noteworthy that there was no indication of hydroxylation of the chlorophenyl ring by the CYP2B4. This result suggested that even though ticlopidine forms a stable complex with CYP2B4 in an orientation that has its chlorophenyl ring in close proximity to the heme, this reaction is not a catalytically active binding mode. It is possible that in the presence of NADPH-cytochrome P450 reductase and/or after reduction of CYP2B4, ticlopidine reorients within the active site 2B4 to a more dynamic mode that brings reactive sites like the nitrogen atom of the tetrahydropyridine ring or the thiophene ring in close proximity to the activated oxygen species. Similar assumptions have been made on the binding of nicotine to P450cam (Strickler et al., 2003). Despite models that explain the distribution of monooxygenation products of nicotine, the crystal structure of the complex has indicated that the primary binding mode of nicotine is unproductive. Alternatively, the lack of oxidation products of the chlorophenyl ring of ticlopidine may be attributed to low reactivity. Accordingly, an assessment of reactivity of ticlopidine molecule using local reactivity descriptors such as the Fukui functions (Beck, 2005) suggested that the chlorophenyl ring was a less reactive group than other atoms and functionalities (data not shown).
As mentioned under Results, due to observation of nonlinear behavior of metabolite formation in the kinetic studies, a direct assessment of the inactivation of CYP2B4 and CYP2B6 was also conducted using bupropion and 7-EFC as substrates. Interestingly, the kinact determined using bupropion and especially 7-EFC as the secondary substrate was found to be less than the kinact inferred from the time course of ticlopidine oxidation. The obtained results are consistent with an earlier report that showed differential impairment of the catalytic activity of 4-(tert-butyl)-phenylacetylene-modified CYP2B4, depending on whether the secondary substrate was 7-EFC, benzphetamine, or testosterone (Zhang et al., 2009). The observed variation in the kinact may be due to the size or geometry of the secondary substrate in the active site. Because the molar volumes (http://www.molinspiration.com/) of ticlopidine, 7-EFC, and bupropion are 228.8 Å3, 221.7 Å3, and 228.5Å3, respectively, the variation in the kinact is likely due to the orientation or geometry of the secondary substrate bupropion or 7-EFC in the active site. In addition, the kinact values for CYP2B4 with the same substrates were ∼4- and ∼5-fold lower than CYP2B6, respectively. This result might be related to the larger active site cavity (582 versus 253 Å) of CYP2B6 compared with CYP2B4 (Gay et al., 2010c).
In conclusion, the results from these studies are in line with the involvement of multiple binding modes of ticlopidine in CYP2B6 and CYP2B4. The data presented herein suggest that even though the experimental metabolism results correlated with the proposed binding mode of ticlopidine in the CYP2B6 active site, a major binding mode exhibited by X-ray, docking, or NMR studies for the CYP2B4-ticlopidine complex was nonproductive. The study also infers that a single stable enzyme-substrate complex shown by X-ray, docking, or NMR may not provide a good description of the oxidation sites and productive binding mode of the molecule. Other factors such as conformational or orientation changes after reductase binding and/or reduction of the heme iron, as well as the reactivity of the atoms in proximity to the activated oxygen species, undoubtedly play a role in determining the ultimate products. This finding is in agreement with the results from previous studies (Oliver et al., 1997; Strickler et al., 2003). Finally, this study demonstrates the value of in silico tools in providing useful insight into predictive drug metabolism and in allowing elucidation of important molecular interactions between the substrate and the active site. However, these predictions can be even more valuable in enhancing the pharmacokinetic profiles and reduce toxicities of new candidates in early drug design when used in conjunction with mechanistic biotransformation studies.
Acknowledgments
We thank Dr. Qiyue Hu for calculating the Fukui functions and Dr. Ross Paul Wilderman for critical review of this manuscript.
This work was supported by the National Institutes of Health National Institute of Environmental Health Sciences [Grant ES003619] (to J.R.H.).
Article, publication date, and citation information can be found at http://dmd.aspetjournals.org.
doi:10.1124/dmd.110.037101.
The online version of this article (available at http://dmd.aspetjournals.org) contains supplemental material.
ABBREVIATIONS:
- P450
- cytochrome P450
- CYP2B6
- an N-terminal truncated and modified and C-terminal 4-His-tagged form of cytochrome P450 2B6
- CYP2B4
- an N-terminal truncated and modified and C-terminal His-tagged form of cytochrome P450 2B4 with a substitution of His226 to Tyr
- M2
- 2-oxoticlopidine
- 7-EFC
- 7-ethoxy-4-trifluoromethylcoumarin
- Cymal-5
- 5-cyclo-hexylpentyl-β-d-maltoside
- CPR
- recombinant NADPH-cytochrome P450 reductase
- Ni-NTA
- nickel-nitrilotriacetic acid
- DTT
- dithiothreitol
- HPLC
- high-performance liquid chromatography
- MS
- mass spectrometry
- ESI
- electrospray ionization
- MS/MS
- tandem mass spectrometry
- TSOD
- ticlopidine S-oxide dimer
- amu
- atomic mass units.
Authorship Contributions
Participated in research design: Halpert and Dalvie.
Conducted experiments: Talakad, Shah, Xiang, Walker, and Dalvie.
Performed data analysis: Talakad and Dalvie.
Wrote or contributed to the writing of the manuscript: Talakad, Shah, Halpert, and Dalvie.
Other: Halpert acquired funding for the research.
References
- Beck ME. (2005) Do Fukui function maxima relate to sites of metabolism? A critical case study. J Chem Inf Model 45:273–282 [DOI] [PubMed] [Google Scholar]
- Dalvie DK, O'Connell TN. (2004) Characterization of novel dihydrothienopyridinium and thienopyridinium metabolites of ticlopidine in vitro: role of peroxidases, cytochromes P450, and monoamine oxidases. Drug Metab Dispos 32:49–57 [DOI] [PubMed] [Google Scholar]
- Dansette PM, Libraire J, Bertho G, Mansuy D. (2009) Metabolic oxidative cleavage of thioesters: evidence for the formation of sulfenic acid intermediates in the bioactivation of the antithrombotic prodrugs ticlopidine and clopidogrel. Chem Res Toxicol 22:369–373 [DOI] [PubMed] [Google Scholar]
- Farid NA, Kurihara A, Wrighton SA. (2010) Metabolism and disposition of the thienopyridine antiplatelet drugs ticlopidine, clopidogrel, and prasugrel in humans. J Clin Pharmacol 50:126–142 [DOI] [PubMed] [Google Scholar]
- Gay SC, Roberts AG, Maekawa K, Talakad JC, Hong WX, Zhang Q, Stout CD, Halpert JR. (2010b) Structures of cytochrome P450 2B4 complexed with the antiplatelet drugs ticlopidine and clopidogrel. Biochemistry 49:8709–8720 [DOI] [PMC free article] [PubMed] [Google Scholar]
- Gay SC, Roberts AG, Halpert JR. (2010c) Structural features of cytochromes P450 and ligands that affect drug metabolism as revealed by x-ray crystallography and NMR. Future Med Chem 2:1451–1468 [DOI] [PMC free article] [PubMed] [Google Scholar]
- Gay SC, Shah MB, Talakad JC, Maekawa K, Roberts AG, Wilderman PR, Sun L, Yang JY, Huelga SC, Hong WX, et al. (2010a) Crystal structure of a cytochrome P450 2B6 genetic variant in complex with the inhibitor 4-(4-chlorophenyl)imidazole at 2.0-A resolution. Mol Pharmacol 77:529–538 [DOI] [PMC free article] [PubMed] [Google Scholar]
- Gay SC, Sun L, Maekawa K, Halpert JR, Stout CD. (2009) Crystal structures of cytochrome P450 2B4 in complex with the inhibitor 1-biphenyl-4-methyl-1H-imidazole: ligand-induced structural response through alpha-helical repositioning. Biochemistry 48:4762–4771 [DOI] [PMC free article] [PubMed] [Google Scholar]
- Grieco A, Vecchio FM, Greco AV, Gasbarrini G. (1998) Cholestatic hepatitis due to ticlopidine: clinical and histological recovery after drug withdrawal. Case report and review of the literature. Eur J Gastroenterol Hepatol 10:713–715 [PubMed] [Google Scholar]
- Guengrich FP. (2005) Human cytochrome P450 enzymes, in Cytochromes P450: Structure, Mechanism and Biochemistry, 3rd ed (Ortiz de Montellano PR. ed), pp 377–350, Plenum Press, New York [Google Scholar]
- Ha-Duong NT, Dijols S, Macherey AC, Goldstein JA, Dansette PM, Mansuy D. (2001) Ticlopidine as a selective mechanism-based inhibitor of human cytochrome P450 2C19. Biochemistry 40:12112–12122 [DOI] [PubMed] [Google Scholar]
- Harlow GR, Halpert JR. (1997) Alanine-scanning mutagenesis of a putative substrate recognition site in human cytochrome P450 3A4. Role of residues 210 and 211 in flavonoid activation and substrate specificity. J Biol Chem 272:5396–5402 [DOI] [PubMed] [Google Scholar]
- Johnson EF, Stout CD. (2005) Structural diversity of human xenobiotic-metabolizing cytochrome P450 monooxygenases. Biochem Biophys Res Commun 338:331–336 [DOI] [PubMed] [Google Scholar]
- Kam PC, Nethery CM. (2003) The thienopyridine derivatives (platelet adenosine diphosphate receptor antagonists), pharmacology and clinical developments. Anaesthesia 58:28–35 [DOI] [PubMed] [Google Scholar]
- Khan KK, He YQ, Domanski TL, Halpert JR. (2002) Midazolam oxidation by cytochrome P450 3A4 and active-site mutants: an evaluation of multiple binding sites and of the metabolic pathway that leads to enzyme inactivation. Mol Pharmacol 61:495–506 [DOI] [PubMed] [Google Scholar]
- Ko JW, Desta Z, Soukhova NV, Tracy T, Flockhart DA. (2000) In vitro inhibition of the cytochrome P450 (CYP450) system by the antiplatelet drug ticlopidine: potent effect on CYP2C19 and CYP2D6. Brit J Clin Pharmacol 49:343–351 [DOI] [PMC free article] [PubMed] [Google Scholar]
- Kumar S, Chen CS, Waxman DJ, Halpert JR. (2005) Directed evolution of mammalian cytochrome P4502 B1: mutations outside of the active site enhance the metabolism of several substrates, including the anticancer prodrugs cyclophosphamide and ifosfamide. J Biol Chem 280:19569–19575 [DOI] [PubMed] [Google Scholar]
- Kumar S, Zhao Y, Sun L, Negi SS, Halpert JR, Muralidhara BK. (2007) Rational engineering of human cytochrome P450 2B6 for enhanced expression and stability: importance of a Leu264->Phe substitution. Mol Pharmacol 72:1191–1199 [DOI] [PubMed] [Google Scholar]
- Lewis DF, Ito Y. (2008) Human cytochromes P450 in the metabolism of drugs: new molecular models of enzyme-substrate interactions. Expert Opin Drug Metab Toxicol 4:1181–1186 [DOI] [PubMed] [Google Scholar]
- Mataix R, Ojeda E, Perez MC, Jimenez S. (1992) Ticlopidine and severe aplastic anaemia. Br J Haematol 80:125–126 [DOI] [PubMed] [Google Scholar]
- Mitsuda M, Iwasaki M. (2006) Improvement in the expression of CYP2B6 by co-expression with molecular chaperones GroES/EL in Escherichia coli. Protein Expr Purif 46:401–405 [DOI] [PubMed] [Google Scholar]
- Nishiya Y, Hagihara K, Ito T, Tajima M, Miura S, Kurihara A, Farid NA, Ikeda T. (2009) Mechanism-based inhibition of human cytochrome P450 2B6 by ticlopidine, clopidogrel, and the thiolactone metabolite of prasugrel. Drug Metab Dispos 37:589–593 [DOI] [PubMed] [Google Scholar]
- Oliver CF, Modi S, Primrose WU, Lian LY, Roberts GC. (1997) Engineering the substrate specificity of Bacillus megaterium cytochrome P-450 BM3: hydroxylation of alkyl trimethylammonium compounds. Biochem J 327:537–544 [DOI] [PMC free article] [PubMed] [Google Scholar]
- Omura T, Sato R. (1964) The carbon monoxide-binding pigment of liver microsomes. I. Evidence for its hemoprotein nature. J Biol Chem 239:2370–2378 [PubMed] [Google Scholar]
- Ono K, Kurohara K, Yoshihara M, Shimamoto Y, Yamaguchi M. (1991) Agranulocytosis caused by ticlopidine and its mechanism. Am J Hematol 37:239–242 [DOI] [PubMed] [Google Scholar]
- Onyeji CO, Tessier PR, Nightingale CH, Vallee F, Nicolau DP. (1999) Pharmacokinetics of ticlopidine in the rabbit. J Pharm Pharmacol 51:393–396 [DOI] [PubMed] [Google Scholar]
- Panak E, Maffrand JP, Picard-Fraire C, Vallee E, Blanchard J, Roncucci R. (1983) Ticlopidine: a promise for the prevention and treatment of thrombosis and its complications. Haemostasis 13 (Suppl 1):1–54 [DOI] [PubMed] [Google Scholar]
- Richter T, Mürdter TE, Heinkele G, Pleiss J, Tatzel S, Schwab M, Eichelbaum M, Zanger UM. (2004) Potent mechanism-based inhibition of human CYP2B6 by clopidogrel and ticlopidine. J Pharmacol Exp Ther 308:189–197 [DOI] [PubMed] [Google Scholar]
- Scott EE, Spatzenegger M, Halpert JR. (2001) A truncation of 2B subfamily cytochromes P450 yields increased expression levels, increased solubility, and decreased aggregation while retaining function. Arch Biochem Biophys 395:57–68 [DOI] [PubMed] [Google Scholar]
- Scott EE, White MA, He YA, Johnson EF, Stout CD, Halpert JR. (2004) Structure of mammalian cytochrome P450 2B4 complexed with 4-(4-chlorophenyl)imidazole at 1.9-A resolution: insight into the range of P450 conformations and the coordination of redox partner binding. J Biol Chem 279:27294–27301 [DOI] [PubMed] [Google Scholar]
- Sharis PJ, Cannon CP, Loscalzo J. (1998) The antiplatelet effects of ticlopidine and clopidogrel. Ann Intern Med 129:394–405 [DOI] [PubMed] [Google Scholar]
- Shimizu S, Atsumi R, Nakazawa T, Fujimaki Y, Sudo K, Okazaki O. (2009) Metabolism of ticlopidine in rats: identification of the main biliary metabolite as a glutathione conjugate of ticlopidine S-oxide. Drug Metab Dispos 37:1904–1915 [DOI] [PubMed] [Google Scholar]
- Steinhubl SR, Tan WA, Foody JM, Topol EJ. (1999) Incidence and clinical course of thrombotic thrombocytopenic purpura due to ticlopidine following coronary stenting. EPISTENT Investigators. Evaluation of platelet IIb/IIIa inhibitor for stenting. JAMA 281:806–810 [DOI] [PubMed] [Google Scholar]
- Strickler M, Goldstein BM, Maxfield K, Shireman L, Kim G, Matteson DS, Jones JP. (2003) Crystallographic studies on the complex behavior of nicotine binding to P450cam (CYP101). Biochemistry 42:11943–11950 [DOI] [PubMed] [Google Scholar]
- Talakad JC, Wilderman PR, Davydov DR, Kumar S, Halpert JR. (2010) Rational engineering of cytochromes P450 2B6 and 2B11 for enhanced stability: insights into structural importance of residue 334. Arch Biochem Biophys 494:151–158 [DOI] [PMC free article] [PubMed] [Google Scholar]
- Tuong A, Bouyssou A, Paret J, Cuong TG. (1981) Metabolism of ticlopidine in rats: Identification and quantitative determination of some its metabolites in plasma, urine and bile. Eur J Drug Metab Pharmacokinet 6:91–98 [DOI] [PubMed] [Google Scholar]
- Walsky RL, Astuccio AV, Obach RS. (2006) Evaluation of 227 drugs for in vitro inhibition of cytochrome P450 2B6. J Clin Pharmacol 46:1426–1438 [DOI] [PubMed] [Google Scholar]
- Zhang H, Lin HL, Walker VJ, Hamdane D, Hollenberg PF. (2009) tert-Butylphenylacetylene is a potent mechanism-based inactivator of cytochrome P450 2B4: inhibition of cytochrome P450 catalysis by steric hindrance. Mol Pharmacol 76:1011–1018 [DOI] [PMC free article] [PubMed] [Google Scholar]
- Zhao Y, Sun L, Muralidhara BK, Kumar S, White MA, Stout CD, Halpert JR. (2007) Structural and thermodynamic consequences of 1-(4-chlorophenyl)imidazole binding to cytochrome P450 2B4. Biochemistry 46:11559–11567 [DOI] [PMC free article] [PubMed] [Google Scholar]
- Zhao Y, White MA, Muralidhara BK, Sun L, Halpert JR, Stout CD. (2006) Structure of microsomal cytochrome P450 2B4 complexed with the antifungal drug bifonazole: insight into P450 conformational plasticity and membrane interaction. J Biol Chem 281:5973–5981 [DOI] [PubMed] [Google Scholar]


