

Abstract
Beryllium exposure in the workplace can result in chronic beryllium disease, a granulomatous lung disorder characterized by CD4+ T cell alveolitis and progressive lung fibrosis. A large number of the CD4+ T cells recruited to the lung in chronic beryllium disease recognize beryllium in an Ag-specific manner and express Th1-type cytokines following T cell activation. Beryllium-responsive CD4+ T cells in the bronchoalveolar lavage (BAL) express an effector memory T cell phenotype and recognize beryllium in a CD28-independent manner. In this study, we show that the majority of beryllium-responsive CD4+ T cells in BAL have lost CD27 expression, whereas a subset of beryllium-responsive cells in blood retains expression of this costimulatory molecule. In addition, loss of CD27 on BAL CD4+ T cells inversely correlates with markers of lung inflammation. A small population of BAL CD4+ T cells retains CD27 expression, and these CD4+CD27+ T cells contain the FoxP3-expressing, naturally occurring regulatory T (Treg) cell subset. Coexpression of CD27 and CD25 identifies the majority of FoxP3-expressing Treg cells in blood and BAL, and these cells express potent suppressor function. Taken together, these findings suggest that CD27 is differentially expressed between effector T cells from the inflamed lung and can be used in conjunction with CD25 to isolate Treg cells and assess their functional capacity in an ongoing adaptive immune response in a target organ.
Chronic beryllium disease (CBD)3 is characterized by the presence of noncaseating granulomatous inflammation in the lung and the subsequent development of progressive lung fibrosis (1). From 1 to 16% of beryllium-exposed workers develop CBD, depending on the nature of the exposure and the genetic susceptibility of the individual (2–5). Evidence suggests that the recruitment of beryllium-specific CD4+ T cells to the lung represents a key component in the immunopathogenesis of this disease. Lung CD4+ T cells express an effector memory T (TEM) cell phenotype (6, 7), secrete Th1-type cytokines upon beryllium exposure in culture (6, 8), and recognize beryllium in a CD28-independent manner (9). This is in contrast to circulating beryllium-responsive T cells that remain dependent on CD28 for optimal beryllium-induced proliferation and cytokine secretion (9). In the absence of CD28-mediated costimulation, we have recently shown that induction of the TNFR family member 4-1BB on bronchoalveolar lavage (BAL) CD4+ T cells enhances beryllium-induced proliferation and prevents activation-induced cell death (10). Despite up-regulation of 4-1BB on the surface of lung TEM cells, loss of CD28 expression and increased expression of programmed death-1 (11) leads to a hyporesponsive phenotype compared with that of their circulating counterparts (10).
CD27, another member of the TNF receptor family, is expressed on naive and subsets of memory CD4+ and CD8+ T cells (12). After TCR engagement an up-regulation in CD27 expression is seen, followed by an irreversible loss with repeated stimulation (13–15). CD27 functions to increase T cell expansion through the enhancement of T cell survival (12, 16). The loss of CD27 on effector T cells suggest that its costimulatory effects occur early in the generation of an adaptive immune response (12). In the absence of CD27, mice intranasally infected with influenza showed an impaired generation of influenza-specific T cells in lymphoid organs and a diminished accumulation of CD4+ and CD8+ T cells in the lung (16, 17), suggesting that CD27 was the main determinant for the accumulation of Ag-specific T cells in the target organ. With a known antigenic stimulus and access to pathogenic Ag-specific T cells from the human lung, CBD serves as an ideal immune-mediated disease in which to investigate the role of CD27 in this disorder.
Using blood and BAL cells from patients with beryllium-induced disease, we show that the loss of CD27 on lung T cells correlates with the severity of lung inflammation. In contrast to blood in which a population of beryllium-specific CD27+ T cells persists, the vast majority of beryllium-responsive T cells in the lung have lost surface CD27 expression. A small population of BAL CD4+ T cells retains CD27 expression, and this subset marks naturally occurring, FoxP3-expressing regulatory T (Treg) cells. These findings show that CD27 can differentiate TEM cells from Treg cells in the inflamed human lung.
Materials and Methods
Study population
Twenty-four patients with a diagnosis of CBD and 17 beryllium-sensitized (BeS) patients were enrolled in this study. Twenty-three healthy, nonberyllium-exposed control subjects were also enrolled. The diagnosis of CBD was established using previously defined criteria, including a history of beryllium exposure, the presence of granulomatous inflammation on lung biopsy, and a positive proliferative response of blood and/or BAL T cells to beryllium sulfate (BeSO4) in vitro (18, 19). The diagnosis of beryllium sensitization was established based on a history of beryllium exposure, a positive proliferative response of PBMCs to BeSO4 in vitro, and the absence of granulomatous inflammation or other abnormalities on lung biopsy (20, 21). Active smokers were excluded from enrollment. Informed consent was obtained from each patient and control subject, and the protocol was approved by the Human Subject Institutional Review Boards at the University of Colorado Denver (Aurora, CO) and National Jewish Health (Denver, CO).
The demographics of the BeS and CBD patients are shown in Table I. No difference was seen in the age of the BeS and CBD patients enrolled in this study. The majority of both subject groups were male. No difference in beryllium-induced proliferation of blood cells was seen between BeS and CBD patients. In contrast, a significant increase in the proliferation (stimulation index) of BAL cells from CBD patients compared with BeS subjects in response to beryllium was seen (median, 8.6 (range, 0.9–262) vs 1.4 (0.9–3.9); p < 0.0001). All clinical beryllium lymphocyte proliferation tests were performed in the Clinical Immunology Laboratory at National Jewish Health as previously described (18, 19). CBD subjects had a statistically significant increase in the percentage of BAL lymphocytes (median, 29 (range, 6.1–57) vs 6.0 (2.0–20); p < 0.005) compared with BeS patients.
Table I.
Characteristics of BeS and CBD patientsa
| Characteristics | BeS Patients (n = 17) | CBD Patients (n = 24) |
|---|---|---|
| Age (years) | 53 (26–75) | 58 (40–78) |
| Gender (male/female) | 15/2 | 19/5 |
| Race (C/AF/H)b | 14/2/1 | 17/3/4 |
| Smoking status (CS/FS/NS)c | 0/9/8 | 0/11/13 |
| Industry of exposure (N/C/O)d | 15/0/2 | 19/4/1 |
| Treatment (none/prednisone) | 9/0 | 20/4 |
| BeLPTe stimulation index | ||
| PBL | 5.6 (0.9–42) | 2.8 (0.8–162) |
| BAL | 1.4 (0.9–3.9) | 8.6 (0.9–262)f |
| BAL cells | ||
| White blood cell count (×106) | 18 (2.5–104) | 27 (6.5–144) |
| Lymphocytes (%) | 6.0 (2.0–20) | 29 (6.1–57)f |
Data expressed as median (range).
C, Caucasian; AF, African-American; H, Hispanic.
CS, Current smoker; FS, former smoker; NS, never a smoker.
N, Nuclear; C, ceramic; O, other.
Beryllium lymphocyte proliferation test.
p < 0.005.
Immunofluorescence staining and analysis for intracellular cytokine expression
PBMCs were isolated from heparinized blood by Ficoll-Hypaque density gradient separation. BAL was obtained as previously described (22, 23), and hemorrhagic BAL samples were excluded from further evaluation to minimize potential contamination with PBMCs. For cytokine expression, PBMCs (2 × 10⁶ cells/tube) and BAL cells (1 × 10⁶ cells/tube) were resuspended in RPMI 1640 supplemented with 20 mM HEPES, 1 mM sodium pyruvate, 100 U/ml penicillin, 100 μg/ml streptomycin, 2 mM L-glutamine (all from Invitrogen) and 10% heat-inactivated human serum (Gemini Bio-Products) (RPMI-C). One milliliter of RPMI-C-containing cells was placed in a 12 × 75 mm polypropylene culture tube, and 3 μg/ml anti-CD28 and anti-CD49d mAbs (BD Biosciences) were added as previously described (7). Cells were stimulated with medium alone, 100 μM BeSO4 (Brush Wellman), or staphylococcal enterotoxin B (SEB; Toxin Technologies) for a total of 6 h at 37°C in a humidified 5% CO2 atmosphere with 10 μg/ml brefeldin A added after 1 h of stimulation.
Unstimulated, BeSO4- or SEB-stimulated cells were surfaced stained with unlabeled anti-CCR7 (BD Pharmingen) for 30 min at 4°C, washed with FACS buffer, and stained with a secondary biotinylated anti-mouse IgM for 30 min at 4°C. Cells were washed and stained with anti-CD4 (allophycocyanin Cy7; BD Pharmingen), anti-CD3 (Pacific Blue; Beckman Coulter), anti-CD27 (FITC; BD Biosciences), and streptavidin-PE for 30 min at 4°C. Cells were fixed, permeabilized, and stained with anti-IFN-γ (PE Cy7; BD Pharmingen) for 30 min at 4°C. Cells were washed and resuspended in 1% formaldehyde. The lymphocyte population was identified using forward and 90° light scatter patterns, and fluorescence intensity was analyzed using a FACSAria flow cytometer (BD Immunocytometry Systems) (11). The number of events collected ranged between 1 and 3 million. Electronic compensation was performed with Ab capture beads (BD Biosciences) stained separately with individual mAbs used in the test samples. The data files were analyzed using Diva software (BD Biosciences).
Expression of proteins associated with Treg cells
PBMCs and BAL cells were surface stained with anti-CD4 (PerCP; BD Pharmingen) anti-CD25 (allophycocyanin; BD Pharmingen), and anti-CD27 (FITC; BD Pharmingen) in PBS supplemented with 1% BSA (FACS buffer), washed twice in FACS buffer, and fixed and permeabilized before intranuclear staining with anti-FoxP3 (PE; eBioscience). Cells were washed and resuspended in 1% formaldehyde. Fluorescence intensity was analyzed on a FACSCalibur flow cytometer as previously described (6). Analysis was performed using CellQuest Pro (BD Bioscience) or FlowJo (Tree Star) software.
Measurement of the functional capacity from CD4+CD27+CD25high Treg cells
PBMCs were presorted using a CD4+ T cell isolation kit II (Miltenyi Biotec) and stained with anti-CD4 (PerCP; BD Pharmingen), anti-CD25 (allophycocyanin; BD Pharmingen), and anti-CD27 (FITC; BD Pharmingen). Surface-stained cells were sorted on a FACSAria flow cytometer (BD Immunocytometry Systems). Sorted CD4+CD25highCD27+ (Treg) and a fixed number (2.5 × 10³ cells/well) of CD4+CD25− (responders) T cells were cultured in varying ratios of responder T cells to Treg cells (1:1, 1:0.5, 1:0.25, and 1:0.125) in a final volume of 250 μl in the presence of irradiated (5000 rad) 1 × 10⁴ T cell-depleted APCs. Cells were stimulated with plate-bound anti-CD3 (clone OKT3; Ortho Biotech) at three different concentrations (0.1, 0.5, and 2.5 μg/ml, coated in PBS for 2 h at room temperature) in U-bottom, 96-well plates and cultured at 37°C for 5 days in a humidified 5% CO2 atmosphere in RPMI-C. On day 5, 1 μCi of [3H]thymidine (PerkinElmer) was added to each well and harvested after 18 h, and incorporation of radioactivity was detected by β-emission spectroscopy.
Statistical analysis
The Mann-Whitney U test and the Kruskal-Wallis ANOVA assay were used to determine the significance of differences between subject groups. A Spearman correlation was performed to analyze the association between total BAL white blood cells, lymphocytes, and macrophages and expression of CD27 on CD4+ T cells. A p value of <0.05 was considered statistically significant.
Results
CD27 expression is diminished on BAL CD4+ T cells from CBD patients
Recent studies have shown the presence of activated CD4+ and CD8+ T cells expressing a differentiated memory phenotype in the normal and diseased human lung (9, 24, 25). In the current study, we analyzed the expression of the memory cell marker CD27 on blood and BAL CD4+ T cells from CBD patients as compared with normal control subjects and those with beryllium sensitization. PBMCs and BAL cells were obtained from normal control subjects (n = 23 PBL, 4 BAL), BeS subjects (n = 17 PBL, 10 BAL), and CBD patients (n = 24 PBL, 15 BAL), and the percentage of CD3+CD4+ T cells expressing CD27 was determined by immunofluorescence staining and cytofluorographic analysis. Representative density plots of CD27 expression on CD4+ T cells from blood and BAL are shown in Fig. 1A. No difference in the frequency of CD4+ T cells expressing CD27 in blood was seen between study groups. In contrast, CD27 expression was significantly lower on BAL CD4+ T cells from CBD subjects (median, 14%; range, 4.3– 41%) compared with blood (median, 92%; range 62–98%; p < 0.001). The frequency of CD4+CD27+ T cells in BAL of CBD patients was also significantly decreased compared with BAL CD4+ T cells of normal control (median, 35%; range, 28 –74%; p < 0.05) and BeS subjects (median, 43%; range, 23–83%; p < 0.01) (Fig. 1B).
FIGURE 1.

CD27 expression on the surface of CD4+ T cells from blood and BAL. A, Representative density plots of blood and BAL CD4+ T cells from CBD patients for expression of CD27. The numbers in the upper-right quadrants are the percentages of CD4+ T cells that express CD27. B, The percentage of CD4+ T cells expressing CD27 in blood of normal control subjects (n = 17), BeS subjects (n = 24), and CBD subjects (n = 23) and BAL of normal controls (n = 4), BeS (n = 10) and CBD (n = 16) subjects is shown. Median values for each disease group are indicated with solid lines, and statistical comparisons were made using the Kruskal-Wallis test.
Correlation of the loss of CD27 expression on BAL CD4+ T cells and lung inflammation
Next, we correlated CD27 expression on BAL CD4+ T cells from BeS subjects (n = 9) and CBD patients (n = 15) with markers of lung inflammation. A significant negative correlation was seen between the percentage of BAL CD4+ T cells expressing CD27 and BAL lymphocyte count (r = −0.72; p < 0.0001) (Fig. 2), suggesting that disease severity as reflected by a worsening CD4+ T cell alveolitis is linked to the loss of CD27 expression in the lung. This correlation persisted when only CBD patients were analyzed (r = −0.68; p = 0.005). Significant negative correlations were also found for total BAL white blood cell count (r = −0.62; p = 0.001) and macrophage count (r = −0.50; p = 0.01). Thus, the severity of beryllium-induced lung inflammation is associated with a further differentiation of memory CD4+ T cell subsets in the lung.
FIGURE 2.

Correlation between the percentage of CD4+ T cells expressing CD27 and total BAL white blood cell (WBC) (left), lymphocyte (middle), and macrophage cell (right) counts in nine BeS subjects and 15 CBD patients.
CD27 expression on IFN-γ-secreting, beryllium-responsive CD4+ T cells in blood and BAL
Using intracellular IFN-γ expression as a measure of Ag specificity (6), PBMCs and BAL cells were stimulated with BeSO4 at the optimal concentration of 100 μM for 6 h. Previous studies have shown that PBMCs from healthy and disease control subjects, as well as BAL cells from sarcoidosis patients, demonstrate no response to BeSO4 in these assays (6). Conversely, CD4+ T cells from CBD patients show marked responses after the addition of beryllium salts. A representative example of intracellular IFN-γ expression in PBMCs and BAL cells from a CBD patient is shown in Fig. 3, A and B, respectively. We observed minimal background IFN-γ staining in the absence of stimulation. Following BeSO4 stimulation of PBMCs from a CBD patient, a greater frequency of CD4+CD27− cells express IFN-γ after BeSO4 exposure compared with their CD27+ counterparts (1.0 vs 0.5%) (Fig. 3A). This effect was even more pronounced for BAL cells where the frequency of CD4+CD27− T cells expressing IFN-γ after BeSO4 exposure was 2.2% in the representative example compared with 0.09% for CD4+ T cells lacking CD27 (Fig. 3B). Among all patients studied, the percentage of IFN-γ-expressing CD4+ T cells with and without CD27 expression in blood was not significantly different (median, 62%; range, 26–75% vs median, 38%; range, 25–74%; p = 0.08) (Fig. 3C). In contrast, the vast majority (median, 95%; range, 88–97%) of IFN-γ-secreting CD4+ T cells in BAL were localized to the population of CD4+ T cells that had lost surface expression of CD27 (Fig. 3C). Thus, despite the retention of CD27 on a subset of beryllium-responsive T cells in blood, our findings show that most beryllium-specific CD4+ T cells have lost CD27 expression regardless of the cellular location. Although the frequency of beryllium-responsive, IL-2-expressing CD4+ T cells in blood and lungs was decreased compared with IFN-γ, CD27 expression on IL-2+ T cells was similar to that seen in IFN-γ-expressing CD4+ T cells in both compartments (data not shown).
FIGURE 3.

Intracellular IFN-γ expression in stimulated blood and BAL CD4+ T cells from CBD patients. A and B, Representative density plots are shown of blood (A) and BAL (B) CD4+ T cells from a CBD patient stimulated with medium, BeSO4, or SEB and subsequently stained for surface CD4 and CD27 and intracellular IFN-γ. Cells were gated on CD3 and CD4 expression. The numbers in upper left and upper right quadrants of the each density plot are the percentages of CD4+CD27− and CD4+CD27+ T cells, respectively, expressing IFN-γ. C, Percentages of CD27− and CD27+ CD4+ T cells expressing IFN-γ in blood (n = 9) and BAL (n = 7) of CBD patients after short-term BeSO4 exposure are shown. Median values are indicated with solid lines. Statistical significance was established using the Kruskal-Wallis test.
Memory phenotype of beryllium-responsive CD4+ T cells in blood and BAL
We have previously shown that the majority of beryllium-responsive CD4+ T cells in blood secreting either IFN-γ or IL-2 have lost expression of CCR7, thus expressing a TEM cell phenotype (7). Recent studies have shown that this memory T cell population could be further subdivided by the addition of CD27 to the staining protocol (26). To determine whether CD27 in addition to CCR7 allows a further delineation of an Ag-specific memory T cell subset, we assessed CCR7 and CD27 expression on IFN-γ-secreting CD4+ T cells in blood and BAL of CBD patients after BeSO4 stimulation as described above. Representative density plots depicting the gating strategy for IFN-γ-secreting CD4+ T cells are shown in Fig. 4A. In contrast to our previous findings (7), IFN-γ-secreting, beryllium-responsive T cells in blood were divided between the following memory subsets: CCR7−CD27− (median, 27%; range, 17–71%), CCR7+CD27+ (median, 28%; range, 2.8 – 49%), CCR7−CD27+ (median, 17%; range, 4.3–27%), and CCR7+CD27− (median, 13%; range, 5.5–36%). In BAL, the majority of the beryllium-responsive T cell pool was composed of cells lacking CCR7 and CD27 (median, 85%; range, 62–98%), with the remainder of cells expressing CCR7 in the absence of CD27 (median,13%; range, 1.8 –35%) (Fig. 4B). Thus, in contrast to beryllium-responsive T cells in the lung, the addition of CD27 to CCR7 identifies distinct stages of memory CD4+ T cell differentiation in blood that may translate into differing functional capabilities.
FIGURE 4.

Memory phenotype of beryllium-responsive, IFN-γ-expressing CD4+ T cells from blood and BAL of CBD subjects. A, Intracellular expression of IFN-γ (left panels) in blood and BAL CD4+ T cells of a CBD patient after a 6-h stimulation with 100 μM BeSO4 is shown. The percentage of CD4+ T cells expressing IFN-γ is shown in the upper right quadrant of each density plot. The expression of CCR7 and CD27 on the IFN-γ-expressing CD4+ T cells (right panels) was then determined, and the percentage of CD4+ T cells in each quadrant of the density plots is shown. B, The percentage of IFN-γ+CD4+ T cells from blood (left) and BAL (right) in relation to CCR7 and CD27 expression is shown. Median values are indicated with solid lines, and statistical comparisons were made using the Kruskal-Wallis test.
Identification of FoxP3-expressing naturally occurring regulatory T cells in the lungs of subjects with beryllium-induced disease
Despite our findings that the beryllium-responsive CD4+ TEM cells in the lung are localized to the CD27− subset, there remains a small population of CD4+CD27+ T cells in the BAL of CBD patients (median of 14% as shown in Fig. 1B). Based on a recent report that coexpression of CD27 and CD25 identifies FoxP3-expressing Treg cells in the synovia of subjects with juvenile idiopathic arthritis (27), we queried whether this T cell population contains the naturally occurring Treg cell subset in the lung. The Forkhead/winged transcription factor FoxP3 is considered the best marker available to identify naturally occurring Treg cells. A representative example of intracellular FoxP3 staining on CD3+CD4+CD27+ T cells from blood and BAL of a CBD patient is shown in Fig. 5A. Although the percentage of CD27+ T cells that express FoxP3 is low (6.6% in blood and 14% in BAL in this example), the majority of FoxP3 expression is localized to those CD4+ T cells that express CD27 irrespective of the cellular location. Overall, in blood and BAL of normal control, BeS, and CBD subjects, no significant differences were seen in FoxP3 expression in CD4+CD27+ T cells (Fig. 5B).
FIGURE 5.
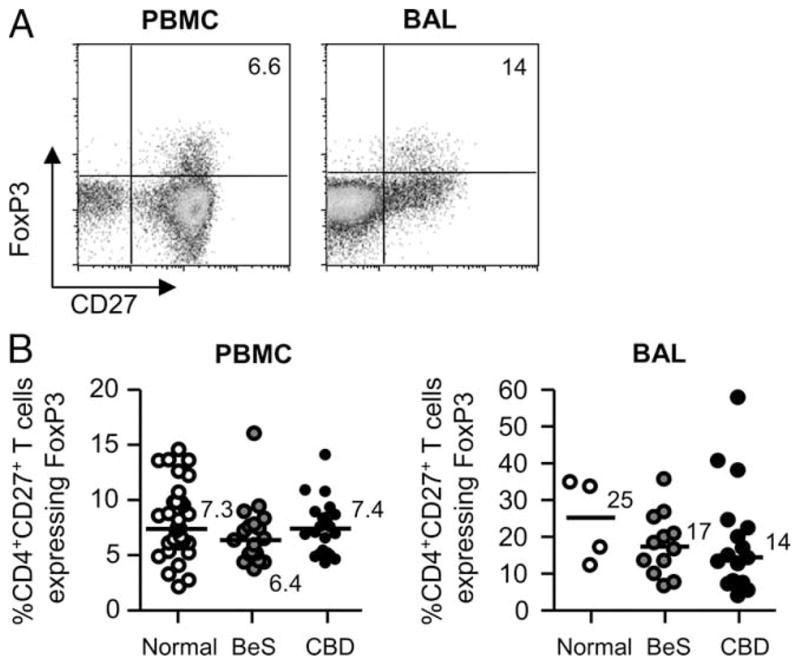
FoxP3 expression in CD4+CD27+ T cells in blood and BAL of BeS subjects and CBD patients. A, Representative density plots are shown of intracellular FoxP3 expression in blood and BAL CD4+CD27+ T cells from CBD patients. B, Percentages of CD4+CD27+ T cells expressing FoxP3 from blood and BAL of normal control, BeS, and CBD subjects are shown. Median values are indicated with solid lines.
High expression of CD25, the α-chain of the IL-2 receptor, on CD4+ T cells has been used to denote the FoxP3-expressing Treg cell subset in blood of humans (28). However, the expression of CD25 on activated T cells in an ongoing immune response or in inflamed tissues makes its use for the identification of Treg cells in the lung unreliable (27). We compared the percentage of CD25high, CD25low, and CD25− T cells expressing FoxP3 in blood and BAL of CBD patients. The gates for CD25 were set based on CD25 expression on CD3+CD4− T cells, where the pattern of CD25 expression is more distinct. CD4+CD25high T cells were defined as the top 5% of CD4+ T cells expressing CD25. In the representative example shown in Fig. 6A, 89, 48, and 2.8% of CD25high, CD25low, and CD25−CD4+ T cells in blood expressed FoxP3, respectively. Overall, the percentage of blood CD4+CD25high T cells expressing FoxP3 was 58% (median; range 31–90%) (Fig. 6B). The percentage of CD25high T cells expressing FoxP3 was significantly decreased in CD4+CD25high T cells in BAL of CBD patients compared with blood (median, 33%; range, 17– 61%; p < 0.05) (Fig. 6B). Interestingly, the distribution of FoxP3+ cells in the BAL was spread throughout the CD25-expressing cells and not just in the CD25high T cells (data not shown). Thus, the use of CD25 as the hallmark surface Ag of Treg cells in BAL is not possible.
FIGURE 6.
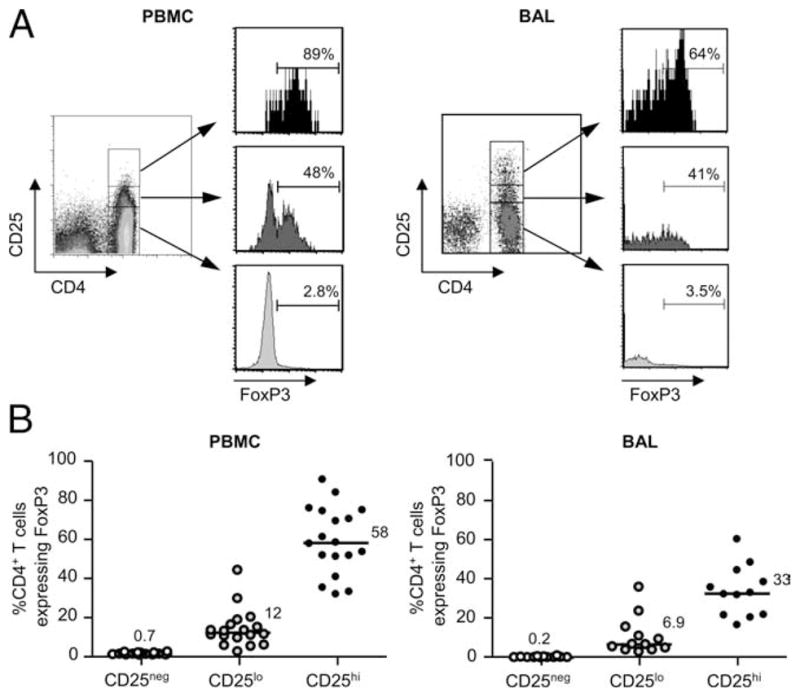
FoxP3 expression in CD4+CD25+ T cells in blood and BAL of CBD subjects. A, Representative density plots depicting gating strategies for CD25high, CD25low, and CD25−CD4+ T cells and histograms showing FoxP3 expression in each CD25 subset in blood and BAL from CBD subjects are shown. CD25 gates were set based on CD25 expression on CD4− T cells, where the expression of CD25 is more distinct. CD4+CD25high T cells were defined as the top 5% of T cells expressing CD25. B, Comparison of FoxP3 expression in CD25high (CD25hi), CD25low (CD25lo), and CD25− (CD25neg) CD4+ T cells in blood (n = 18) and BAL (n = 12) of CBD subjects is depicted. Median values are indicated with solid lines.
Coexpression of CD25 and CD27 on CD4+ T cells identifies FoxP3-expressing Treg cells
Due to the inadequacy of CD25 as a marker of Treg cells in the lung and the suggestion that the majority of FoxP3-expressing Treg cells lie within the CD27+ T cell subset, we analyzed whether the coexpression of CD25 and CD27 marks this Treg cell population. As shown in the representative density plots in Fig. 7A, 88 and 76% of CD4+FoxP3+ T cells express CD25 and CD27 in blood and BAL, respectively. Overall, 91 and 88% of CD25+CD27+ T cells in blood of BeS and CBD subjects express FoxP3, whereas 92 and 75% of those cells in the lung express FoxP3 (Fig. 7B). Thus, using CD27 in addition to CD25 for the identification of FoxP3+ Treg cells in blood and lungs of CBD patients resulted in a 36 and 56% improvement, respectively, compared with CD25 alone.
FIGURE 7.

Coexpression of CD25 and CD27 identifies FoxP3-expressing CD4+ Treg cells in blood and BAL. A, FoxP3 expression (left panels) in blood and BAL CD4+ T cells of CBD patients is shown. The percentage of CD4+ T cells expressing FoxP3 is shown in the upper right quadrant of each density plot. The expression of CD25 and CD27 on the FoxP3-expressing CD4+ T cells (right panels) was then determined, and the percentages of CD4+CD25+CD27+ T cells are shown in the upper right quadrants of the density plots. B, Percentages of CD4+CD25+CD27+ T cells expressing FoxP3 in blood and BAL from BeS subjects (n = 15 blood, n = 12 BAL) and CBD patients (n = 22 blood, n = 16 BAL) are shown. Median values are indicated with solid lines.
To determine whether CD4+ T cells expressing CD25 and CD27 display suppressor activity, we performed cell sorting using PBMCs from normal subjects (n = 10). As shown in Fig. 8A, the percentage of blood CD4+ T cells expressing FoxP3 was 7.2% while the percentage of CD4+ T cells coexpressing CD25 and CD27 was 5.8%. After cell sorting, 98% of the sorted CD3+CD4+ T cells were now CD25+CD27+, with 96% of those cells expressing FoxP3. These FoxP3-expressing CD4+ T cells possess potent suppressor function (Fig. 8B). Using various concentrations of plate-bound anti-CD3 (ranging from 0.1 to 2.5 μg/ml) to stimulate responder T cells from normal control subjects, the Treg cell population (CD4+CD25+CD27+) completely suppressed effector T cell proliferation at a responder to suppressor ratio of 1:1. At the lowest concentration of anti-CD3 (0.1 μg/ml), the Treg cells suppressed > 80% of effector T cell proliferation at ratios as low as 1:0.25. Thus, CD27 identifies potent suppressor cells within CD4+CD25+ T cells in blood of normal subjects.
FIGURE 8.
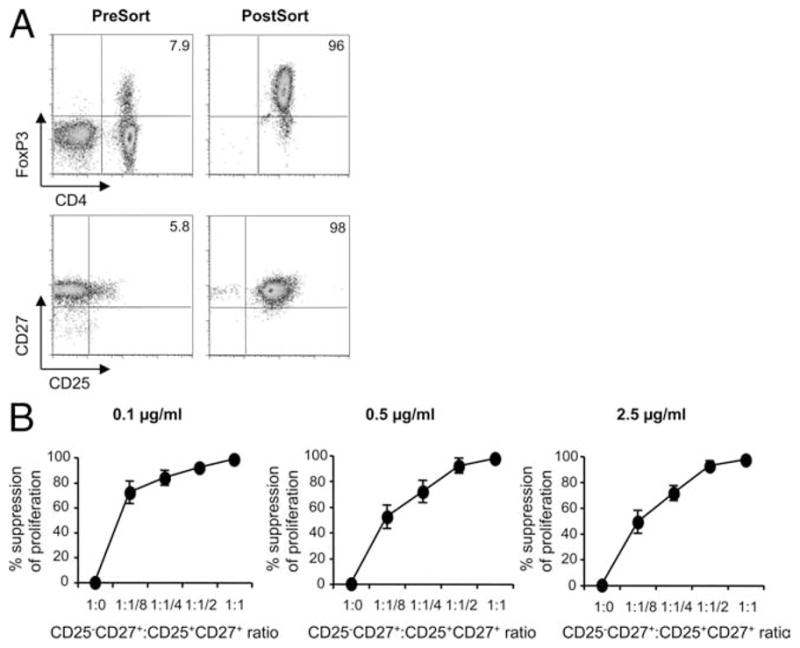
CD27 identifies potent suppressor cells within blood CD4+CD25+ T cells. A, Representative example of the enhancement of FoxP3 expression after cell sorting for CD25 and CD27 is shown. Blood from a normal control subject was stained for CD4, CD25, and CD27 followed by cell sorting. Analysis of cells postsort showed that 98% of the CD3+CD4+ T cells were CD25+CD27+, with 96% of those cells expressing FoxP3. B, The suppressive capacity of sorted CD4+CD27+CD25high Treg cells from the blood of normal control subjects (n = 10) is shown. The percentage of inhibition of the proliferative response of CD4+CD25− T cells by CD4+CD27+CD25high Treg cells is shown. Sorted CD4+CD25+CD27+ Treg cells were combined with effector CD4+CD25− T cells in varying ratios and stimulated with plate-bound anti-CD3 at 0.1 μg/ml (left), 0.5 μg/ml (middle), or 2.5 μg/ml (right). Proliferation was detected by [3H]thymidine incorporation at 5 days, and the mean percentage suppression ± SEM is shown.
Discussion
In this study, we used patients with CBD to assess the role of CD27 in the beryllium-induced immune response. Due to the compartmentalization of large numbers of Ag-specific CD4+ T cells in an accessible target organ, CBD is an ideal model system in which to investigate costimulatory requirements for T cell activation in a human disease. In this report we show that the majority of beryllium-responsive CD4+ T cells in blood and lungs of CBD patients lack CD27 expression. In the circulating pool and target organ, retention of CD27 expression on CD4+ T cells was seen on FoxP3-expressing, naturally occurring Treg cells, and this Treg cell subset expressed potent suppressor function. Coexpression of CD27 and CD25 substantially improved the detection of this T cell subset in both compartments. Thus, these studies show that CD27 is differentially expressed on Ag-specific TEM cells and FoxP3-expressing Treg cells and can be used in combination with CD25 for the identification of Treg cells in the setting of an ongoing CD4+ T cell alveolitis.
Members of the TNF receptor family such as CD27, OX-40, and 4-1BB, play an important role in the regulation of lymphocyte function, having been implicated in cell proliferation, differentiation, survival, and migration (12). With CD28 independence of beryllium-responsive CD4+ T cells in BAL (9), we have recently shown that 4-1BB assumes an important role in the beryllium-induced immune response in the target organ, enhancing T cell proliferation and preventing activation-induced cell death (10). Conversely, overexpression of OX-40 ligand on APCs had no effect on the proliferation of beryllium-specific CD4+ T cells, suggesting that OX-40 plays no role in this disease (10). CD27 has been found to be essential for the generation and maintenance of Ag-specific T cells (17). However, unlike CD28, CD27 does not affect cell cycle entry or activity but promotes T cell expansion through enhancement of survival (16, 17). Borst and colleagues (16) have shown that CD27 is the principle determinant for the accumulation of influenza-specific T cells in the lung. Whether the same is true in humans is difficult to address. Our data show that the majority of BAL CD4+ T cells and essentially all beryllium-responsive T cells that reside in the lung in the setting of an active alveolitis lack surface CD27 expression. However, a subset of circulating beryllium-specific CD4+ T cells retains CD27 expression. These findings suggest that these cells are less differentiated than their lung counterparts and raise the possibility that these cells are in transit to the lung, the predominant organ in which beryllium is deposited. In addition, the loss of CD27 from differentiated beryllium-responsive CD4+ T cells suggests that the effects of CD27 occur early in the adaptive immune response.
Recently, a stepwise differentiation of memory CD4+ T cells was defined using expression of CCR7 and CD27 (26). In vitro stimulation of PBMCs with either anti-CD3 or PMA/ionomycin led to a differentiation from naive to CCR7+CD27+ to CCR7−CD27+ and, finally, to CCR7−CD27−. This stepwise differentiation was associated with a shorter telomere length, decreased proliferative capacity, and increased susceptibility to apoptosis, suggesting that CD27 and CCR7 could be used to define distinct maturational stages of memory CD4+ T cells with different functional capacities (26). Investigating the memory phenotype of ex vivo Ag-specific CD4+ T cells in BAL of CBD patients, we noted that the majority of beryllium-responsive T cells were terminally differentiated CCR7−CD27− memory cells. However, the remainder of the beryllium-responsive T cell subset retained CCR7 expression in the absence of CD27. This subset of memory T cells was not investigated in the study by Fritsch et al. (26) and likely represents an intermediary stage of T cell differentiation before the loss of CCR7. Importantly, we have previously shown that the expression of CCR7 does not change during the short time span of the intracellular cytokine staining assay (7). In contrast, the majority of beryllium-responsive CD4+ T cells in blood were distributed between the CCR7+CD27+ and CCR7−CD27− subsets, with the remainder of cells being either CCR7+CD27− and CCR7−CD27+. Thus, in both blood and BAL, a significant proportion of beryllium-specific CD4+ T cells were CCR7+CD27−, suggesting that the differentiation of memory T cells in response to Ag is likely more complex than the model proposed by Fritsch and colleagues (26).
Naturally occurring Treg cells are derived from the thymus and are characterized as CD4+ with a high level of CD25 expression (CD4+CD25high). Depletion of these CD4+CD25+ T cells, which comprise 5–10% of circulating CD4+ T cells, results in the spontaneous onset of multiorgan autoimmunity (29 – 32). Naturally occurring Treg cells are thought to mediate their effects through cell contact and are anergic to in vitro stimulation (28, 33). FoxP3, a member of the Forkhead winged helix family of transcription factors, has been identified as a specific molecular marker for Treg cells, and its expression is essential for programming both thymic development and function of Treg cells (34 –36).
One of the difficulties in the study of Treg cells in human disease is the lack of a specific cell surface marker that reliably separates this T cell subset from other T cell populations. In addition, due to the increased expression of CD25 on activated effector T cells, it has been difficult to evaluate the functional capacity of Treg cells at sites of inflammation. Thus, CD25 loses its specificity for Treg cells in a target organ such as the lung. Within the synovial fluid of patients with juvenile idiopathic arthritis, Ruprecht et al. (27) found that FoxP3-expressing CD4+ Treg cells coexpressed CD25 and CD27. Interestingly, CD25dimCD27+ and CD25highCD27+ T cells expressed comparable amounts of FoxP3 (27). Using blood and BAL from CBD patients, we observed that only 56 and 33% of CD4+ CD25high T cells in blood and lungs, respectively, expressed intracellular FoxP3. However, combining the expression of CD25 and CD27 significantly improved the detection of FoxP3-expressing Treg cells, and these cells were capable of suppressing effector T cell function.
A recent paper by Liu et al. (37) demonstrated that the loss of CD127 (IL-7 receptor) on CD4+ T cells denoted the human Treg cell subset. In comparison with our data shown in Fig. 7, we observed a similar frequency of FoxP3+ cells in the blood CD4+CD25+CD27+ T cell subset compared with the data published by Liu et al. (37) in the CD4+CD25+CD127− T cell subset. Thus, we believe that the coexpression of CD25 and CD27 on blood and BAL CD4+ T cells marks the vast majority of Foxp3-expressing Treg cells in the blood and lungs of human subjects. Consistent with our findings, a recent study showed that CD27 could be used to discriminate between regulatory and nonregulatory cells after expansion of human CD4+CD25+ T cells derived from blood (38). However, in contrast to CD127, which may be used in the absence of CD25 for the detection of Treg cells (37), it is clear that CD27 alone is inadequate for the detection of Treg cells because naive and some memory T cells express this molecule.
While Ag-specific CD4+ TEM cells residing in the lung have down-regulated CD27, it is curious that FoxP3-expressing Treg cells retain CD27 expression. In the presence of exogenous IL-2, proliferating Treg cells maintain high expression of CD27, suggesting that CD27 is a stable marker of this T cell subset (27). Ligation of the CD27 receptor does not induce high levels of IL-2 secretion by T cells (39). Consistent with this observation, naturally occurring Treg cells do not express IL-2 but require IL-2 for thymic generation and peripheral maintenance (40). Although the role of CD27 in Treg cells is not presently known, it is possible that the antiapoptotic functions of CD27 contribute to the maintenance of this T cell subset in vivo.
In summary, we have shown that BAL CD4+ T cells, including beryllium-specific CD4+ T cells, lack CD27 expression, whereas FoxP3-expressing Treg cells are localized to the subset of lung T cells that retain this cell surface marker. Coexpression of CD27 and CD25 identifies the majority of FoxP3-expressing Treg cells in blood and BAL and is vastly superior to the use of CD25 alone. This combination of cell surface markers will enable the identification and isolation of Treg cells from the lung and a determination of their functional capacity in the setting of an ongoing adaptive immune response.
Footnotes
This work was supported by National Institutes of Health Grants HL62410, ES011810, and AI050864 (to A.P.F.) and M01-RR00051 from the Division of Research Resources, General Clinical Research Center.
Abbreviations used in this paper: CBD, chronic beryllium disease; BAL, bronchoalveolar lavage; BeS, beryllium-sensitized; BeSO4, beryllium sulfate; TEM cells, effector memory T; Treg, regulatory T; SEB, staphylococcal enterotoxin B.
Disclosures
The authors have no financial conflict of interest.
References
- 1.Newman LS, Maier LA. Beryllium disease. In: Schwarz MI, King TE Jr, editors. Interstitial Lung Disease. 3. BC Decker; Hamilton, Ontario: 2003. pp. 435–451. [Google Scholar]
- 2.Maier LA, McGrath DS, Sato H, Lympany P, Welsh K, Du Bois R, Silveira L, Fontenot AP, Sawyer RT, Wilcox E, Newman LS. Influence of MHC class II in susceptibility to beryllium sensitization and chronic beryllium disease. J Immunol. 2003;171:6910–6918. doi: 10.4049/jimmunol.171.12.6910. [DOI] [PubMed] [Google Scholar]
- 3.Richeldi L, Sorrentino R, Saltini C. HLA-DPB1 glutamate 69: a genetic marker of beryllium disease. Science. 1993;262:242–244. doi: 10.1126/science.8105536. [DOI] [PubMed] [Google Scholar]
- 4.Rossman MD, Stubbs J, Lee CW, Argyris E, Magira E, Monos D. Human leukocyte antigen class II amino acid epitopes: susceptibility and progression markers for beryllium hypersensitivity. Am J Respir Crit Care Med. 2002;165:788–794. doi: 10.1164/ajrccm.165.6.2104002. [DOI] [PubMed] [Google Scholar]
- 5.Wang Z, White PS, Petrovic M, Tatum OL, Newman LS, Maier LA, Marrone BL. Differential susceptibilities to chronic beryllium disease contributed by different Glu69 HLA-DPB1 and -DPA1 alleles. J Immunol. 1999;163:1647–1653. [PubMed] [Google Scholar]
- 6.Fontenot AP, Canavera SJ, Gharavi L, Newman LS, Kotzin BL. Target organ localization of memory CD4+ T cells in patients with chronic beryllium disease. J Clin Invest. 2002;110:1473–1482. doi: 10.1172/JCI15846. [DOI] [PMC free article] [PubMed] [Google Scholar]
- 7.Fontenot AP, Palmer BE, Sullivan AK, Joslin FG, Wilson CC, Maier LA, Newman LS, Kotzin BL. Frequency of beryllium-specific, central memory CD4+ T cells in blood determines proliferative response. J Clin Invest. 2005;115:2886–2893. doi: 10.1172/JCI24908. [DOI] [PMC free article] [PubMed] [Google Scholar]
- 8.Tinkle SS, Kittle LA, Schumacher BA, Newman LS. Beryllium induces IL-2 and IFN-γ in berylliosis. J Immunol. 1997;158:518–526. [PubMed] [Google Scholar]
- 9.Fontenot AP, Gharavi L, Bennett SR, Canavera SJ, Newman LS, Kotzin BL. CD28 costimulation independence of target organ versus circulating memory antigen-specific CD4+ T cells. J Clin Invest. 2003;112:776–784. doi: 10.1172/JCI18317. [DOI] [PMC free article] [PubMed] [Google Scholar]
- 10.Mack DG, Lanham AK, Palmer BE, Maier LA, Watts TH, Fontenot AP. 4-1BB enhances proliferation of beryllium-specific T cells in the lung of subjects with chronic beryllium disease. J Immunol. 2008;181:4381–4388. doi: 10.4049/jimmunol.181.6.4381. [DOI] [PMC free article] [PubMed] [Google Scholar]
- 11.Palmer BE, Mack DG, Martin AK, Gillespie M, Mroz MM, Maier LA, Fontenot AP. Up-regulation of programmed death-1 expression on beryllium-specific CD4+ T cells in chronic beryllium disease. J Immunol. 2008;180:2704–2712. doi: 10.4049/jimmunol.180.4.2704. [DOI] [PMC free article] [PubMed] [Google Scholar]
- 12.Watts TH. TNF/TNFR family members in costimulation of T cell responses. Annu Rev Immunol. 2005;23:23–68. doi: 10.1146/annurev.immunol.23.021704.115839. [DOI] [PubMed] [Google Scholar]
- 13.Hintzen RQ, de Jong R, Lens SM, Brouwer M, Baars P, van Lier RA. Regulation of CD27 expression on subsets of mature T-lymphocytes. J Immunol. 1993;151:2426–2435. [PubMed] [Google Scholar]
- 14.Hamann D, Baars PA, Rep MH, Hooibrink B, Kerkhof-Garde SR, Klein MR, van Lier RA. Phenotypic and functional separation of memory and effector human CD8+ T cells. J Exp Med. 1997;186:1407–1418. doi: 10.1084/jem.186.9.1407. [DOI] [PMC free article] [PubMed] [Google Scholar]
- 15.van Lier RA, Borst J, Vroom TM, Klein H, Van Mourik P, Zeijlemaker WP, Melief CJ. Tissue distribution and biochemical and functional properties of Tp55 (CD27), a novel T cell differentiation antigen. J Immunol. 1987;139:1589–1596. [PubMed] [Google Scholar]
- 16.Hendriks J, Xiao Y, Borst J. CD27 promotes survival of activated T cells and complements CD28 in generation and establishment of the effector T cell pool. J Exp Med. 2003;198:1369–1380. doi: 10.1084/jem.20030916. [DOI] [PMC free article] [PubMed] [Google Scholar]
- 17.Hendriks J, Gravestein LA, Tesselaar K, van Lier RA, Schumacher TN, Borst J. CD27 is required for generation and long-term maintenance of T cell immunity. Nat Immunol. 2000;1:433–440. doi: 10.1038/80877. [DOI] [PubMed] [Google Scholar]
- 18.Newman LS, Kreiss K, King TE, Jr, Seay S, Campbell PA. Pathologic and immunologic alterations in early stages of beryllium disease: reexamination of disease definition and natural history. Am Rev Respir Dis. 1989;139:1479–1486. doi: 10.1164/ajrccm/139.6.1479. [DOI] [PubMed] [Google Scholar]
- 19.Rossman MD, Kern JA, Elias JA, Cullen MR, Epstein PE, Preuss OP, Markham TN, Daniele RP. Proliferative response of bronchoalveolar lymphocytes to beryllium. Ann Intern Med. 1988;108:687–693. doi: 10.7326/0003-4819-108-5-687. [DOI] [PubMed] [Google Scholar]
- 20.Newman LS. Significance of the blood beryllium lymphocyte proliferation test. Environ Health Perspect. 1996;104:953–956. doi: 10.1289/ehp.96104s5953. [DOI] [PMC free article] [PubMed] [Google Scholar]
- 21.Mroz MM, Kreiss K, Lezotte DC, Campbell PA, Newman LS. Reexamination of the blood lymphocyte transformation test in the diagnosis of chronic beryllium disease. J Allergy Clin Immunol. 1991;88:54–60. doi: 10.1016/0091-6749(91)90300-d. [DOI] [PubMed] [Google Scholar]
- 22.Fontenot AP, Kotzin BL, Comment CE, Newman LS. Expansions of T-cell subsets expressing particular T cell receptor variable regions in chronic beryllium disease. Am J Respir Cell Mol Biol. 1998;18:581–589. doi: 10.1165/ajrcmb.18.4.2981. [DOI] [PubMed] [Google Scholar]
- 23.Fontenot AP, Falta MT, Freed BM, Newman LS, Kotzin BL. Identification of pathogenic T cells in patients with beryllium-induced lung disease. J Immunol. 1999;163:1019–1026. [PubMed] [Google Scholar]
- 24.de Bree GJ, van Leeuwen EM, Out TA, Jansen HM, Jonkers RE, van Lier RA. Selective accumulation of differentiated CD8+ T cells specific for respiratory viruses in the human lung. J Exp Med. 2005;202:1433–1442. doi: 10.1084/jem.20051365. [DOI] [PMC free article] [PubMed] [Google Scholar]
- 25.Campbell JJ, Murphy KE, Kunkel EJ, Brightling CE, Soler D, Shen Z, Boisvert J, Greenberg HB, Vierra MA, Goodman SB, et al. CCR7 expression and memory T cell diversity in humans. J Immunol. 2001;166:877–884. doi: 10.4049/jimmunol.166.2.877. [DOI] [PubMed] [Google Scholar]
- 26.Fritsch RD, Shen X, Sims GP, Hathcock KS, Hodes RJ, Lipsky PE. Stepwise differentiation of CD4 memory T cells defined by expression of CCR7 and CD27. J Immunol. 2005;175:6489–6497. doi: 10.4049/jimmunol.175.10.6489. [DOI] [PubMed] [Google Scholar]
- 27.Ruprecht CR, Gattorno M, Ferlito F, Gregorio A, Martini A, Lanzavecchia A, Sallusto F. Coexpression of CD25 and CD27 identifies FoxP3+ regulatory T cells in inflamed synovia. J Exp Med. 2005;201:1793–1803. doi: 10.1084/jem.20050085. [DOI] [PMC free article] [PubMed] [Google Scholar]
- 28.Baecher-Allan C, Brown JA, Freeman GJ, Hafler DA. CD4+CD25high regulatory cells in human peripheral blood. J Immunol. 2001;167:1245–1253. doi: 10.4049/jimmunol.167.3.1245. [DOI] [PubMed] [Google Scholar]
- 29.Sakaguchi S, Fukuma K, Kuribayashi K, Masuda T. Organ-specific autoimmune diseases induced in mice by elimination of T cell subset. I. Evidence for the active participation of T cells in natural self-tolerance; deficit of a T cell subset as a possible cause of autoimmune disease. J Exp Med. 1985;161:72–87. doi: 10.1084/jem.161.1.72. [DOI] [PMC free article] [PubMed] [Google Scholar]
- 30.Sakaguchi S, Sakaguchi N, Asano M, Itoh M, Toda M. Immunologic self-tolerance maintained by activated T cells expressing IL-2 receptor α-chains (CD25): breakdown of a single mechanism of self-tolerance causes various autoimmune diseases. J Immunol. 1995;155:1151–1164. [PubMed] [Google Scholar]
- 31.Sakaguchi S. Regulatory T cells: key controllers of immunologic self-tolerance. Cell. 2000;101:455–458. doi: 10.1016/s0092-8674(00)80856-9. [DOI] [PubMed] [Google Scholar]
- 32.Shevach EM. Regulatory T cells in autoimmmunity. Annu Rev Immunol. 2000;18:423–449. doi: 10.1146/annurev.immunol.18.1.423. [DOI] [PubMed] [Google Scholar]
- 33.Thornton AM, Shevach EM. CD4+CD25+ immunoregulatory T cells suppress polyclonal T cell activation in vitro by inhibiting interleukin 2 production. J Exp Med. 1998;188:287–296. doi: 10.1084/jem.188.2.287. [DOI] [PMC free article] [PubMed] [Google Scholar]
- 34.Brunkow ME, Jeffery EW, Hjerrild KA, Paeper B, Clark LB, Yasayko SA, Wilkinson JE, Galas D, Ziegler SF, Ramsdell F. Disruption of a new forkhead/winged-helix protein, scurfin, results in the fatal lymphoproliferative disorder of the scurfy mouse. Nat Genet. 2001;27:68–73. doi: 10.1038/83784. [DOI] [PubMed] [Google Scholar]
- 35.Fontenot JD, Gavin MA, Rudensky AY. Foxp3 programs the development and function of CD4+CD25+ regulatory T cells. Nat Immunol. 2003;4:330–336. doi: 10.1038/ni904. [DOI] [PubMed] [Google Scholar]
- 36.Marie JC, Letterio JJ, Gavin M, Rudensky AY. TGF-β1 maintains suppressor function and Foxp3 expression in CD4+CD25+ regulatory T cells. J Exp Med. 2005;201:1061–1067. doi: 10.1084/jem.20042276. [DOI] [PMC free article] [PubMed] [Google Scholar]
- 37.Liu W, Putnam AL, Xu-Yu Z, Szot GL, Lee MR, Zhu S, Gottlieb PA, Kapranov P, Gingeras TR, Fazekas de St Groth B, et al. CD127 expression inversely correlates with FoxP3 and suppressive function of human CD4+ Treg cells. J Exp Med. 2006;203:1701–1711. doi: 10.1084/jem.20060772. [DOI] [PMC free article] [PubMed] [Google Scholar]
- 38.Duggleby RC, Shaw TN, Jarvis LB, Kaur G, Gaston JS. CD27 expression discriminates between regulatory and non-regulatory cells after expansion of human peripheral blood CD4+CD25+ cells. Immunology. 2007;121:129–139. doi: 10.1111/j.1365-2567.2006.02550.x. [DOI] [PMC free article] [PubMed] [Google Scholar]
- 39.Hintzen RQ, Lens SM, Lammers K, Kuiper H, Beckmann MP, van Lier RA. Engagement of CD27 with its ligand CD70 provides a second signal for T cell activation. J Immunol. 1995;154:2612–2623. [PubMed] [Google Scholar]
- 40.Sakaguchi S. Naturally arising Foxp3-expressing CD25+CD4+ regulatory T cells in immunological tolerance to self and non-self. Nat Immunol. 2005;6:345–352. doi: 10.1038/ni1178. [DOI] [PubMed] [Google Scholar]