Abstract
The NMR structure of the rat calreticulin P-domain, comprising residues 189–288, CRT(189–288), shows a hairpin fold that involves the entire polypeptide chain, has the two chain ends in close spatial proximity, and does not fold back on itself. This globally extended structure is stabilized by three antiparallel β-sheets, with the β-strands comprising the residues 189–192 and 276–279, 206–209 and 262–265, and 223–226 and 248–251, respectively. The hairpin loop of residues 227–247 and the two connecting regions between the β-sheets contain a hydrophobic cluster, where each of the three clusters includes two highly conserved tryptophyl residues, one from each strand of the hairpin. The three β-sheets and the three hydrophobic clusters form a repeating pattern of interactions across the hairpin that reflects the periodicity of the amino acid sequence, which consists of three 17-residue repeats followed by three 14-residue repeats. Within the global hairpin fold there are two well-ordered subdomains comprising the residues 219–258, and 189–209 and 262–284, respectively. These are separated by a poorly ordered linker region, so that the relative orientation of the two subdomains cannot be precisely described. The structure type observed for CRT(189–288) provides an additional basis for functional studies of the abundant endoplasmic reticulum chaperone calreticulin.
The two homologous calcium-binding proteins calnexin (CNX) and calreticulin (CRT) serve as molecular chaperones in the endoplasmic reticulum (ER) of eukaryotic cells. They transiently bind to the majority of nascent and newly synthesized glycoproteins in the cell (1–5). The association promotes efficient folding and oligomeric assembly, and helps to retain the glycoproteins in the ER while they are still incompletely folded (5, 6). CNX and CRT are lectins that associate with the partially trimmed, monoglucosylated N-linked oligosaccharide moieties attached to the substrate proteins (5, 7–9). They cooperate in the ER with several independently acting enzymes that are involved in oligosaccharide trimming—i.e., glucosidases I and II and mannosidase I—and with the UDP-glucose:glycoprotein glucosyltransferase, which functions as a folding sensor (10–12). In this cooperative action, CNX and CRT have primarily a binding function, and the enzymes regulate the on–off cycle. CNX and CRT also associate with a thiol oxidoreductase, ERp57, which interacts with cysteines in the substrate glycoproteins (12, 13). In addition to their well-characterized association with glycan moieties, both CNX and CRT have been shown to bind to unfolded unglycosylated polypeptides and prevent their aggregation in vitro (14, 15). It remains to be seen whether this type of interaction observed in vitro has a counterpart in the ER of living cells.
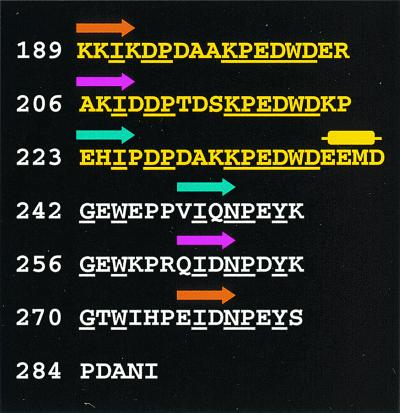
In this study we used nuclear magnetic resonance (NMR) spectroscopy to solve the three-dimensional structure of the central “P-domain” of CRT, comprising residues 189–288, CRT(189–288). The P-domain is thought to be involved in substrate binding (9) and to contain a high-affinity calcium-binding site (16). Alternatively, it could be involved in protein–protein interactions (17). The amino acid sequence of this domain is highly conserved and is characteristic for this family of lectins (18, 19). It is composed in its entire length of multiple copies of two types of short, proline-rich, repeat sequences, with the type 1 repeats comprising 17 residues and the type 2 repeats 14 residues (Fig. 1). The arrangement of these is “111222” in CRT (Fig. 1) and “11112222” in CNX. On the basis of the three-dimensional structure of CRT, potential implications for its function as a molecular chaperone are discussed.
Figure 1.
Alignment of the sequence repeats in rat CRT(189–288). The three 17-residue type 1 repeats are shown in yellow, and the three 14-residue type 2 repeats are white. The positions of the strands in three short antiparallel β-sheets are indicated by orange, red, and blue arrows above the sequence. The position of a helical turn, which includes a two-residue insert between the third and fourth repeat, is shown by a yellow cylinder above the sequence. Residues conserved in all three repeats of one type are underlined.
Materials and Methods
Recombinant uniformly 13C,15N-labeled CRT(189–288) was prepared as described previously (20). For the structure determination we used a 3 mM protein solution in 95% H2O/5% D2O (vol/vol) and a 1.5 mM solution in 100% D2O, which contained 10 mM CaCl2 at pH 6.3.
The NMR measurements were performed on Bruker DRX750 and DRX800 spectrometers equipped with four radio-frequency channels and triple resonance probeheads with shielded z-gradient coils. For the collection of conformational constraints the following three experiments were recorded with a nuclear Overhauser enhancement (NOE) spectroscopy (NOESY) mixing time τm = 60 ms at T = 20°C: (i) three-dimensional (3D) combined 15N/13C-resolved [1H,1H]-NOESY (21, 22) in H2O; 282(t1) × 42(t2) × 1024(t3) complex points, t1,max(1H) = 29.9 ms, t2,max(15N) = 36 ms, t2,max(13C) = 8.9 ms, t3,max(1H) = 85 ms; (ii) 3D 13C-resolved [1H,1H]-NOESY (21) in H2O with the 13C carrier frequency in the aromatic region; 350(t1) × 38(t2) × 1024(t3) complex points, t1,max(1H) = 29.8 ms, t2,max(13C) = 6.4 ms, t3,max(1H) = 100 ms; and (iii) 3D 13C-resolved [1H,1H]-NOESY (21) in D2O with the 13C carrier frequency in the aliphatic region; 204(t1) × 40(t2) × 2048(t3) complex points, t1,max(1H) = 19.8 ms, t2,max(13C) = 7 ms, t3,max(1H) = 170 ms. The data were typically zero-filled to 512 × 128 × 2048 points. Before Fourier transformation the data matrices were multiplied with a cosine bell window (23). The 1H, 15N, and 13C chemical shifts are calibrated relative to 2,2-dimethyl-2-silapentane-5-sulfonate, sodium salt (DSS).
For hydrogen–deuterium exchange studies an H2O solution of CRT(189–288) was lyophilized and redissolved in D2O, and a series of 11 two-dimensional [15N,1H]-correlated spectroscopy (COSY) spectra were recorded within 976 min, with a time domain data size of 128 × 1024 complex points, t1,max(15N) = 54 ms and t2,max(1H) = 108 ms. The first spectrum was completed 9 min after the protein had been redissolved in D2O.
NOE cross peak assignments were obtained by using the module candid (T.H., P.G., and K.W., unpublished work) in the program dyana (24). candid/dyana performs automated assignment and distance calibration of NOE intensities, removal of meaningless distance constraints, structure calculation with torsion angle dynamics, and automatic NOE upper distance limit violation analysis. Peak lists of the three aforementioned NOESY spectra were generated by interactive peak picking with the program xeasy (25) and automatic integration of the peak volumes with the program spscan (Ralf Glaser, personal communication). The input further contained three corresponding chemical shift lists (20), and 42 dihedral angle constraints for the backbone angles φ and ψ that were derived from Cα shifts (26). The candid/dyana calculation consisted of 7 cycles of iterative NOE assignment and structure calculation. During the first six candid cycles, ambiguous distance constraints (27) and distance constraints for six hydrogen bonds in three interactively identified β-sheets (20) were used. For the final structure calculation, the only distance constraints that were retained were those that correspond to NOE cross peaks that were unambiguously assigned after the sixth cycle of calculation. Sixty-two stereospecific assignments were identified by comparison of upper distance limits with the structure resulting from the sixth candid cycle (28). The 20 conformers with the lowest final dyana target function values were energy-minimized in a water shell with the program opalp (29, 30), using the AMBER force field (31). The program molmol (32) was used to analyze the resulting 20 energy-minimized conformers and to prepare drawings of the structures.
Results
Structure Determination.
The structure determination of CRT(189–288) was based on the previously reported sequence-specific resonance assignments [ref. 20; BioMagResBank (BMRB) accession no. 4878]. The assignments are complete except for the backbone amide protons of Arg-205 and Gly-270, Hδ of Lys-190, Hα of Lys-198, Hγ of Pro-199, Hγ, Hδ and Hɛ of Lys-215, Hγ and Hδ of Pro-216, Hβ of Lys-221, Hɛ3 of Trp-244, Hɛ3 and Hζ3 of Trp-258, Hβ of Asn-265, Hɛ3 of Trp-272, Hα of His-274, and Hγ2 of Ile-288. All 16 Pro residues showed 13Cβ shifts near 32 ppm, which is indicative of the trans conformation (33). For 14 of these 16 Xxx–Pro bonds the trans conformation was independently also evidenced by strong sequential dαδ or dβδ NOE connectivities (34).
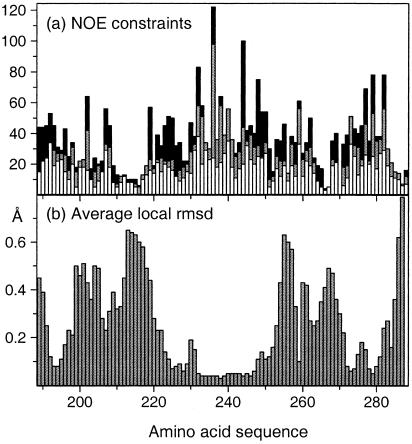
Using the NOE cross peak lists described in Materials and Methods, which contained a total of 5,534 NOE cross peaks, and chemical shift lists derived from the sequence-specific assignments, the program package candid/dyana (see Materials and Methods) yielded assignments for 2,023 meaningful NOE upper distance limits (Fig. 3a), and the NMR structure of CRT(189–288) shown in Figs. 2, 4, and 5.
Figure 3.
(a) Number of NOE upper distance limits per residue in the amino acid sequence of CRT(189–288). The intraresidual and sequential upper distance limits are displayed as white bars, medium-range constraints are gray, and long-range constraints are black. (b) Average local backbone rmsd in CRT(189–288). The rmsd values plotted at the position of residue i were calculated for the N, Cα, and C′ atoms of the tripeptide segments of residues i − 1, i, and i + 1.
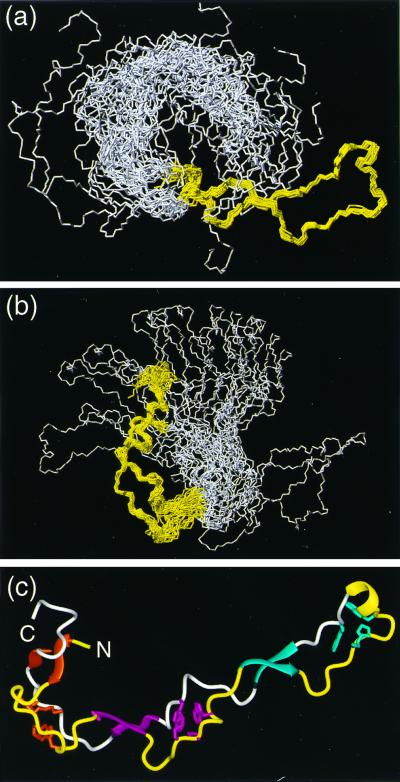
Figure 2.
(a and b) Bundles of the 20 energy-minimized conformers used to represent the NMR structure of CRT(189–288). (a) Superposition for best fit of the backbone atoms N, Cα, and C′ of the residues 219–258. (b) Superposition for best fit of the backbone atoms N, Cα, and C′ of the residues 189–209 and 262–284. In each drawing the polypeptide segments used for the superposition are colored yellow, and the remaining residues are white. (c) Cartoon of the conformer from a for which the white region is on the extreme left. The β-sheets and the helical turn on the extreme right are represented by ribbons and colored as in Fig. 1. The same color code is used for the three associated hydrophobic clusters. The polypeptide segments that connect the β-strands are drawn as thin cylindrical rods, which are yellow for the type 1 repeats and white for the type 2 repeats. Figs. 2–5 were prepared by using the program molmol (32).
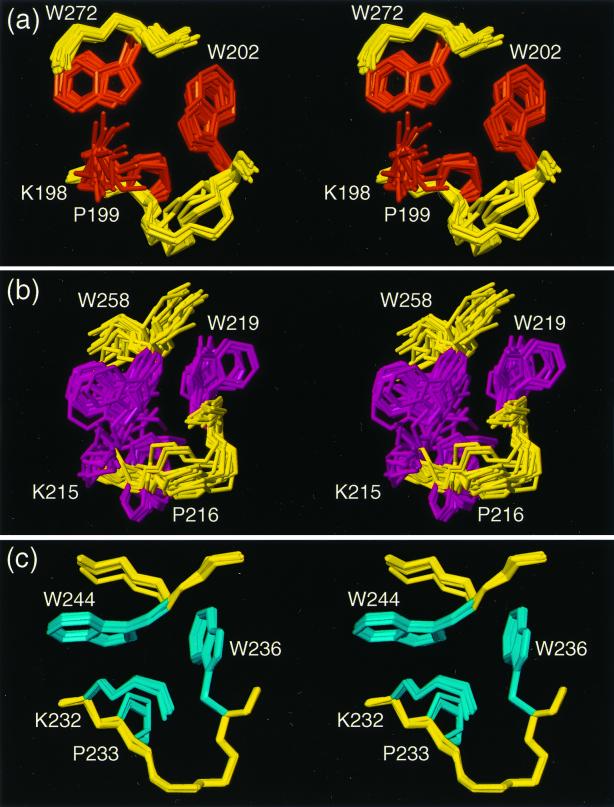
Figure 4.
Stereo views of the hydrophobic clusters in the CRT(189–288) structure. The local superpositions of the 20 conformers are for best fit of the backbone atoms N, Cα, and C′ of the following residues: (a) Lys-198, Pro-199, Trp-202, and Trp-272; (b) Lys-215, Pro-216, Trp-219, and Trp-258; (c) Lys-232, Pro-233, Trp-236, and Trp-244. The backbone segments, which do not coincide exactly with those used for the superpositions, are yellow. The amino acid side chains are colored as in Figs. 1 and 2.
Figure 5.
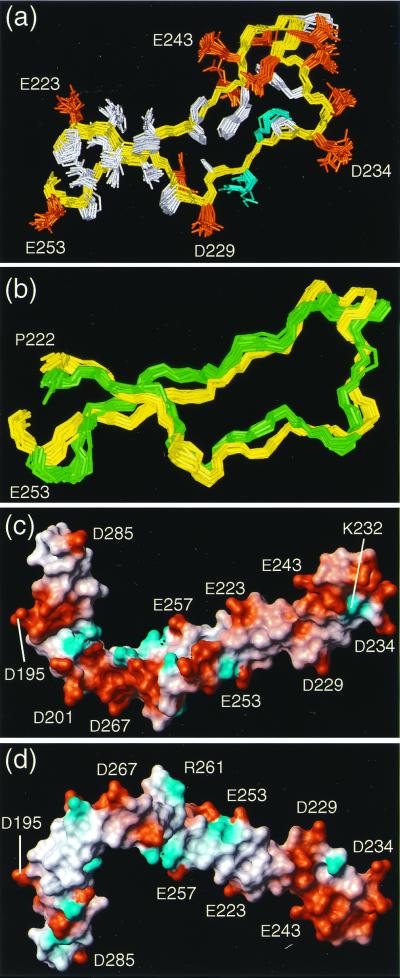
(a) Superposition for best fit of the backbone atoms N, Cα, and C′ of the residues 223–253 in CRT(189–288). The backbone is yellow. The side chains are blue for positively charged residues, red for negatively charged residues, and white for hydrophobic and polar residues. The positions of selected residues are indicated. (b) Superposition for best fit for the residues 222–253 of the mean structures of CRT(189–288) (yellow) and CRT(189–261) (green) (rmsd = 1.98 Å). For each of the two structures a set of 20 conformers is shown, which have been fitted individually to the respective mean coordinates. (c and d) Surface views of CRT(189–288). Red indicates negative electrostatic charges and blue, positive electrostatic charges. The positions of selected residues are indicated. The orientation of the molecule in c corresponds to that in Fig. 2c, and the orientation in d was obtained by a 180° rotation about a horizontal axis.
The CRT(189–288) Structure.
The NMR structure of CRT(189–288) is characterized by an extended hairpin fold, with the N and C termini in close proximity. The hairpin does not fold back on itself. Three short antiparallel β-sheets stabilize the structure, with β-strands comprising the residues 189–192 and 276–279, 206–209 and 262–265, and 223–226 and 248–251, respectively (Fig. 2c). This corresponds to the β-strands identified previously (20) by an interactive search of the NMR data (34), except that all strands have been extended by one residue to account for the presence of an additional hydrogen bond per β-sheet that was found in the refined structure. At the tip of the hairpin there is a 310 helical turn with the residues 238–241 (Fig. 2c). This peripheral loop of the hairpin also contains a well-defined hydrophobic cluster (Fig. 4c). At the location of the β-sheet with residues 223–226 and 248–251 the two hairpin strands cross over, and then run parallel all of the way to the two chain ends. Two additional hydrophobic clusters are formed by the polypeptide segments that link the three β-sheets (Fig. 4 a and b).
The average global root-mean-square deviation (rmsd) values relative to the mean coordinates of 0.69 ± 0.24 Å calculated for the backbone atoms of the residues 219–258, and of 1.01 ± 0.24 Å for the backbone atoms of the residues 189–206 and 262–284 (Table 1) show that the structure contains two separate, well-ordered subdomains. Their relative orientation cannot be precisely described because the two subdomains are separated by a central molecular region for which there are only sparse NOE constraints (Fig. 3a). In addition to the global rmsd, the local rmsd values for the individual residues in the “linker region” are also elevated (Fig. 3b). At present, the direct cause of the scarcity of NOEs in this region is not known, but it could be due to slow conformational exchange, because the corresponding resonances also show line broadening. A preliminary analysis of spin relaxation experiments yielded average values of T1(15N) ≈ 700 ms, T2(15N) ≈ 20 ms, and 15N{1H}NOE ≈ 0.4, which is quite different from the corresponding data for globular proteins of similar size.
Table 1.
Input for the structure calculation and characterization of the energy-minimized NMR structure of CRT(189–288)
| Quantity | Value* |
|---|---|
| NOE upper distance limits | 2,023 |
| Dihedral angle constraints | 42 |
| Residual target function, Å2 | 1.76 ± 0.49 |
| Residual NOE violations | |
| Number ≥0.1 Å | 16 ± 4 |
| Maximum, Å | 0.15 ± 0.07 |
| Residual angle violations | |
| Number ≥2.0° | 2 ± 1 |
| Maximum, ° | 3.45 ± 0.66 |
| AMBER energies, kcal/mol | |
| Total | −2,787 ± 149 |
| van der Waals | −180 ± 15 |
| Electrostatic | −3,609 ± 144 |
| rmsd from ideal geometry | |
| Bond lengths, Å | 0.0079 ± 0.0002 |
| Bond angles, ° | 2.14 ± 0.07 |
| rmsd to the mean coordinates, ņ | |
| bb (219–258) | 0.69 ± 0.24 |
| bb (189–209, 262–284) | 1.01 ± 0.24 |
| ha (219–258) | 1.15 ± 0.24 |
| ha (189–209, 262–284) | 1.49 ± 0.23 |
Except for the top two entries, the average for the 20 energy-minimized conformers with the lowest residual dyana target function values and the standard deviation among them are given.
bb indicates the backbone atoms N, Cα, and C′; ha stands for “all heavy atoms.” The numbers in parentheses indicate the residues for which the rmsd was calculated.
A search for structural homologues of CRT(189–288) was performed by using the program dali (35). No structurally homologous proteins were thus identified, indicating that the CRT(189–288) structure is a novel fold.
In the structure of CRT(189–288) the two strands of the global hairpin interact not only through formation of the three short β-sheets but also by amino acid side-chain interactions in the three aforementioned hydrophobic clusters (Fig. 2c). Each cluster involves two highly conserved tryptophyl residues, one from each strand of the hairpin, and the three clusters share a similar arrangement of the amino acid side chains (Fig. 4). The two tryptophyl rings are packed against the aliphatic region of prolyl and lysyl side chains located three and four sequence positions apart from one of the tryptophans. This structural arrangement gives rise to unusual 1H chemical shifts. For example, the Hβ proton chemical shifts are in the range 0.1 to 1.3 ppm, as compared with a typical value near 1.8 ppm (34), Hα of Lys-232 is at 1.89 ppm, as compared with a typical value near 4.3 ppm, and the Hδ1 resonances of Trp-244, Trp-258, and Trp-272 are shifted upfield from a typical value near 7.2 ppm to 5.29, 5.02, and 6.16 ppm, respectively. All these unusual chemical shifts can be qualitatively rationalized by ring current effects (34) from the nearby indole rings in the hydrophobic clusters.
There is also evidence for hydrogen bonding with amino acids in the hydrophobic clusters of Fig. 4. Amide proton exchange studies showed that the indole N–H moieties of the tryptophyl residues 202, 219, 236, 244, and 258 are among the best-protected protons in the entire structure, with exchange half-times ranging from 11 min for Trp-202 to 175 min for Trp-236. However, because hydrogen bonding partners can be readily identified only for Hɛ1 of Trp-219 and Trp-236, which point toward the backbone carbonyls of Glu-257 and Glu-243, respectively, the slow exchange for some or all of the other tryptophans may be due to solvent shielding by the hydrophobic environment.
Discussion
Amino Acid Sequence and 3D Structure of CRT(189–288).
The CRT P-domain sequence with the type 1 and type 2 repeats (Fig. 1) is highly conserved among different species. In particular, a tryptophyl residue within a KPEDWD segment in each type 1 repeat is strictly conserved in mammalian CRTs, and so is a tryptophyl residue within a GXW segment in each type 2 repeat (X is preferably Glu or Thr). These tryptophyl residues are involved in the formation of the hydrophobic clusters. The position of the β-strands is conserved within each type of sequence repeat (Fig. 1), and all β-strands are flanked by residues with low preference for β-strands. In particular, the prolines in CRT(189–288) are clustered near the β-strands (Fig. 1), and they seem to prevent the formation of longer β-sheets.
As a consequence of the CRT(189–288) sequence, consecutive β-strands are separated by 17 residues in the N-terminal half of the hairpin, and by 14 residues in the C-terminal half. The three additional residues per repeat in the N-terminal half are accommodated in bulges. These bulges are in part stabilized by the aforementioned hydrophobic clusters, but there are also less-well-defined segments with few NOE constraints (Fig. 3a). Overall, the uneven length of the sequence in the two hairpin strands appears to be a major cause of the presence of the less ordered “linker region” in the middle of the hairpin. The short β-sheets are probably another consequence of this uneven sequence, because the three additional residues would be difficult to accommodate with a shorter distance between the β-sheets. The apparent close correlation between the CRT(189–288) sequence and the 3D structure provides a plausible explanation for the high sequence conservation observed in the P-domain of CRTs ranging from plants and parasites to mammals (17).
Functional Implications of the CRT(189–288) Structure.
The function of CRT as a molecular chaperone has been extensively characterized at the cell biological and biochemical levels (for a recent review see ref. 36). It has been hypothesized that the P-domain plays a central role in the direct interaction of CRT with the oligosaccharide moiety of substrate glycoproteins (9). However, there is no apparent structural homology between the CRT P-domain and the presently known lectins. Furthermore, previous in vitro experiments have shown that a polypeptide fragment comprising the residues 189–300 of CRT does not bind to a natural glycoprotein substrate (37), whereas constructs with flanking regions on both sides of the P-domain do bind such substrates as well as isolated monoglucosylated glycans (9, 37). Although a functional role of the CRT P-domain in direct glycan interaction cannot presently be ruled out, these observations appear to favor models in which the P-domain may have other functions.
The elongated shape of CRT(189–288), with a topology that places the N and C termini in close proximity to each other (Fig. 2c), suggests that in the native protein the P-domain constitutes a protrusion from the CRT core. A similar structure would be predicted for CNX, where the P-domain protrusion would presumably be even longer because of the presence of an additional pair of sequence repeats. In such a structure the tip of the hairpin loop, which is the best-defined part of the structure (Table 1, Figs. 3b and 5a), seems most likely to constitute a protein ligand-binding site. In addition, the NMR structure of a CRT fragment comprising the residues 189–261 (unpublished work) shows that the residues 215–258 form an autonomous folding unit, with a structure highly similar to that of the corresponding segment in CRT(189–288) (Fig. 5b). The tip of the hairpin loop also distinguishes itself from the other parts of the molecule by the presence of a 310 helical turn (Fig. 2c), and by the pronounced negative surface charge (Fig. 5 c and d). If the tip of the P-domain does indeed constitute a binding site for an interacting protein, the inner repeats could serve as “spacers” for positioning the ligand-binding site at a discrete distance from the core of the protein.
A potential protein ligand for CRT(189–288) is the cochaperone ERp57. This thiol oxidoreductase of the protein disulfide isomerase family associates in vivo with both CRT and CNX, forms mixed disulfides with CNX- and CRT-bound substrate glycoproteins, and is likely to assist the formation of correct disulfide bonds (12, 38–40). The apparent plasticity of the P-domain could provide ERp57 with the ability to adapt sterically to a wide variety of different glycoprotein substrates that bind to CRT and CNX. An alternative potential protein ligand is the enzyme glucosidase II, which is responsible for releasing bound substrate glycoproteins from CRT and CNX by hydrolyzing the remaining glucose. The negative charges at the tip of the CRT(189–288) hairpin could support intermolecular interactions through electrostatic forces in complexes with any of these potential protein ligands.
Acknowledgments
Financial support by the Schweizerischer Nationalfonds [Projects 31.51054.97 (A.H.) and 31.49047.96 (K.W.)] and the use of the computing facilities of the Competence Center for Computational Chemistry of the Eidgenössische Technische Hochschule Zürich are gratefully acknowledged.
Abbreviations
- CNX
calnexin
- CRT
calreticulin
- CRT(189–288)
P-domain of rat CRT consisting of residues 189–288
- ER
endoplasmic reticulum
- NOE
nuclear Overhauser enhancement
- NOESY
NOE spectroscopy
- 3D
three-dimensional
- rmsd
root-mean-square deviation
Footnotes
Data deposition: Atomic coordinates for a bundle of 20 conformers and for a representative conformer of CRT(189–288) have been deposited in the Protein Data Bank, www.rcsb.org (PDB ID code 1hhn).
References
- 1.Hochstenbach F. Hum Cell. 1992;5:12–24. [PubMed] [Google Scholar]
- 2.Ou W J, Cameron P H, Thomas D Y, Bergeron J J. Nature (London) 1993;364:771–776. doi: 10.1038/364771a0. [DOI] [PubMed] [Google Scholar]
- 3.Nauseef J, McCormick S J, Clark R A. J Biol Chem. 1995;270:4741–4747. doi: 10.1074/jbc.270.9.4741. [DOI] [PubMed] [Google Scholar]
- 4.Peterson J R, Ora A, Van P N, Helenius A. Mol Biol Cell. 1995;6:1173–1184. doi: 10.1091/mbc.6.9.1173. [DOI] [PMC free article] [PubMed] [Google Scholar]
- 5.Hammond C, Braakman I, Helenius A. Proc Natl Acad Sci USA. 1994;91:913–917. doi: 10.1073/pnas.91.3.913. [DOI] [PMC free article] [PubMed] [Google Scholar]
- 6.Hebert D N, Foellmer B, Helenius A. EMBO J. 1996;15:2961–2968. [PMC free article] [PubMed] [Google Scholar]
- 7.Spiro R G, Zhu Q, Bhoyroo V, Soling H D. J Biol Chem. 1996;271:11588–11594. doi: 10.1074/jbc.271.19.11588. [DOI] [PubMed] [Google Scholar]
- 8.Ware F E, Vassilakos A, Peterson P A, Jackson M R, Lehrman M A, Williams D B. J Biol Chem. 1995;270:4697–4704. doi: 10.1074/jbc.270.9.4697. [DOI] [PubMed] [Google Scholar]
- 9.Vassilakos A, Michalak M, Lehrman M A, Williams D B. Biochemistry. 1998;37:3480–3490. doi: 10.1021/bi972465g. [DOI] [PubMed] [Google Scholar]
- 10.Helenius A, Trombetta E S, Hebert D N, Simons J F. Trends Cell Biol. 1997;7:193–200. [Google Scholar]
- 11.Bergeron J J, Zapun A, Ou W J, Hemming R, Parlati F, Cameron P H, Thomas D Y. Adv Exp Med Biol. 1998;435:105–116. doi: 10.1007/978-1-4615-5383-0_11. [DOI] [PubMed] [Google Scholar]
- 12.Oliver J D, Roderick H L, Llewellyn D H, High S. Mol Biol Cell. 1999;10:2573–2582. doi: 10.1091/mbc.10.8.2573. [DOI] [PMC free article] [PubMed] [Google Scholar]
- 13.Molinari M, Helenius A. Nature (London) 1999;402:90–93. doi: 10.1038/47062. [DOI] [PubMed] [Google Scholar]
- 14.Ihara Y, Cohen-Doyle M F, Saito Y, Williams D B. Mol Cell. 1999;4:331–341. doi: 10.1016/s1097-2765(00)80335-4. [DOI] [PubMed] [Google Scholar]
- 15.Saito Y, Ihara Y, Leach M R, Cohen-Doyle M F, Williams D B. EMBO J. 1999;18:6718–6729. doi: 10.1093/emboj/18.23.6718. [DOI] [PMC free article] [PubMed] [Google Scholar]
- 16.Baksh S, Michalak M. J Biol Chem. 1991;266:21458–21465. [PubMed] [Google Scholar]
- 17.Michalak M, Corbett E F, Mesaeli N, Nakamura K, Opas M. Biochem J. 1999;344:281–292. [PMC free article] [PubMed] [Google Scholar]
- 18.Wada I, Rindress D, Cameron P H, Ou W J, Doherty J J, Louvard D, Bell A W, Dignard D, Thomas D Y, Bergeron J J. J Biol Chem. 1991;266:19599–19610. [PubMed] [Google Scholar]
- 19.David V, Hochstenbach F, Rajagopalan S, Brenner M B. J Biol Chem. 1993;268:9585–9592. [PubMed] [Google Scholar]
- 20.Ellgaard L, Riek R, Braun D, Herrmann T, Helenius A, Wüthrich K. FEBS Lett. 2001;488:69–73. doi: 10.1016/s0014-5793(00)02382-6. [DOI] [PubMed] [Google Scholar]
- 21.Ikura M, Kay L E, Tschudin R, Bax A. J Magn Reson. 1990;86:204–209. doi: 10.1016/j.jmr.2011.09.004. [DOI] [PubMed] [Google Scholar]
- 22.Boelens R, Burgering M, Fogh R H, Kaptein R. J Biomol NMR. 1994;4:201–213. doi: 10.1007/BF00175248. [DOI] [PubMed] [Google Scholar]
- 23.DeMarco A, Wüthrich K. J Magn Reson. 1976;24:201–204. [Google Scholar]
- 24.Güntert P, Mumenthaler C, Wüthrich K. J Mol Biol. 1997;273:283–298. doi: 10.1006/jmbi.1997.1284. [DOI] [PubMed] [Google Scholar]
- 25.Bartels C, Xia T, Billeter M, Güntert P, Wüthrich K. J Biomol NMR. 1995;6:1–10. doi: 10.1007/BF00417486. [DOI] [PubMed] [Google Scholar]
- 26.Luginbühl P, Szyperski T, Wüthrich K. J Magn Reson B. 1995;109:229–233. [Google Scholar]
- 27.Nilges M, Macias M J, O'Donoghue S I, Oschkinat H. J Mol Biol. 1997;269:408–422. doi: 10.1006/jmbi.1997.1044. [DOI] [PubMed] [Google Scholar]
- 28.Folmer R H A, Hilbers C W, Konings R N H, Nilges M. J Biomol NMR. 1997;9:245–258. doi: 10.1023/a:1018670623695. [DOI] [PubMed] [Google Scholar]
- 29.Luginbühl P, Güntert P, Billetter M, Wüthrich K. J Biomol NMR. 1996;8:136–146. doi: 10.1007/BF00211160. [DOI] [PubMed] [Google Scholar]
- 30.Koradi R, Billetter M, Güntert P. Comput Phys Commun. 2000;124:139–147. [Google Scholar]
- 31.Cornell W D, Cieplak P, Bayly C I, Gould I R, Merz K M, Jr, Ferguson D M, Spellmeyer D C, Fox T, Caldwell J W, Kollman P A. J Am Chem Soc. 1995;117:5179–5197. [Google Scholar]
- 32.Koradi R, Billeter M, Wüthrich K. J Mol Graphics. 1996;14:51–55. doi: 10.1016/0263-7855(96)00009-4. [DOI] [PubMed] [Google Scholar]
- 33.Grathwohl C, Wüthrich K. Biopolymers. 1976;15:2025–2041. doi: 10.1002/bip.1976.360151012. [DOI] [PubMed] [Google Scholar]
- 34.Wüthrich K. NMR of Proteins and Nucleic Acids. New York: Wiley; 1986. [Google Scholar]
- 35.Holm L, Sander C. J Mol Biol. 1993;233:123–138. doi: 10.1006/jmbi.1993.1489. [DOI] [PubMed] [Google Scholar]
- 36.Parodi A J. Annu Rev Biochem. 2000;69:69–93. doi: 10.1146/annurev.biochem.69.1.69. [DOI] [PubMed] [Google Scholar]
- 37.Peterson J R, Helenius A. J Cell Sci. 1999;112:2775–2784. doi: 10.1242/jcs.112.16.2775. [DOI] [PubMed] [Google Scholar]
- 38.Oliver J D, van der Wal F J, Bulleid N J, High S. Science. 1997;275:86–8. doi: 10.1126/science.275.5296.86. [DOI] [PubMed] [Google Scholar]
- 39.Zapun A, Darby N J, Tessier D C, Michalak M, Bergeron J J, Thomas D Y. J Biol Chem. 1998;273:6009–6012. doi: 10.1074/jbc.273.11.6009. [DOI] [PubMed] [Google Scholar]
- 40.Molinari M, Helenius A. Nature (London) 1999;402:90–93. doi: 10.1038/47062. [DOI] [PubMed] [Google Scholar]


