

Abstract
Amyloid formation normally exhibits a lag phase followed by a growth phase, which leads to amyloid fibrils. Characterization of the species populated during the lag phase is experimentally challenging, but is critical since the most toxic entities may be pre-fibrillar species. p-Cyanophenylalanine (FC≡N) fluorescence is used to probe the nature of lag-phase species populated during the formation of amyloid by human islet amyloid polypeptide. The polypeptide contains two phenylalanines at positions 15 and 23 and a single tyrosine located at the C-terminus. Each aromatic residue was separately replaced by FC≡N. The substitutions do not perturb amyloid formation relative to wild-type islet amyloid polypeptide as detected using thioflavin T fluorescence and electron microscopy. FC≡N fluorescence is high when the cyano group is hydrogen bonded and low when it is not. It can also be quenched via Förster resonance energy transfer to tyrosine. Fluorescence intensity was monitored in real time and revealed that all three positions remained exposed to solvent during the lag phase but less exposed than unstructured model peptides. The time course of amyloid formation as monitored by thioflavin T fluorescence and FC≡N fluorescence is virtually identical. Fluorescence quenching experiments confirmed that each residue remains exposed during the lag phase. These results place significant constraints on the nature of intermediates that are populated during the lag phase and indicate that significant sequestering of the aromatic side chains does not occur until β-structure sufficient to bind thioflavin T has developed. Seeding studies and analysis of maximum rates confirm that sequestering of the cyano groups occurs concomitantly with the development of thioflavin T binding capability. Overall, the process of amyloid formation and growth appears to be remarkably homogenous in terms of side-chain ordering. FC≡N also provides information about fibril structure. Fluorescence emission measurements, infrared measurements, and quenching studies indicate that the aromatic residues are differentially exposed in the fibril state with Phe15 being the most exposed. FC≡N is readily accommodated into proteins; thus, the approach should be broadly applicable.
Keywords: amyloid, lag phase, IAPP, amylin, p-cyanophenylalanine
Introduction
The process of amyloid formation has been implicated in a wide range of human diseases including Parkinson’s disease, Alzheimer’s disease, and type 2 diabetes.1–5 The kinetics of amyloid formation are complex and normally exhibit a lag phase during which no amyloid fibrils are formed followed by a rapid growth phase leading to the final equilibrium between fibrils and soluble protein. The current view in the field is that intermediates in the assembly of amyloid may be the most toxic species and this has focused considerable attention on their properties.6–8
Unfortunately, there are few methods available that provide precise structural information on amyloid assembly in real time. An important tool used to probe transition-state structure in protein folding is the so-called φ-value or protein engineering method. However, this methodology is much less likely to be useful for studies of amyloid formation because the pathway of amyloid formation can be perturbed by mutations, amyloid fibrils can be polymorphic, and fibril morphology can be altered by seemingly modest changes in primary sequence or in solution conditions.9–12 CD spectroscopy probes secondary-structure formation but is not residue-specific. Solution-state NMR is generally not applicable because of the difficulty in obtaining high-resolution spectra of rapidly aggregating systems and the time resolution of solid-state NMR is not sufficient for studying kinetics. 2D-IR, in conjunction with specific isotope labeling, holds considerable promise but has not yet been applied to probe side chains, which may be the key to understanding the mechanism of amyloid formation.13
The intrinsic fluorescence of Trp can be used to follow amyloid formation, but many biologically important amyloidogenic polypeptides lack Trp. These include the Aβ peptide from Alzheimer’s disease, islet amyloid polypeptide (IAPP or amylin), which forms amyloid in type 2 diabetes, α-synuclein, which is associated with Parkinson’s disease, and calcitonin. Trp can obviously be introduced into the polypeptide of interest; however, it is not always a conservative substitution and may perturb the kinetics and/or mechanism of amyloid formation, or alter fibril morphology. A more subtle point is that Trp fluorescence is sensitive to a variety of factors and it can be difficult to develop an atomic-level understanding of the features that control Trp fluorescence during amyloid formation. Intrinsic Tyr fluorescence is weaker than Trp fluorescence and suffers from the same drawbacks, including the fact that substitution of Tyr for Phe or for a hydrophobic amino acid is not completely conservative, particularly if the site is buried.
The most common method for studying the kinetics of amyloid formation in vitro is to use fluorescence-detected thioflavin T binding assays. The fluorescence of thioflavin T is negligible in the absence of amyloid but is significantly enhanced upon binding to fibrils.14 However, it is not known what peptidic structure is necessary to bind thioflavin T and the exact relationship between binding and the enhancement in quantum yield is not fully understood.12,15–19 Thioflavin T assays, while useful, provide no information about the lag-phase species or about the role of specific side chains in the amyloid assembly process. In addition, thioflavin T is not a completely amyloid specific dye and there have been reports of it binding to non-amyloidogenic structures.12,16,17 These issues led us to explore the use of fluorescent non-coded amino acids to follow the kinetics of amyloid formation, specifically p-cyanophenylalanine (FC≡N or cyanoPhe).20
FC≡N is a non-coded amino acid that can readily be incorporated into proteins by recombinant methods and by solid-phase peptide synthesis.20–22 It has very desirable physiochemical and spectroscopic properties. The fluorescence of FC≡N is sensitive to hydrogen-bonding interactions involving the cyano group. The fluorescence quantum yield is high in water and low when the group is sequestered into a non-hydrogen-bonding environment, such as the hydrophobic core of a protein, the interior of an amyloid fibril, or in a protein–protein complex.20,23,24 FC≡N fluorescence can be selectively excited in the presence of a Tyr or a Trp and there are fewer problems associated with the water Raman peak than are observed with Tyr. The polarity of the cyano group is intermediate between that of an amide and a methylene, allowing it to be readily accommodated to the hydrophobic interior of a folded protein, and its size makes it a suitable substitution for Tyr or Phe.23 FC≡N also forms a useful Förster resonance energy transfer (FRET) pair with Trp or Tyr in which FC≡N acts as the donor.23,25–27 The R0 for the FC≡N–Trp pair is 16 Å and approximately 13 Å for a FC≡N–Tyr pair. These are useful distances for studies of chain compaction during folding and aggregation.28,29 The C≡N stretching frequency can also be useful as an infrared reporter of the local environment, providing information about solvation and internal electric fields.30–33 The C≡N stretch is found in an otherwise transparent region of protein IR spectra and shifts by ~10–12 cm−1 depending upon the degree of solvation.30
We use FC≡N substitutions to follow amyloid formation by IAPP (or amylin). IAPP is a 37-residue, highly amyloidogenic peptide that is stored and co-secreted with insulin from the β-cells of the pancreas.34,35 Amyloid formation by IAPP is believed to contribute to the pathology of type 2 diabetes and amyloid deposits have been found in up to 90% of autopsied individuals who suffered from type 2 diabetes.36–40 Islet amyloid formation is thought to induce apoptosis of the β-cells and to contribute to the decline in the mass of β-cells during type 2 diabetes.34,35,41 There is also increasing evidence suggesting that IAPP amyloid formation may contribute to graft failure in islet transplantation.42–45 We have shown that FC≡N is a conservative substitution for the C-terminal Tyr of IAPP and that its fluorescence can be used to detect fibril formation.20 In the present study, we characterize three analogs of IAPP in which each aromatic residue is separately substituted with FC≡N. We show that these substitutions provide non-perturbing probes of IAPP amyloid formation and use time-resolved studies of FC≡N fluorescence to follow the structural transitions that occur during amyloid formation. Chloride ion is an efficient quencher of FC≡N fluorescence and we exploit this effect to monitor the exposure of the three sites in real time. Seeding studies are used to follow the addition of soluble IAPP to preformed fibrils and provide site-specific information about the burial of each of the aromatic residues during fibril growth. Finally, the fluorescence studies are complimented by conducting IR measurements of the final fibril structure. The results reported here illustrate the utility of FC≡N fluorescence probes, as well as the advantages of combining fluorescence and IR studies. Virtually nothing is known about the nature of species populated during the lag phase and the present work provides new information about the process of IAPP amyloid assembly.46–48
Results
FC≡N substitutions do not perturb the kinetics of amyloid formation
IAPP contains an amidated C-terminus, a disulfide bridge between residues 2 and 7, and three aromatic residues: two phenylalanines at positions 15 and 23 and a tyrosine at position 37. None of the aromatic residues are absolutely required for amyloid formation, although a triple mutant in which each aromatic residue is replaced by Leu forms amyloid approximately 5-fold more slowly than wild type.49 The sequence of wild-type IAPP and the three FC≡N-substituted peptides are shown in Fig. 1 along with a molecular representation of FC≡N.
Fig. 1.

Primary sequence of human IAPP, with positions 15, 23, and 37 highlighted in red, and the three FC≡N variants. IAPP contains a disulfide between residues 2 and 7 and the C-terminus is amidated. X denotes the location of the FC≡N substitutions. The structure of FC≡N is shown.
The kinetics of amyloid formation for each of the three variants was followed by thioflavin T fluorescence and compared to wild type (Fig. 2). Amyloid formation by IAPP follows the typical pattern observed for the time course of fibril assembly, namely, a lag phase during which no significant fibril formation occurs followed by a rapid growth phase, which leads to the final state in which amyloid fibrils are in equilibrium with soluble peptide. Each of the three variants exhibit a thioflavin T binding time course typical of those observed for IAPP. The substitution has no noticeable effect at positions 23 and 37, and the measured t50 values, defined as the time to 50% completion, are identical with those of wild type (Table 1). An FC≡N substitution at position 15 (F15FC≡N) has a small but reproducible effect on the t50 value. t50 is reduced from 960±60 s (the uncertainty is the apparent standard deviation determined from multiple measurements) for wild-type IAPP under these conditions to 876±10 s, less than a 10% change. This is a modest effect and is less than has been observed for a number of other substitutions.48–50 The lag times, tlag (defined as the time required to reach 10% of the total fluorescence intensity), are also very similar to those of wild type. The lag times of each of the variants differ from the wild-type value by at most 8%. The maximum reaction velocities are also very close to the value observed for wild type. Overall, the data indicate that FC≡N substitutions have very modest effects on the time course of amyloid formation (Table 1). Transmission electron microscopy (TEM) images of each FC≡N peptide were recorded at the end of the reaction to check if the substitution perturbed fibril morphology. Dense mats of fibrils were observed for all three FC≡N variants and there were no detectable differences relative to wild-type IAPP (Fig. 2).
Fig. 2.

Thioflavin T monitored kinetics of the FC≡N variants of IAPP compared to wild type, together with TEM images of the FC≡N variants collected at the end of the reaction. Red curves are FC≡N variants and the black curve is wild-type IAPP. (a and b) IAPP F15FC≡N, (c and d) IAPP F23FC≡N, (e and f) IAPP Y37FC≡N. The scale bar in the TEM images represents 100 nm. Final conditions were 32 μM peptide, 2% HFIP, and 20 mM Tris–HCl at pH 7.4 and 25 °C.
Table 1.
Time course of amyloid formation for wild-type IAPP and the FC≡N variants as determined from the thioflavin-T-detected kinetic experiments
| t50 (s) | tlag (s) | vmax (nM/s) | |||||
|---|---|---|---|---|---|---|---|
| 15FC≡N | 899±10 | 841±16 | 4.48±0.71×10⁻³ | 158±3 | 0.087 | ||
| 23FC≡N | 967±41 | 875±40 | 3.12±0.08×10⁻³ | 155±15 | 0.094 | ||
| 37FC≡N | 1013±100 | 935±75 | 4.15±0.11×10⁻³ | 142±8 | 0.096 | ||
| WT | 960±60 | 870±66 | 4.86±0.21×10⁻³ | 168±13 | — |
Experiments were performed at 25 °C, pH 7.4, and 2% HFIP with constant stirring. The quoted uncertainties represent the standard deviation calculated from three independent runs.
The side chains of residues 15, 23, and 37 remain exposed during the lag phase
Having established that the substitutions do not significantly perturb the overall kinetic profile or the morphology of the fibrils, we next turned to use FC≡N fluorescence to probe fibril formation. We plotted the data as normalized fluorescence to facilitate a comparison of the three variants and to normalize for any local sequence effects that might modulate FC≡N fluorescence intensity in the absence of any defined structure, for example, proximity in primary sequence to potential side-chain quenchers. The non-normalized intensity of the t=0 spectra is very similar for each FC≡N variant and differs by less than 10%, suggesting that each site samples similar environments at t = 0 in terms of the relative exposure of the cyano group to solvent and/or quenching groups. Stern–Volmer analysis of quenching data described in subsequent sections indicates, however, that the cyano groups are less exposed to solvent early in the lag phase than found in a GGFC≡NAA control peptide.
A significant change in FC≡N fluorescence is observed for all three peptides upon amyloid formation (Fig. 3 and Table 2; Supplementary Information), with the fluorescence intensity of the fibril state being significantly lower. There are differences in the final relative fluorescence intensity between the three FC≡N peptides that reflect differences in the local environment of the aromatic side chains. The final FC≡N fluorescence intensity decreases to 40±1%, 26±1%, and 18±1% of their initial values for the 15FC≡N, 23FC≡N, and 37FC≡N IAPP variants, respectively. The fluorescence intensity of the fibril state was corrected for trace amounts of soluble IAPP present, as described in Materials and Methods. The correction is very small and does not alter the conclusions since the ratios are only changed by 3–4% (Supplementary Information). The decrease indicates that the cyano groups are less solvated in the fibrils and/or are in closer proximity to a side chain that quenches their fluorescence. These effects are considered in more detail below in conjunction with the analysis of the Fourier transform infrared spectroscopy (FTIR) data.
Fig. 3.

Fluorescence emission spectra of the FC≡N variants of IAPP collected at the start of the fibrillization reaction (black) and after amyloid formation is complete with any contributions from monomers subtracted out (see Materials and Methods) (red). (a) 15FC≡N, (b) 23FC≡N, (c) 37FC≡N. Fluorescence was excited at 240 nm. Final conditions were 32 μM peptide, 2% HFIP, and 20 mM Tris–HCl at pH 7.4 and 25 °C.
Table 2.
Ratio of final to initial FC≡N fluorescence and the time course and kinetic parameters of amyloid formation of the FC≡N variants as determined from the FC≡N fluorescence assays
| Ratio of final to initial fluorescence | t50 (s) | tlag (s) | vmax (nM/s) | |||
|---|---|---|---|---|---|---|
| 15FC≡N | 0.44±0.01 | 876±10 | 811±20 | 6.73±1.0×10⁻³ | 258±17 | |
| 23FC≡N | 0.30±0.01 | 957±41 | 842±44 | 3.82±0.41×10⁻³ | 168±12 | |
| 37FC≡N | 0.21±0.02 | 997±100 | 909±85 | 3.5±0.19×10⁻³ | 151±15 |
The quoted uncertainties represent the standard deviation calculated from three independent runs.
The fact that each labeled site experiences a significant fluorescence change upon fibril formation means that the FC≡N groups can be used as site-specific reporters. The time courses of thioflavin T fluorescence and FC≡N fluorescence are displayed in Fig. 4 for each variant. The curves are normalized so that the total signal change varies from 0 to 1 in order to allow a direct comparison. There are two striking observations: The first is that the FC≡N and thioflavin T fluorescence curves track each other extremely closely for each sample. The measured t50 and tlag values determined by each method agree to within experimental uncertainty. The second is that the t50 and tlag values are very similar for the different sites (Tables 1 and 2). Note that the FC≡N fluorescence remains high and constant during the lag phase for all peptides and only begins to decline when thioflavin T fluorescence starts to increase. This is an important observation since it shows that the cyano groups do not become desolvated until final fibril formation commences and also indicates that there are no significant changes in the distribution of FC≡N–Tyr distances during the lag phase, or at least no changes that alter FC≡N–Tyr FRET beyond those that occur during the 3-s dead time of the measurements. The constant FC≡N fluorescence signal during the lag phase is not a consequence of the normalization since the data were simply scaled on the y-axis by setting the maximum intensity to 1.0 and the minimum intensity to 0. The non-normalized curves are shown in the Supplementary Information. The results are also not an artifact caused by having thioflavin T present during the FC≡N fluorescence measurements since similar FC≡N time courses were observed in the presence and absence of thioflavin T. The measured t50 and tlag values determined by thioflavin T and FC≡N fluorescence are listed in Tables 1 and 2, respectively.
Fig. 4.

The kinetics of amyloid formation of the FC≡N variants of IAPP as monitored by FC≡N fluorescence (red) and thioflavin T fluorescence (black). (a) 15FC≡N, (b) 23FC≡N, (c) 37FC≡N. FC≡N fluorescence was excited at 240 nm and thioflavin T fluorescence was excited at 450 nm. Final conditions were 32 μM peptide, 2% HFIP, and 20 mM Tris–HCl at pH 7.4 and 25 °C.
The side chains of residues 15, 23, and 37 are buried at the same rate during fibril growth
The apparent maximum rate during the growth phase, which is equal to the rate at t=t50, can be easily calculated by numerically differentiating the kinetic progress curves to obtain , where F(t) is the fluorescence signal as a function of time. The rate reflects the addition of soluble peptide to growing fibrils, either by binding to fibril ends or via secondary nucleation. The values for the three FC≡N curves are similar, varying by less than a factor of 2 (Table 2), and the values determined from the thioflavin T curves (Table 1) are in good agreement with the values deduced from the FC≡N data. The absolute velocity at t=t50, vmax, can be calculated using a simple analytical relationship and the known concentration of IAPP (Materials and Methods). The values calculated for the three FC≡N curves are similar and vary by approximately 40%. The values determined from the thioflavin T data (Table 1) are also in good agreement with each other and with the absolute velocities calculated from the FC≡N data (Table 2).
Seeding studies using wild-type IAPP were performed to investigate the burial of the FC≡N group as fibril formation occurs. Seeding reactions involve taking a small amount of preformed fibrils and adding them to the start of a fresh kinetic reaction. The preformed fibrils act as a “seed” and nucleate fibril formation, bypassing the lag phase typically seen during amyloid formation. The times to reach 50% completion of the seeded reaction, denoted here as , were found to be 76, 90, and 96 s for the 15FC≡N, 23FC≡N, and 37FC≡N IAPP variants, respectively (Fig. 5), based on the FC≡N fluorescence. These are modest differences and are even less when normalized by the respective t50 for the non-seeded reaction. As noted previously, the F15FC≡N substitution leads to a small, but reproducible, decrease in the t50 for a non-seeded reaction. The modest perturbation induced by the FC≡N replacement at position 15 can be accounted for by normalizing each value of the seeded t50 by the respective non-seeded t50, . The ratios (Table 1) vary by less than 10%, reinforcing the conclusions derived from the calculation of the rates at t50.
Fig. 5.

Seeding of FC≡N variants of IAPP by wild-type IAPP. Black curves, thioflavin T fluorescence. Red curves, FC≡N fluorescence. (a) 15FC≡N, (b) 23FC≡N, (c) 37FC≡N. Experiments were performed by adding the various FC≡N variants of IAPP to preformed seeds of wild-type human IAPP. Final conditions were 32 μM peptide, 3.2 μM seed (in monomer units), 2.2% HFIP, and 20 mM Tris–HCl at pH 7.4 and 25 °C.
Fluorescence quenching studies confirm that the side chains of residues 15, 23, and 37 remain exposed during the lag phase
Chloride is an efficient quencher of FC≡N fluorescence and was used to probe the exposure of the FC≡N group throughout the time course of fibril formation by conducting kinetic experiments in the presence of increasing concentrations of Cl−, 20–120 mM.23 Stern–Volmer plots were constructed to quantitatively measure exposure of the FC≡NC≡N groups in IAPP relative to a control peptide. As a control, a five-residue peptide (GGFC≡NAA) was used to determine the Stern–Volmer constant (KSV) for a fully exposed (solvated) FC≡N residue. Significant changes in the ratio of the fluorescence measured in the absence (F0) and presence (F) of quencher were detected over the range of 20 to 120 mM Cl−. The value of KSV for the pentapeptide was found to be 9.3 M−1.
The rate of amyloid formation by IAPP is strongly dependent upon ionic strength and the t50 value was found to decrease from 960 s for wild type at 20 mM ionic strength (20 mM Tris–HCl) to 406 s for 120 mM ionic strength (20 mM Tris–HCl, 100 mM NaCl). The t50 value continues to decrease at higher ionic strengths. IAPP is a cationic peptide and the salt effect is likely due to the screening of unfavorable charge–charge interactions.51 Thus, the Cl− quenching experiments were conducted using NaF to maintain constant ionic strength at 120 mM. Fluoride has no impact on FC≡N fluorescence. We tested for ion-specific effects and found no differences in the kinetics of fibril formation caused by the substitution of F− for Cl−. Thus, NaF is a good salt for maintaining constant ionic strength. KSV values of 4.1±0.6, 3.9±0.5, and 3.9±0.1 M−1 were measured for the 15FC≡N, 23FC≡N, and 37FC≡N IAPP peptides, respectively, early in the lag phase (60 s) (Fig. 6 and Table 3; Supplementary Information). These values are less than 50% of the value observed for the control peptide, suggesting that partial sequestration of the FC≡N groups from the quencher occurs within the dead time of the experiment or that the polypeptide samples conformations in its monomeric state, which leads to partial protection or that neighboring residues provide more protection of the cyano group from quenchers in IAPP than in the control peptide.
Fig. 6.

Stern–Volmer analysis of chloride-induced quenching of FC≡N fluorescence. Data collected early in the lag phase (60 s) is plotted in black, data collected near the end of the lag phase (200 s) is plotted in blue, and data collected after completion of fibril formation (1000 s) is plotted in red. (a) 15FC≡N, (b) 23FC≡N, (c)37FC≡N. Samples contained various concentrations of Cl− and constant ionic strength was maintained by addition of F−. Final conditions were 32 μM peptide, 2% HFIP, 20 mM Tris–HCl, and 100 mM salt (NaCl and NaF) at pH 7.4 and 25 °C. All samples contained at least 20 mM Cl− and the fluorescence in 100 mM NaF and 20 mM Tris–HCl is defined as F0.
Table 3.
Stern–Volmer constants, IR peak positions, and bandwidths for the FC≡N variants of IAPP and the GGFC≡NAA control peptide
| Stern –Volmer constants (KSV) (M−1) |
IR peak position (cm−1) | Bandwidth (cm−1) | |||
|---|---|---|---|---|---|
| t=60 s | t=200 s | t=1000 s | |||
| 15FC≡N | 4.1±0.6 | 3.9±0.5 | 2.0±0.2 | 2233 | 14 |
| 23FC≡N | 3.9±0.5 | 3.7±0.5 | 1.3±0.2 | 2229 | 14 |
| 37FC≡N | 3.9±0.1 | 3.7±0.3 | 1.5±0.03 | 2230 | 14 |
| GGFC≡NAA a | 9.3 | — | — | 2236 | 11 |
The control peptide does not aggregate and its KSV value is independent of time.
The KSV values remain constant throughout the lag phase (Fig. 6 and Table 3). Near the end of the lag phase (200 s), the KSV values are 4.0±0.4 M−1 for the F15FC≡N variant and 3.7±0.3 M−1 for both the F23FC≡N and the Y37FC≡N variants. These values are within experimental uncertainty of each other and are within experimental uncertainty of the values at 60 s. Statistically significant differences were observed, however, when fibril formation was complete. KSV values of 2.0±0.2, 1.3±0.2, and 1.5±0.03 M−1 were measured for the 15FC≡N, 23FC≡N, and 37FC≡N IAPP peptides, respectively, at 1000 s (Fig. 6 and Table 3). The experiments show that all three sites are equally exposed, within the precision of the quenching studies, during the initial stages of fibril assembly, but differences are observed in the final state, with residue 15 exhibiting a larger KSV as compared to position 23 or 37. This is in good agreement with the fluorescence intensities. Linear Stern–Volmer plots are observed for all three variants at all three times, consistent with the FC≡N residues sampling relatively homogenous environments, in terms of their exposure to quencher.
IR measurements probe the environment of the cyano groups in the fibril state
As noted previously, the cyano group is an environmentally sensitive IR probe and this provides an independent means to test the conclusions derived from the fluorescence measurements.29 The expected frequency of an FC≡N group in water is 2237 cm−1, while in a non-polar solvent, it is red shifted to 2228 cm−1.30 The IR frequency of all three IAPP FC≡N variants in the fibril state differs from that of the GGFC≡NAA control peptide and all are red shifted, indicating that the FC≡N groups are less exposed to water. Interestingly, clear differences are observed for the three peptides (Fig. 7 and Table 3). The IR frequency of the cyano labels at position 23 and 37 is within 1 cm−1 of each other (2229 and 2230 cm−1, respectively), while the band for 15FC≡N is the least red shifted (2233 cm−1) and closer to the control peptide (2236 cm−1). This is consistent with a higher solvent exposure and in excellent agreement with the observed FC≡N fluorescence intensities and with the quenching studies.
Fig. 7.
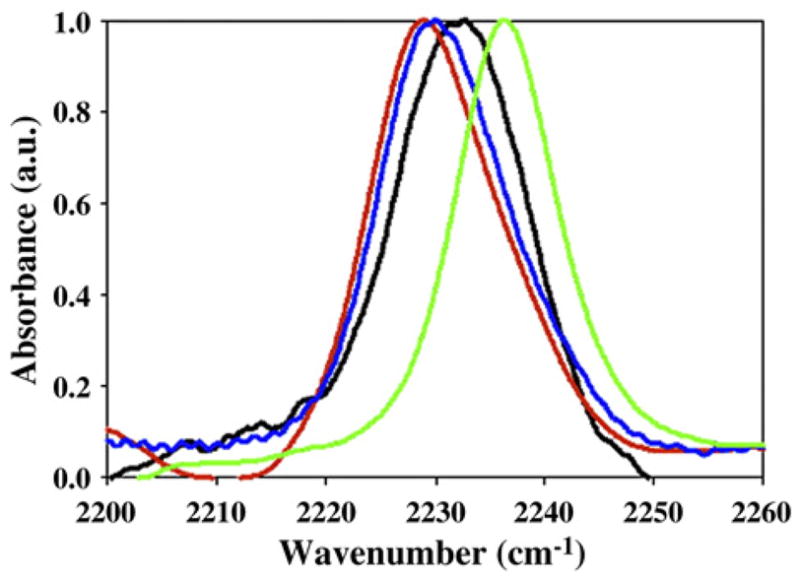
FTIR spectra of the FC≡N variants of IAPP. Black, 15FC≡N; red, 23FC≡N; blue, 37FC≡N; green, GGFC≡NAA control peptide. Final conditions were 2.5 mM peptide, 2% HFIP, and 20 mM Tris–HCl at pH 7.4.
Discussion
We have shown that the FC≡N IAPP derivatives are non-perturbing probes of amyloid formation by IAPP and have demonstrated that they allow amyloid formation to be followed by fluorescence emission, fluorescence quenching, and IR. The data are remarkably self-consistent with the final fluorescence intensity, the Stern–Volmer analyses, and the IR measurements, indicating that the FC≡N group at position 15 is more exposed in the fibril. Tycko et al. have used solid-state NMR to develop two models of the amyloid fibril. F15 is the only aromatic residue of the three aromatic groups that resides in the β-sheet core, while F23 is located in a bend and Y37 appears partially exposed at the C-terminus.52 Interestingly, one of the models developed from the solid-state NMR constraints places F15 in a relatively solvent-exposed position while the second model has it buried. Our data are consistent with the model that places F15 in the more exposed position. An alternative possibility is that the cyano group at position 15 is forming hydrogen bonds with another residue, since this will lead to increased fluorescence. Both of the solid-state models place the side chains of residues F23 and F37 in relatively exposed positions that, at first glance, may appear to be inconsistent with the fluorescence and IR data. However, it is very important to remember that the details of fibril structure are sensitive to conditions and the material for the solid-state NMR studies was prepared using a lengthy procedure to produce a single polymorph. These conditions were necessary to achieve a homogenous sample but are not compatible with real-time kinetic experiments and differ from the ones required here. Thus, it should not be surprising that slight differences are observed between the present study and the NMR structures. Irrespective of any apparent minor ambiguities in fibril structure, we believe that the most interesting results are derived from the time-resolved studies.
To the best of our knowledge, this work represents the first study that monitors the side-chain exposure of specific residues during amyloid formation by IAPP in real time. Our time-resolved fluorescence intensity measurements and Stern–Volmer analyses indicate that the FC≡N groups are exposed throughout the entire lag phase but are less exposed than expected for a fully solvated FC≡N group. These results indicate that significant sequestering of the aromatic side chains does not occur until β-structure sufficient to bind thioflavin T has developed. The seeding studies and analysis of the maximum rates further confirm that sequestering of the FC≡N groups occurs concomitantly with the development of thioflavin T binding capability. Overall, the ordering of the side chains during amyloid formation and growth appears to be remarkably homogenous for the conditions used here (2% HFIP, pH 7.4, and constant stirring). Any models of lag-phase intermediates need to take this into account.
Helical intermediates have been proposed to play a role in the early stages of amyloid formation by IAPP, and Eisenberg et al. have proposed a model involving a partially helical dimer in which inter-helical contacts occur in the region near F15.11,48,53 Our data indicate that whatever the nature of the intermediate, it does not involve tight specific contacts that bury the aromatic side chain and remove them completely from water.
Weak FRET can be detected between Phe and Tyr, and this effect was exploited in early studies of IAPP fibril formation.46 A 48% FRET efficiency was observed during the lag phase and was interpreted to indicate compaction of the chain during the lag phase, although the results are difficult to interpret in terms of specific pairwise distances since FRET could occur from either or both of the two Phe residues.46 Recent NMR-based diffusion measurements, as well as independent triplet quenching studies of a Y37W mutant, albeit performed under different conditions, also provide evidence that human IAPP samples compact conformations prior to amyloid formation.54,55 As noted above, FC≡N fluorescence is quenched by FRET to Tyr and this provides an independent means of assessing compaction. The Förster distance (R0) for a FC≡N–Tyr pair is on the order of 12–13 Å. F15–Y37 distances ranged from 22 to 26 Å in the solid-state NMR model in which F15 is solvent exposed and from 23 to 24 Å in the model in which F15 is buried. The F23–Y37 distances were measured to be from 6 to 13 Å in the model in which F15 is solvent exposed and from 7 to 12 Å in the model in which F15 is buried. Thus, one would expect a significant increase in FRET involving FC≡N at position 23 and a corresponding decrease in fluorescence intensity if the polypeptide went from an extended conformation to a compact conformation, which approximated the fibril structure during the lag phase. The present data clearly indicate that this does not occur under the conditions of our experiments or if it does, it does so very rapidly in the initial stages of the lag phase that correspond to the dead time of our studies, since we detect no significant changes in FC≡N intensity during the lag phase. These observations place significant constraints on the conformation of lag-phase intermediates.
The use of FC≡N is not limited to IAPP and can be applied to other systems. For example, both Aβ and α-synuclein contain multiple Phe and Tyr residues, four in Aβ and six in α-synuclein, but lack Trp. FC≡N analogs should also be useful for probing the interaction of amyloidogenic proteins with inhibitors and with membranes. Lifetime measurements also offer the possibility of obtaining more detailed information about local dynamics.
Materials and Methods
Peptide synthesis and purification
The FC≡N IAPP variants, wild-type IAPP, and a short control peptide (GGFC≡NAA) were synthesized on a 0.25-mmol scale with an Applied Biosystems 433A Peptide Synthesizer, utilizing 9-fluornylmethoxycarbonyl (Fmoc) chemistry. Solvents used were ACS-grade. Fmoc-protected pseudoproline (oxazolidine) dipeptide derivatives were used as previously described.56 Fmoc amino acids and pseudoproline dipeptide derivatives were purchased from Novabiochem. Fmoc-L-4-cyanophenylalanine was purchased from Peptech Corporation. All other reagents were purchased from Advanced Chemtech, PE Biosystems, Sigma, and Fisher Scientific. Use of a 5-(4′-Fmoc-aminomehtyl-3′,5-dimethoxyphenol) valeric acid (PAL-polyethylene glycol) resin afforded an amidated C-terminus. The N-termini of all peptides were free. Standard Fmoc reaction cycles were used. The first residue attached to the resin, all β-branched residues, the residue directly following a β-branched residue, all Pseudoproline dipeptide derivatives, and the residue directly following a pseudoproline dipeptide derivative were double-coupled. Peptides were cleaved from the resin through the use of standard trifluoroacetic acid (TFA) methods. The disulfide bond was formed via dimethyl-sulfoxide-induced oxidation.57 The peptides were purified via reverse-phase high-performance liquid chromatography using a Vydac C18 preparative column. A two-buffer system was utilized in which Buffer A consisted of H2O and 0.045% HCl (v/v) and Buffer B consisted of 80% acetonitrile, 20% H2O, and 0.045% HCl (v/v). HCl was used as the ion-pairing agent since TFA causes problems with IR of polypeptides and residual TFA can influence the aggregation properties of amyloidogenic peptides.58 The identity of the pure polypeptide was confirmed by matrix-assisted laser desorption/ionization time-of-flight mass spectrometry. The expected mass for both IAPP 15FC≡N and 23FC≡N was 3929.3 Da, and masses of 3928.6 and 3929.8 Da were observed, respectively. The expected mass of 37FC≡N was 3912.3 Da and the observed mass was 3911.8 Da. The purity of the polypeptides was checked by HPLC using a Vydac C18 analytical column.
Fluorescence assays
All fluorescence assays were performed on a Photon Technology International fluorescence spectrophotometer. Thioflavin T fluorescence was excited at 450 nm and monitored at 485 nm. FC≡N fluorescence was excited at 240 nm and the emission was monitored at 296 nm. The emission and excitation slits were set to 5 nm and a 1.0-cm cuvette was used for all experiments. The fluorescence of thioflavin T and FC≡N was measured simultaneously for the same sample in dual-dye mode during kinetic runs, which allows kinetic traces to be collected in an interleaved fashion. The kinetic experiments were performed by diluting a stock solution of peptide, 1.58 mM in HFIP, into 20 mM Tris–HCl buffer at pH 7.4 containing thioflavin T. This is a standard protocol for biophysical studies of IAPP amyloid formation.20,46,51 The final solution conditions were 2% HFIP, 32 μM peptide, and 32 μM thioflavin T at pH 7.4 and 25 °C for all experiments. The HFIP stock solutions were filtered with a 0.45-μm GHP Acrodisc filter prior to dilution into buffer. All solutions were stirred during the experiments to maintain solution homogeneity. Stirring significantly accelerates the rate of amyloid formation. The fluorescence spectra of the final fibril state shown in Fig. 3 were corrected for contributions from trace amounts of soluble IAPP. Fluorescence emission spectra were collected and the samples were then filtered through a 10,000-Da molecular mass ultrafiltration device by sedimentation at 22,000g for 45 min. The supernatant contained only soluble IAPP as judged by the fact that the intensity of the thioflavin T fluorescence was the same as observed at the start of the kinetic assay (data not shown). The FC≡N fluorescence spectra of these solutions were collected and subtracted from that of the unfiltered sample. The difference spectra represent the contribution from the fibril.
The apparent maximum rate, the rate at t=t50, was calculated by numerically differentiating the FC≡N and thioflavin T fluorescence versus time curves. The maximum velocity, vmax, was calculated using the procedure described in Ref. 57. Briefly, the data were fit to the expression r(t)=(m1 + t + r1)α +(m2 + t + r2)(1 − α), where α= (1+e((t50−t)/τ))−1, which describes a sigmoidal curve. The time constant of the transition, τ, is converted to vmax by the equation , where [IAPP]t = 0 is the total concentration of IAPP at the start of the reaction.
For the seeding assays, preformed wild-type hIAPP fibrils were produced by diluting a 1.58-mM stock solution of peptide in HFIP into 20 mM Tris–HCl buffer containing thioflavin T at pH 7.4 for a final concentration of 32 μM wild-type hIAPP in 2% HFIP. The solution was incubated for 60 min and thioflavin T fluorescence was monitored to ensure fibril formation had occurred. Fibrils from this reaction were diluted into buffer. The IAPP FC≡N variants, 1.58 mM stock solutions in HFIP, were then diluted into the seeded buffer for final conditions of 32 μM peptide, 32 μM thioflavin T, 3.2 μM seed (in monomer units), and 2.2% HFIP at pH 7.4. Data were recorded with constant stirring at 25 °C.
The Stern–Volmer analyses were performed by following the time course of fibril formation via FC≡N fluorescence in buffers that contained increasing chloride concentrations ranging from 20 to 120 mM Cl− at 20-mM intervals. Fluoride was used to keep the ionic strength constant at a total ionic strength (NaCl, NaF, and Tris HCl) of 120 mM in each assay. Fluoride has no affect on FC≡N fluorescence. Final conditions were 32 μM peptide, 32 M thioflavin T, 100 mM salt, and 20 mM Tris HCl at pH 7.4 and 25 °C with constant stirring. F0 is defined as the fluorescence in 20 mM Tris–HCl and 100 mM NaF. Stern–Volmer plots were generated for each peptide at the 60-s time point, which is during the lag phase, at 200 s, which is near the end of the lag phase, and at 1000 s, which corresponds to fibril formation as judged by FC≡N and thioflavin T fluorescence.
Transmission electron microscopy
TEM was performed at the University Microscopy Imaging Center at the State University of New York at Stony Brook. Fifteen-microliter samples from the end of the kinetic experiments were placed on a carbon-coated 300-mesh copper grid and negatively stained with saturated uranyl acetate.
FTIR measurements
FTIR spectra were measured on a Thermo Scientific Nicolet IS 10 FTIR spectrometer with a resolution of 1 cm−1. All measurements were done using a CaF2 sample cell with a path length of 75 μm. The spectra were averaged for 500 scans for both the sample and the background. Final conditions were 2.5 mM peptide as determined by weight in 20 mM Tris–HCl at pH 7.4 and 2% HFIP.
Supplementary Material
Acknowledgments
This work was supported by National Institutes of Health grants GM078114 (D.P.R.) and DK79895 (M.T.Z.). P.M. was supported in part by a GAANN fellowship from the Department of Education.
Abbreviations used
- FC≡N
p-cyanophenylalanine
- FRET
Förster resonance energy transfer
- FTIR
Fourier transform infrared spectroscopy
- IAPP
islet amyloid polypeptide
- TEM
transmission electron microscopy
- TFA
trifluoroacetic acid
Footnotes
Supplementary data associated with this article can be found, in the online version, at doi:10.1016/j.jmb.2010.05.041
References
- 1.Glenner GG. Amyloid deposits and amyloidosis; the β-fibrilloses. N Engl J Med. 1980;302:1283–1292. doi: 10.1056/NEJM198006053022305. [DOI] [PubMed] [Google Scholar]
- 2.Sipe JD, Cohen AS. Amyloidosis. Crit Rev Clin Lab Sci. 1994;31:325–354. doi: 10.3109/10408369409084679. [DOI] [PubMed] [Google Scholar]
- 3.Selkoe DJ. Cell biology of protein misfolding: the examples of Alzheimer’s and Parkinson’s diseases. Nat Cell Biol. 2004;6:1054–1061. doi: 10.1038/ncb1104-1054. [DOI] [PubMed] [Google Scholar]
- 4.Chiti F, Dobson CM. Protein misfolding, functional amyloid and human disease. Annu Rev Biochem. 2006;75:333–366. doi: 10.1146/annurev.biochem.75.101304.123901. [DOI] [PubMed] [Google Scholar]
- 5.Dobson CM. Protein misfolding, evolution and disease. Trends Biochem Sci. 1999;24:329–332. doi: 10.1016/s0968-0004(99)01445-0. [DOI] [PubMed] [Google Scholar]
- 6.Nilsberth C, Westlind-Danielsson A, Eckman CB, Condron MM, Axelman K, Forsell C, et al. The ‘Arctic’ APP mutation (E693G) causes Alzheimer’s disease by enhanced A-beta protofibril formation. Nat Neurosci. 2001;4:887–893. doi: 10.1038/nn0901-887. [DOI] [PubMed] [Google Scholar]
- 7.Marina KD, Bitan G, Teplow DB. Paradigm shifts in Alzheimer’s disease and other neurodegenerative disorders: the emerging role of oligomeric assemblies. Neurosci Res. 2002;69:567–577. doi: 10.1002/jnr.10328. [DOI] [PubMed] [Google Scholar]
- 8.Caughey C, Lansbury PT. Protofibrils, pores, fibrils, and neurodegeneration: separating the responsible protein aggregates from the innocent bystanders. Annu Rev Neurosci. 2003;26:267–298. doi: 10.1146/annurev.neuro.26.010302.081142. [DOI] [PubMed] [Google Scholar]
- 9.Petkova AT, Leapman RD, Guo Z, Yau WM, Mattson MP, Tycko R. Self-propagating, molecular-level polymorphism in Alzheimer’s β-amyloid fibrils. Science. 2005;307:262–265. doi: 10.1126/science.1105850. [DOI] [PubMed] [Google Scholar]
- 10.Nilsson MR, Driscoll MD, Raleigh DP. Low levels of asparagine deamidation have a dramatic effect on aggregation: implications for the study of amyloid formation. Protein Sci. 2002;11:342–349. doi: 10.1110/ps.48702. [DOI] [PMC free article] [PubMed] [Google Scholar]
- 11.Abedini A, Raleigh D. A critical assessment of the role of helical intermediates in amyloid formation by natively unfolded proteins and polypeptides. Protein Eng Des Sel. 2009;22:453–459. doi: 10.1093/protein/gzp036. [DOI] [PMC free article] [PubMed] [Google Scholar]
- 12.Chang ESH, Liao TY, Lim TS, Fann W, Chen RPY. A new amyloid-like β-aggregate with amyloid characteristics, except fibril morphology. J Mol Biol. 2009;385:1257–1265. doi: 10.1016/j.jmb.2008.11.009. [DOI] [PubMed] [Google Scholar]
- 13.Shim SH, Gupta R, Ling YL, Strasfeld DB, Raleigh DP, Zanni MT. Two-dimensional IR spectroscopy and isotope labeling defines the pathway of amyloid formation with residue-specific resolution. Proc Natl Acad Sci USA. 2009;106:6614–6619. doi: 10.1073/pnas.0805957106. [DOI] [PMC free article] [PubMed] [Google Scholar]
- 14.Krebs MRH, Bromley EHC, Donald AM. The binding of thioflavin-T to amyloid fibrils: localisation and implications. J Struct Biol. 2005;149:30–37. doi: 10.1016/j.jsb.2004.08.002. [DOI] [PubMed] [Google Scholar]
- 15.Levine H. Quantification of beta-sheet amyloid fibril structures with thioflavin T. Methods Enzymol. 1999;309:274–284. doi: 10.1016/s0076-6879(99)09020-5. [DOI] [PubMed] [Google Scholar]
- 16.Biancalana M, Makabe K, Koide A, Koide S. Molecular mechanism of thioflavin-T binding to the surface of β-rich-peptide self-assemblies. J Mol Biol. 2009;385:1052–1063. doi: 10.1016/j.jmb.2008.11.006. [DOI] [PMC free article] [PubMed] [Google Scholar]
- 17.Groenning M, Olsen L, van de Weert M, Flink JM, Frokjaer S, Jørgensen FS. Study on the binding of thioflavin-T to β-sheet-rich and non-β-sheet cavities. J Struct Biol. 2007;158:358–369. doi: 10.1016/j.jsb.2006.12.010. [DOI] [PubMed] [Google Scholar]
- 18.Meng F, Marek P, Potter K, Verchere B, Raleigh DP. Rifampicin does not prevent amyloid fibril formation by human islet amyloid polypeptide but does inhibit fibril thioflavin-T interactions: implications for mechanistic studies of β-cell death. Biochemistry. 2008;47:6016–6024. doi: 10.1021/bi702518m. [DOI] [PubMed] [Google Scholar]
- 19.Tomiyama T, Kaneko H, Kataoka K-i, Asano S, Endo N. Rifampicin inhibits the toxicity of pre-aggregated amyloid peptides by binding to peptide fibrils and preventing amyloid–cell interaction. Biochem J. 1997;322:859–865. doi: 10.1042/bj3220859. [DOI] [PMC free article] [PubMed] [Google Scholar]
- 20.Marek P, Gupta R, Raleigh D. The fluorescent amino acid p-cyanophenylalanine provides an intrinsic probe of amyloid formation. ChemBioChem. 2008;9:1372–1374. doi: 10.1002/cbic.200800052. [DOI] [PubMed] [Google Scholar]
- 21.Aprilakis KN, Taskent H, Raleigh DP. Use of the novel fluorescent amino acid p-cyanophenylalanine offers a direct probe of hydrophobic core formation during the folding of the N-terminal domain of the ribosomal protein L9 and provides evidence for two-state folding. Biochemistry. 2007;46:12308–12313. doi: 10.1021/bi7010674. [DOI] [PubMed] [Google Scholar]
- 22.Schultz KC, Supekova L, Ryu Y, Xie J, Perera R, Schultz PG. A genetically encoded infrared probe. J Am Chem Soc. 2006;128:13984–13985. doi: 10.1021/ja0636690. [DOI] [PubMed] [Google Scholar]
- 23.Tucker MJ, Oyola R, Gai F. A novel fluorescent probe for protein binding and folding studies: p-cyanophenylalanine. Bioploymers. 2006;83:571–576. doi: 10.1002/bip.20587. [DOI] [PubMed] [Google Scholar]
- 24.Serrano AL, Troxler T, Tucker MJ, Gai F. Photophysics of a fluorescent non-natural amino acid: p-cyanophenylalanine. Chem Phys Lett. 2010;487:303–306. doi: 10.1016/j.cplett.2010.01.058. [DOI] [PMC free article] [PubMed] [Google Scholar]
- 25.Tang J, Signarvic RS, DeGrado WF, Gai F. Role of helix nucleation in the kinetics of binding of mastoparan X to phospholipid bilayer. Biochemistry. 2007;46:13856–13863. doi: 10.1021/bi7018404. [DOI] [PubMed] [Google Scholar]
- 26.Tucker MJ, Tang J, Gai F. Probing the kinetics of membrane-mediated helix folding. J Phys Chem B. 2006;110:8105–8109. doi: 10.1021/jp060900n. [DOI] [PubMed] [Google Scholar]
- 27.Rogers JM, Lippert LG, Gai F. Non-natural amino acid fluorophores for one- and two-step fluorescence resonance energy transfer applications. Anal Biochem. 2010;399:182–189. doi: 10.1016/j.ab.2009.12.027. [DOI] [PMC free article] [PubMed] [Google Scholar]
- 28.Tucker MJ, Oyola R, Gai F. Conformational distribution of a 14-residue peptide in solution: a fluorescence resonance energy transfer study. J Phys Chem B. 2005;109:4788–4795. doi: 10.1021/jp044347q. [DOI] [PubMed] [Google Scholar]
- 29.Taskent-Sezgin H, Chung J, Patsalo V, Miyake-Stoner SJ, Miller AM, Brewer SH, et al. Interpretation of p-cyanophenylalanine fluorescence in proteins in terms of solvent exposure and contribution of side-chain quenchers: a combined fluorescence, IR and molecular dynamics study. Biochemistry. 2009;48:9040–9046. doi: 10.1021/bi900938z. [DOI] [PubMed] [Google Scholar]
- 30.Getahun Z, Huang CY, Wang T, Leon BD, DeGrado WF, Gai F. Using nitrile-derivatized amino acids as infrared probes of local environment. J Am Chem Soc. 2003;125:405–411. doi: 10.1021/ja0285262. [DOI] [PubMed] [Google Scholar]
- 31.Tucker MJ, Getahun Z, Nanda V, DeGrado WF, Gai F. A new method for determining the local environment and orientation of individual side chains of membrane-binding peptides. J Am Chem Soc. 2004;126:5078–5079. doi: 10.1021/ja032015d. [DOI] [PubMed] [Google Scholar]
- 32.Suydam IT, Boxer SG. Vibrational stark effects calibrate the sensitivity of vibrational probes for electric fields in proteins. Biochemistry. 2003;42:12050–12055. doi: 10.1021/bi0352926. [DOI] [PubMed] [Google Scholar]
- 33.Dalosto SD, Vanderkooi JM, Sharp KA. Vibrational stark effects on carbonyl, nitrile, and nitrosyl compounds including heme ligands, CO, CN, and NO, studied with density functional theory. J Phys Chem B. 2004;108:6450–6457. doi: 10.1021/jp0310697. [DOI] [PubMed] [Google Scholar]
- 34.Cooper G, Willis AC, Clark A, Turner RC, Sim RB, Reid KBM. Purification and characterization of a peptide from amyloid-rich pancreases of type 2 diabetic patients. Proc Natl Acad Sci USA. 1987;84:8628–8632. doi: 10.1073/pnas.84.23.8628. [DOI] [PMC free article] [PubMed] [Google Scholar]
- 35.Westermark P, Wernstedt C, Wilander E, Hayden DW, O’Brien TD, Johnson KH. Amyloid fibrils in human insulinoma and islets of Langerhans of the diabetic cat are derived from a neuropeptide-like protein also present in normal islet cells. Proc Natl Acad Sci USA. 1987;84:3881–3885. doi: 10.1073/pnas.84.11.3881. [DOI] [PMC free article] [PubMed] [Google Scholar]
- 36.Kahn SE, D’Alessio DA, Schwartz MW, Fujimoto WY, Ensinck JW, Taborsky GJ, Porte D. Evidence of cosecretion of islet amyloid polypeptide and insulin by beta-cells. Diabetes. 1990;39:634–638. doi: 10.2337/diab.39.5.634. [DOI] [PubMed] [Google Scholar]
- 37.Kahn SE, Andrikopoulos S, Verchere CB. Islet amyloid: a long-recognized but underappreciated pathological feature of type 2 diabetes. Diabetes. 1999;48:241–253. doi: 10.2337/diabetes.48.2.241. [DOI] [PubMed] [Google Scholar]
- 38.de Koning EJ, Bodkin NL, Hansen BC, Clark A. Diabetes mellitus in Macaca mulatta monkeys is characterised by islet amyloidosis and reduction in beta-cell population. Diabetologia. 1993;36:378–384. doi: 10.1007/BF00402271. [DOI] [PubMed] [Google Scholar]
- 39.Butler AE, Janson J, Bonner-Weir S, Ritzel R, Rizza RA, Butler PC. Beta-cell deficit and increased beta-cell apoptosis in humans with type 2 diabetes. Diabetes. 2003;52:102–110. doi: 10.2337/diabetes.52.1.102. [DOI] [PubMed] [Google Scholar]
- 40.Konarkowska B, Aitken JF, Kistler J, Zhang S, Cooper GJ. The aggregation potential of human amylin determines its cytotoxicity towards islet beta-cells. FEBS J. 2006;273:3614–3624. doi: 10.1111/j.1742-4658.2006.05367.x. [DOI] [PubMed] [Google Scholar]
- 41.Guardado-Mendoza R, Davalli AM, Chavez AO, Hubbard GB, Dick EJ, Majluf-Cruz A, et al. Pancreatic islet amyloidosis, beta-cell apoptosis, and alpha-cell proliferation are determinants of islet remodeling in type-2 diabetic baboons. Proc Natl Acad Sci USA. 2009;106:13992–13997. doi: 10.1073/pnas.0906471106. [DOI] [PMC free article] [PubMed] [Google Scholar]
- 42.Udayasankar J, Kodama K, Hull RL, Zraika S, Aston-Mourney K, Subramanian SL, et al. Amyloid formation results in recurrence of hyperglycaemia following transplantation of human IAPP transgenic mouse islets. Diabetologia. 2009;52:143–153. doi: 10.1007/s00125-008-1185-7. [DOI] [PMC free article] [PubMed] [Google Scholar]
- 43.Westermark GT, Westermark P, Berne C, Korsgren O. Widespread amyloid deposition in transplanted human pancreatic islets. N Engl J Med. 2008;359:977–979. doi: 10.1056/NEJMc0802893. [DOI] [PubMed] [Google Scholar]
- 44.Westermark P, Eizirik DL, Pipeleers DG, Hellerström C, Andersson A. Rapid deposition of amyloid in human islets transplanted into nude mice. Diabetologia. 1995;38:543–549. doi: 10.1007/BF00400722. [DOI] [PubMed] [Google Scholar]
- 45.Potter K, Abedini A, Marek P, Butterworth S, Driscoll M, Baker R, et al. Islet amyloid deposition limits the viability of human islet grafts but not porcine islet grafts. Proc Natl Acad Sci. 2010;107:4305–4310. doi: 10.1073/pnas.0909024107. [DOI] [PMC free article] [PubMed] [Google Scholar]
- 46.Padrick SB, Miranker AD. Islet amyloid polypeptide: identification of long-range contacts and local order on the fibrillogenesis pathway. J Mol Biol. 2001;308:783–794. doi: 10.1006/jmbi.2001.4608. [DOI] [PubMed] [Google Scholar]
- 47.Goldsbury C, Goldie K, Pellaud J, Seelig J, Frey P, Muller SA, et al. Amyloid fibril formation from full-length and fragments of amylin. J Struct Biol. 2000;130:352–362. doi: 10.1006/jsbi.2000.4268. [DOI] [PubMed] [Google Scholar]
- 48.Wiltzius JJW, Sievers SA, Sawaya MR, Eisenberg D. Atomic structures of IAPP (amylin) fusions suggest a mechanism for fibrillation and the role of insulin in the process. Protein Sci. 2009;18:1521–1530. doi: 10.1002/pro.145. [DOI] [PMC free article] [PubMed] [Google Scholar]
- 49.Marek P, Abedini A, Song B, Kanungo M, Johnson ME, Gupta R, et al. Aromatic interactions are not required for amyloid fibril formation by islet amyloid polypeptide but do influence the rate of fibril formation and fibril morphology. Biochemistry. 2007;46:3255–3261. doi: 10.1021/bi0621967. [DOI] [PubMed] [Google Scholar]
- 50.Koo BW, Hebda JA, Miranker AD. Amide inequivalence in the fibrillar assembly of islet amyloid polypeptide. Protein Eng Des Sel. 2008;21:147–154. doi: 10.1093/protein/gzm076. [DOI] [PubMed] [Google Scholar]
- 51.Abedini A, Raleigh D. The role of His-18 in amyloid formation by human islet amyloid polypeptide. Biochemistry. 2005;44:16284–16291. doi: 10.1021/bi051432v. [DOI] [PubMed] [Google Scholar]
- 52.Luca S, Yau WM, Leapman R, Tycko R. Peptide conformation and supramolecular organization in amylin fibrils: constraints from solid-state NMR. Biochemistry. 2007;48:13505–13522. doi: 10.1021/bi701427q. [DOI] [PMC free article] [PubMed] [Google Scholar]
- 53.Williamson JA, Loria JP, Miranker AD. Helix stabilization precedes aqueous and bilayer-catalyzed fiber formation in islet amyloid polypeptide. J Mol Biol. 2009;393:386–396. doi: 10.1016/j.jmb.2009.07.077. [DOI] [PMC free article] [PubMed] [Google Scholar]
- 54.Soong R, Brender JR, Macdonald PM, Ramamoorthy A. Association of highly compact type II diabetes related islet amyloid polypeptide intermediate species at physiological temperature revealed by diffusion NMR spectroscopy. J Am Chem Soc. 2009;131:7079–7085. doi: 10.1021/ja900285z. [DOI] [PubMed] [Google Scholar]
- 55.Vaiana SM, Best RB, Yau WM, Eaton WA, Hofrichter J. Evidence for a partially structured state of the amylin monomer. Biophys J. 2009;97:2948–2957. doi: 10.1016/j.bpj.2009.08.041. [DOI] [PMC free article] [PubMed] [Google Scholar]
- 56.Abedini A, Raleigh DP. Incorporation of pseudoproline derivatives allows the facile synthesis of human IAPP: a highly amyloidogenic and aggregation-prone polypeptide. Org Lett. 2005;7:693–696. doi: 10.1021/ol047480+. [DOI] [PubMed] [Google Scholar]
- 57.Abedini A, Singh G, Raleigh DP. Recovery and purification of highly aggregation-prone disulfide-containing peptides: application to islet amyloid polypeptide. Anal Biochem. 2005;351:181–186. doi: 10.1016/j.ab.2005.11.029. [DOI] [PubMed] [Google Scholar]
- 58.Nilsson M, Raleigh DP. Analysis of amylin cleavage products provides new insights into the amyloidogenic region of human amylin. J Mol Biol. 1999;294:1375–1385. doi: 10.1006/jmbi.1999.3286. [DOI] [PubMed] [Google Scholar]
Associated Data
This section collects any data citations, data availability statements, or supplementary materials included in this article.