

Abstract
Even though it is among the most commonly methylated loci in multiple cancers the retinoic acid induced tumor suppressor RARRES1 has no known function. We now show that RARRES1 is lost in many cancer cells, particularly those with a mesenchymal phenotype, and is a transmembrane carboxypeptidase inhibitor that interacts with AGBL2, a cytoplasmic carboxypeptidase. Knockdown of AGBL2 results in a failure of the cell to detyrosinate the C-terminal EEY region of α-tubulin and indicates that, it is a candidate for the long sought after tubulin tyrosine carboxypeptidase important in regulation of microtubule dynamics. In contrast knockdown of RARRES1 increases the level of detyrosinated α-tubulin consistent with a role as the cognate inhibitor of AGBL2. We conclude that RARRES1, its interacting partners AGBL2, Eg5/KIF11, another EEY bearing protein (EB1), and the microtubule tyrosination cycle are important in tumorigenesis and identify a novel area for therapeutic intervention.
Keywords: TIG1, RARRES1, tubulin, tyrosination, AGBL2, CCP2
Introduction
Retinoic acid receptor responder 1 (RARRES1) also known as tazarotene-induced gene 1 (TIG1), was first identified as a novel retinoid-responsive gene in skin. RARRES1 is induced in a retinoic acid receptor-specific manner in a variety of human skin-related systems (1). The RARRES1 promoter region is methylated in primary prostate cancers compared to normal tissues or benign hyperplasias and decreased expression is associated with an increase in the malignant potential of prostate carcinoma cells (2). RARRES1 is among the most commonly methylated loci in multiple cancers and is often described as a putative tumor suppressor gene (3). In addition RARRES1 also plays a role in the proliferative/ differentiative switch in adult adipose-derived mesenchymal stem cells. Notably, a RARRES1 family member, latexin (LXN) has been implicated in controlling aspects of stem cell biology where an inverse and direct relationship between latexin expression and the size of the haematopoietic stem cell population in mice has been reported (4). Latexin was initially described as the only known mammalian carboxypeptidase inhibitor and is involved in the regional specification of neurons (5–8). Despite extensive evidence for a tumor suppressor role of RARRES1, no mechanism for its biological function has been determined.
Here we show that RARRES1 is a type III membrane protein found in a complex with several proteins involved in the regulation of microtubule function and reveal that AGBL2 (carboxypeptidase) and RARRES1 (inhibitor) regulate the tubulin tyrosination cycle. Our findings point to a role for RARRES1, AGBL2 and the tubulin tyrosination cycle in cancer, and identify a novel avenue for potential therapeutic intervention.
Materials and Methods
Cells
Immortalized human prostate epithelial PWR-1E cells (a gift from Dr. S.C. Chauhan, University of South Dakota), PC-3 human prostate cancer cells, SKBR-3 human breast cancer cells and HEK293 human embryonic kidney cells were maintained according to ATCC’s recommendation.
Antibodies and reagents
Primary antibodies targeting the following antigens were used: goat anti-human RARRES1 (Cat# AF4255, R&D Systems, Minneapolis, MN), anti-tyrosinated tubulin and anti-Eg5 (Abcam, Cambridge, MA), anti-E-cadherin (BD-Transduction Laboratories, San Jose, CA), anti-Cyclin D1 (EMD-Calbiochem, Gibbstown, NJ), anti-HA (Millipore, Temecula, CA), anti-histone-H4 (Cell Signaling, Danvers, MA), anti-detyrosinated tubulin (AbD Serotec, Oxford, England), and anti-AGBL2, and anti-pan-cadherin (Sigma-Aldrich, St. Louis, MO). The following RNAis (Dharmacon, Lafayette, CO) were used: for RARRES1 knockdown, GUACACGGCUCAUCGAGAA and AAAGAGGGAUGUAAAGUUC. For AGBL2 knock-down: GCACACUUCUACCCAUAUA and UGGACAAGAUGUAGAUUUA.
siRNA, expression constructs and transfection
Variant and full-length human RARRES1 isoforms were directionally cloned into the BglII and HindIII sites in the pEYFP-N1 vector (Clontech). N-RARRES1 (+121 - +897) and full-length RARRES1 (+1 - +897) were cloned into the pGlue vector as codon optimized versions by Genscript (Piscataway, NJ). AGBL2 (cat#M-012937-00) and non-targeting control siRNAs (cat#D-001210-01-20) were from Dharmacon (Lafayette, CO). Plasmid DNA and siRNA constructs were either introduced to cells by electroporation mediated by an Amaxa nucleoporator (Amaxa-Lonza, Gaithersburg, MD), or by Fugene 6 transfection reagent (Roche, Indianapolis, IN).
Detection of AGBL family members by qPCR
Total RNA was extracted from indicated cell lines with Trizol reagent (Invitrogen) and isolated with an RNeasy purification kit (Qiagen). Single-stranded cDNA was prepared from 400 ng of RNA by TaqMan reverse transcription reagents (Applied Biosystems) following the manufacturer’s guidelines. Real-time PCR was then performed and monitored on a 7900 HT system (Applied Biosystems) using TaqMan universal PCR master mix and the following inventoried primer/probe sets: GAPDH–Hs99999905_m1, AGBL1/Nna1–Hs00328701_m1, AGBL2–Hs00417079_m1, AGBL3–Hs00227489_m1, AGBL4–Hs00262179_m1, and AGBL5–Hs00222447_m1 (Applied Biosystems). Plotted ΔCt values were determined by subtracting control (GAPDH) cycle threshold values from each target cycle threshold. Where targets did not return a threshold value after 40 cycles of PCR, the transcript was determined to be absent.
RARRES1 RT-PCR
RARRES1 (full-length) forward 5’-CAACAAGAGGATTACCTGCTTTACAAG-3’ and reverse 5’-GAGCAGAGTTCAGTGTGCATG-3’ primers (generating a 630 base pair amplicon). For β-actin; forward 5’-CCACTGGCATCGTGATGGAC-3’ and reverse 5’-GCGGATGTCCACGTCACACT-3’ primers (generating a 350 base-pair amplicon). Thermal cycling for RARRES1 was done according to the following profile: 30 minutes at 50°C, 15 minutes at 95°C for RT reaction followed by PCR cycling of, 30 seconds at 94°C, 45 seconds at 52°C, one minute at 72°C, for indicated number of cycles with a subsequent final elongation at 72°C for 10 minutes.
PNGaseF digestion
Whole cell lysates of untreated PWR-1E cells were made using RIPA buffer followed by digestion with the glycosidase PNGase F, or no enzyme (NEB, Ipswich, MA) according to the manufacturer’s instructions.
Cell fractionation
Three-pool (membrane, cytoplasmic and nuclear/cell debris fractions) cell fractionation was carried out as previously described (9).
Cell Lysis and Tandem Affinity Purification (TAP)
A stable clone expressing a level of exogenous pGlue RARRES1close to the endogenous level of this protein was grown in 5 dishes (150 mm each). At 90% confluency, medium was discarded and each dish was lysed in 0.5 mL of a lysis buffer composed of 10% glycerol, 50 mM Hepes-NaOH pH 8.0, 100 mM NaCl, 2 mM EDTA, 0.1% NP-40, 2 mM DTT, 10 mM NaF, 5 nM calyculin A, 50 mM β-glycerolphosphate, and 1 × Complete MiniTM protease inhibitor (Roche, Indianapolis, IN). Lysates were harvested by scraping and two freeze-thaw cycles were performed to improve protein recovery. Lysates were then centrifuged at 15,000 × g for 15 minutes, supernatant were recovered and incubated for 4 hours with 100 μL of streptavidin beads (Streptavidin SepharoseTM High Performance, GE Healthcare) pre-washed 3 times with the lysis buffer. The slurry was then centrifuged at 1,500 × g for 2 minutes and the precipitate containing the streptavidin beads was recovered and washed 3 times with lysis buffer and 2 times with the TEV buffer supplied with the AcTEVTM Protease kit (Cat no. 12575-015, Invitrogen, Carlsbad, CA). Streptavidin beads were then incubated with 200 units of TEV protease in 150μL of TEV buffer overnight at 4°C. The slurry was then centrifuged at 1,500 × g for 2 minutes and the supernatant was recovered. The precipitated beads were washed twice with 200 μL of TEV buffer, centrifuged, and supernatants were pooled. The final pool volume was diluted 1:1 (v/v) wih calmodulin-binding buffer composed of 10 mM β-mercaptoethanol, 10 mM Hepes-NaOH pH8.0, 150 mM NaCl, 1 mM MgOAc, 1 mM imidazole, 0.1% NP-40, and 2mM CaCl2. The mixture was then incubated for 90 minutes at 4°C with 100 μL of Calmodulin beads (Calmodulin SepharoseTM 4B, GE Healthcare) pre-washed 3 times with Calmodulin-binding buffer. The slurry was then centrifuged at 1,500 × g for 2 minutes, the supernatant was discarded and the precipitated beads were washed twice with a Calmodulin- rinsing buffer composed of 50 mM Ammonium Bicarbonate pH 8.0, 75 mM NaCl, 1 mM MgOAc, 1 mM imidazole, and 2 mM CaCl2. Each wash was followed by centrifugation and supernatant shedding. 150 μL of a calmodulin-elution buffer composed of 50 mM Ammonium bicarbonate pH 8.0 and 25 mM EGTA was then added to the calmodulin resin. The slurry was then vortex mixed, centrifuged at 1,500 × g, and the supernatant was collected. This elution step was repeated twice and supernatants were pooled together (Figure S1).
Trypsin Digestion and Tandem Mass Spectrometry Analysis (LC-MS/MS)
The pull-down sample was vacuum-dried and reconstituted with 20 μL of a buffer composed of 500 mM triethylammonium bicarbonate pH 8.5. The protein sample was then denatured by adding 1 μL of a 2% SDS solution followed by the addition of 2 μL of a reducing reagent composed of 50 mM TRIS-(2-carboxyethyl)phosphine (TCEP). The mixture was then incubated at 60°C for 1 hour followed by the addition of 1 μL of a cysteine blocking reagent composed of 200 mM methyl methane-thiosulfonate (MMTS) in isopropanol. Trypsin digestion was then performed by adding 10 μL of 1 μg/μL trypsin solution in 80 mM CaCl2. Samples were incubated overnight at 37°C then vacuum dried and reconstituted with 10 μL of a 2% acetonitrile and 0.1% formic acid in distilled deionized water as described previously (10). NanoLC/MS/MS was performed using a Q-Star Elite (Applied Biosystems, Foster City, CA) equipped with a nanoAcquity UPLC system (Waters, Milford, MA). Sample separations were performed using a 1.7 μm nanoAcquity BEH130 C18 (100 μm × 100 mm) at a flow rate of 400 nL/min. Tryptic digests were eluted using the following gradient: 100% of Solvent A (97.9% water, 2%Acetonitrile, 0.1% Formic acid (v/v/v)) for 1 hour; then from 100% solvent A to 100% solvent B (2% water, 97.8%Acetonitrile, 0.1% Formic acid (v/v/v)) in 2 hours; A 100% solvent B flow was maintained for 1 hour followed by a return to 100% of solvent A flow in 15 min. Mass spectrometer settings were as follows: Ion spray voltage 2300 V, interface heater temperature 220 °C, cone voltage 20 V, and collision energy 8 V.
Protein Identification
Protein identification was performed using ProteinPilotTM software with the following settings (11): Sample type: Identification; Cysteine alkylation: MMTS; Digestion: Trypsin; Instrument: QSTAR ESI; Species: Homo sapiens; Min S/N Filter: 10; Precursor tolerance 75 ppm; Maximum missed cleavage: 1; and MS/MS fragment tolerance of 0.3 Da.
Western Blotting
Western blotting was performed as described previously (12;13). Cells were lysed with RIPA buffer, loaded onto 4–12% gradient polyacrylamide gel. Amounts of proteins loaded were: 1 μg of total cell lysates for tubulin immunoblots and 10μg for all other immunoblots. Gels were electrophoresed at 100V until the end of the separation. Proteins contained within the gel were then electroblotted onto a nitrocellulose membrane (50 V for 50 min). Western blot analyses were accomplished utilizing a 1 μg/mL dilution of primary antibody followed by incubation with a horseradish peroxidase-conjugated secondary antibody against the appropriate species. Visualization of the bands was then accomplished by the addition of a 1 to 1 ratio of Super Signal West Pico-Stable Peroxidase Solution and Luminol/Enhancer Solution (Pierce, Rockford, IL) and by developing the chemiluminescent signal in the dark using Kodak Scientific Imaging Film (Kodak cat. 1651496), Fixer and Replenisher/Developer and Replenisher (Kodak cat. 1901859) according to the manufacturer’s instructions.
Immunoprecipitation
Hek 293 Cells were lysed using RIPA buffer and centrifuged at 14,000 × g for 15 min. The supernatant was recovered and pre-cleared by adding 1μg of normal IgG premixed with 20 μL of A/G protein bead slurry. The mixture was incubated for 30 minutes at 4 °C and then centrifuged at 1,000 × g for 5 min. The supernatant was recovered and mixed with 10 μL of primary antibody and incubated for 1 hour at 4 °C. 20 μL of A/G bead slurry was then added and incubated at 4 °C for 1 hour. Samples were then centrifuged and supernatants were discarded. The precipitate was boiled for 3 minutes after adding 20 μL of SDS-PAGE sample buffer to release the complex from the beads. Western blotting was then performed as described above.
Homology modeling
AGBL2 structure was predicted using human carboxypeptidase A1 (CPA1) (PDB: 1V77) as a template. The sequence identity of AGBL2 and CPA1 is 27%. The missing loops were built using the ‘loop model’ building option in the Modeller9v7. The model was refined further by molecular dynamics simulations followed by energy minimization using SANDER module of AMBER 10.0. The quality of the refined model was checked with PROCHECK. Docking of the ‘EEY’ peptide motif was carried out with the SurFlexDock. Molecular Dynamics (MD) simulations and energy minimization were performed using the AMBER10.0 package.
Immunofluorescence
To assess the levels of detyrosinated tubulin in control versus AGBL2, RARRES1 knocked-down, and/or paclitaxel treated Hek293 cells, 50,000 cells were plated on cover slides (Fisher brand, microscope Cover Glass, #12-545-100 18CIR-1). After 24 hrs, cells were treated with paclitaxel or DMSO at a final concentration of 5 μM for 2 hours. HEK293 cells were then fixed in 3.7% paraformaldehyde/PBS for 10 minutes at room temperature followed by washing the cells 3 times with PBS. Post-permeabilization was performed by adding PBST (PBS/Tween 20) and incubating the cells for 5 mins at room temperature. Cells were then washed 3 times with PBS followed by the addition of the primary antibody that consisted of a rabbit polyclonal anti-detyrosinated tubulin (ABD Serotec, Oxford, England) with a final dilution of 1:250. Cells were then washed 3 times with PBS before adding the secondary antibody that consisted of an Alexa 488-conjugated anti-Rabbit IgG diluted 1:300 (Invitrogen, Carlsbad, CA). DAPI was also added at a 1:50 dilution for nuclei detection. Cells were washed 3 times with PBS and Images were obtained using a 60X oil lens on the Olympus FV 300 Confocal microscope. Consistent laser intensity or camera exposure levels for each fluorescent marker in each experiment were used. For image analysis and quantification, measurements were made using Metamorph Image analysis software ver. 7.0. Average intensity was calculated from integrated intensity and area for each selected area. Quantitation of fluorescence signals from five random fields for each treatment was performed. An example of an original image used for quantitation is included in the supplementary materials (Figure S2).
RESULTS
RARRES1 organization
RARRES1 is related to the putative carboxypeptidase inhibitor latexin and both genes are adjacent to one another on chromosome three suggesting that they arose as a result of gene duplication (14) (Figure 1a). Similar molecules exist in all vertebrates examined; in zebrafish and several other, more ancient vertebrates, only one orthologue exists, and this is more closely related to RARRES1 than to latexin (Figure 1b). These data indicate that RARRES1 is the ancestral gene and may, in zebrafish at least, fulfill the function of both latexin and RARRES1. We found that RARRES1 exists as two mRNA spliceoforms; a low abundance variant and an abundant form which encodes for an additional 66 amino acids at the C-terminus (Figure 1c-e).
Figure 1.

RARRES-1 in cancer (a) Ideogram of human chromosome 3 where RARRES1 and the paralogue LXN are adjacent at position 3q25. (b) A phylogenetic tree of selected RARRES1 and LXN orthologues suggesting RARRES1 is the ancestral gene. (c) Schematic representation of the mRNA for the six-exon RARRES1 isoform and five-exon variant isoform (open regions are coding where shaded regions are untranslated). (d) The putative variant protein contains an alteration in the amino acid sequence (underlined) which results in subsequent truncation. (e) RARRES1 and its variant are induced by RA or vitamin D3 in PWR-1E cells but not in PC-3 or other more aggressive prostate cancer cells.
RARRES1 mRNA is decreased in prostate cancer and further in metastatic prostate cancer compared with normal prostate tissue and is induced after neo-adjuvant therapy (2). RT-PCR analysis demonstrates that RARRES1 is expressed in normal prostate and breast cell-lines and more differentiated breast cancer cell-lines and is very low in aggressive prostate and breast cancer cells with a mesenchymal phenotype (Figure 2a, Table S1). HEK293 cells express low but still detectable levels of RARRES1. In PWRE-1E cells RARRES1 is further induced by retinoic acid and by vitamin D.
Figure 2.

RARRES1 and AGBL2 expression and interaction (a) RARRES1 is induced by RA (10−7 M), after 30-cycle RT-PCR, in SKBR-3 breast cancer cells and PWR-1E cells but not in PC-3 prostate cancer cells. (R = Retinoic Acid; E = Ethanol); (b) Immunoblot of RARRES1 in PC-3 (negative) and PWR-1E cells expressing endogenous (~38KDa), HA-ΔN-RARRES1 (~45KDa) and HA-RARRES1 (~50KDa, degradation product at ~35 KDa). Immunoblot of RARRES1 in PWR-1E cells expressing variant-RARRES1-EYFP (~57KDa) and RARRES1-EYFP (~64KDa). Subcellular fractionation of PWR-1E cells indicates membrane associated (38 KDa) and nuclear (50 KDa) pools of endogenous RARRES1. Endoglycosidase (PNGase F) digestion of PWR-1E whole cell lysates. (c) Immunoblot showing the presence of RARRES1, AGBL2, Eg5 and EB1 present in the RARRES1-pGlue complex after tandem affinity purification, RARRES1 endogenous immunoprecipitation, and AGBL2 endogenous immunoprecipitation. Immunoblot of HA–contained in the pGlue vector- depicts the presence RARRES1-pGlue (45kDa) in the sample versus the empty vector (11kDa) in the control. (d) 1/ΔCt values for AGBL family members (ΔCt represents the relative abundance of the different AGBL genes to the reference RNAse P; 1/ΔCt was used to draw the graph because the ΔCt parameter is inversely proportional to the gene level; *denotes an absent or undetectable cycle threshold for target transcript).
Identification of the RARRES1 interactome
We utilized a tandem affinity purification LC/MS/MS approach to characterize the RARRES1 interactome in HEK293 cells. NanoLC-Q-TOF/TOF mass spectrometry and a ProteinPilotTM software search revealed 9 proteins (including RARRES1) identified with a confidence interval > 95% (Table 1). Proteins that were also present in a complex isolated from cells stably expressing the empty vector control were removed from the analyses. Several proteins in the RARRES1 complex regulate microtubule function. These are: the mitotic spindle associated kinesin eg5/KIF11, an emerging target for cancer therapy; EB1, a microtubule plus end binding protein that is regulated by RARRES1 (15); a novel human cytosolic carboxypeptidase member of the ABGL/CCP family (AGBL2), and α-tubulin. The presence of AGBL2, Eg5 and EB1 in the exogenously and endogenously expressed RARRES1 complex was confirmed using western blot after TAP, RARRES1 immunoprecipitation and reverse AGBL2 immunoprecipitation (Figure 2c). Two other interactors, ANKRD26-like family member 1A and Crk-like protein kinase are likely involved in regulation of the membrane-associated actin cytoskeleton (16).
Table 1. RARRES1 interactome.
List of proteins identified at >95% confidence as being present in the RARRES1-TAP produced complex. Proteins that were also present in a complex isolated from cells stably expressing the empty vector control were removed from this list.
| Confidence | % Coverage | Accession Number | Protein |
|---|---|---|---|
| 100 | 30.8 | sp|Q71U36|TBA1A_HUMAN | Tubulin alpha-1A chain OS=Homo sapiens GN=TUBA1A PE=1 SV=1 |
| 100 | 48.5 | sp|P46109|CRKL_HUMAN | Crk-like protein OS=Homo sapiens GN=CRKL PE=1 SV=1 |
| 100 | 40.5 | gi|166898073 | ANKRD26-like family C member 1A (Prostate, ovary, testis-expressed protein on chromosome 2) (POTE-2) |
| 100 | 27.6 | sp|Q15691|MARE1_HUMAN | Microtubule-associated protein RP/EB Family member 1 OS=Homo sapiens GN=MAPRE1 PE=1 SV=3 |
| 100 | 46.7 | sp|P10599|THIO_HUMAN | Thioredoxin OS=Homo sapiens GN=TXN PE=1 SV=3 |
| 100 | 40.4 | sp|Q05639|EF1A2_HUMAN | Elongation factor 1 -alpha 2 OS=Homo sapiens GN=EEF1A2 PE=1 SV=1 |
| 100 | 18.9 | sp|P52732|KIF11_HUMAN | Kinesin-like protein KIF11 OS=Homo sapiens GN=KIF11 PE=1 SV=2 |
| 98 | 45.9 | sp|Q5U5Z8|CBPC2_HUMAN | Cytosolic carboxypeptidase 2 GN=AGBL2 PE=2 SV=1 |
| 97 | 20.4 | sp|P49788|TIG1_HUMAN | Retinoic acid receptor responder protein 1 OS=Homo sapiens GN=RARRES1 PE=2 SV=2 |
RARRES1 is a type III membrane protein
An affinity purified polyclonal antibody raised to residues 43-294 of human RARRES1 protein recognizes a ~38 KDa protein from PWR-1E whole cell lysate which is present at much reduced levels in PC-3 cells, consistent with mRNA data. The antibody recognizes TAP-tagged RARRES1 and ΔN-RARRES1 as well as RARRES1-EYFP at their respective predicted molecular masses but does not detect the variant isoform of RARRES1-EYFP. Cell-fractionation analysis reveals that the ~38KDa RARRES1 is membrane bound; a second, higher molecular weight pool (~50 KDa) is present in the nuclear/cell debris pool indicating a form which is highly modified and/or insoluble in non-ionic detergents (Figure 2b). Although RARRES1 has a transmembrane domain its directionality once inserted into the membrane is unclear (www.expasy.ch). We addressed RARRES1 orientation by examining its N-glycosylation status via incubation with PNGaseF glycosidase. Unlike E-cadherin, RARRES1 does not undergo a shift in molecular weight when exposed to PNGase F (Figure 2b) suggesting that, even though it possesses several putative sites for glycosylation, it is not N-glycosylated and that the C-terminal likely faces the cytoplasm not lumen of the membrane compartment (a type III transmembrane protein). This is consistent with its association with several cytoplasmic proteins (Table 1).
Regulation of α-tubulin tyrosination
Other than its presence in Genbank, nothing is known of human AGBL2, though a likely family member, mouse Nna-1, is important in cerebellar degenerative disorders (17). Nna-1 knockout mice have high levels of tyrosinated tubulin in the degenerative cerebellum, and it was suggested that Nna-1 might have the characteristics of a tubulin carboxypeptidase (18). However it is now thought that Nna-1 is involved in the degradation of proteosomally generated peptides (19;20). Although significant levels of AGBL2 and other family members exist in HEK293, PC3 and PWR-1E cells, Nna-1 (AGTPBP) was not detectable by Q-PCR (Figure 2d) and neither it nor the other AGBL family members were found in the RARRES1 complex (Table 1).
To gain some insight into its potential carboxypeptidase activity we predicted AGBL2 structure using human carboxypeptidase A1 (CPA1 PDB: 1V77) as template. Although the overall sequence identity is only 27% (active site 21%) the predicted tertiary structure of AGBL2 is remarkably similar to CPA1 (Figure 3a). Importantly the residues predicted to interact with the zinc co-ordination atom and the folding in this catalytic site is almost identical. Although the structure of the catalytic site is very similar the substrate binding cavity of AGBL2 is lengthy and narrow, whereas it is bulky and wide for CPA1 (Figure 3b, c). These structural predictions strongly indicate that AGBL2 is likely to have carboxypeptidase activity. Importantly, extensive molecular simulations indicate that the putative C-terminal α-tubulin peptide EEY substrate can be docked precisely into the predicted AGBL2 binding pocket (Figure 3d).
Figure 3. AGBL2 predicted tertiary structure.

(a) Homology model structure of AGBL2 (ribbon, magenta), and human carboxypeptidase (PDB: 1V77) (ribbon, yellow) with their active site residues shown by ball & stick model. The catalytic zinc is shown in orange. (b) Human carboxypeptidase (PDB: 1V77) (ribbon, yellow) with the shape of the catalytic site represented by spacefill atoms (purple). (c) Homology model structure of AGBL2 (ribbon, magenta) with the shape of the catalytic site represented by spacefill atoms (cyan). (d) Docking of the EEY peptide into the AGBL2 binding pocket.
To further test if AGBL2 has the characteristics of a tubulin carboxypeptidase, we performed western blots using antibodies specific for the tyrosinated and detyrosinated forms of α-tubulin on proteins extracted from HEK 293 control cells and cells in which AGBL2 was knocked down. Several predicted AGBL2 variants and/or possibly degradation fragments are detected in figure 4a. AGBL2 siRNA resulted in marked knockdown of all AGBL2 forms except a presumably non-specific band at ~20 kda (Figure 4a). Exogenous (45 kDa) and endogenous long isoform (38 kDa) detection of RARRES1 (Figure 4b) was performed using a mouse monoclonal antibody (Ab92884, Abcam, Cambridge, MA). Consistent with their role in tubulin detyrosination, AGBL2 knockdown and RARRES1 overexpression reduced the level of detyrosinated tubulin. In contrast, knockdown of RARRES1 and exogenous expression of AGBL2 increased the level of detyrosinated tubulin consistent with RARRES1 inhibition of endogenous AGBL2 activity (Figure 4c-d). Similar results were found following analysis of detyrosinated and tyrosinated tubulin by mass spectrometry (not shown). These findings were further validated using immunofluorescent staining of detyrosinated tubulin (Figure 5a, Figure S3). The relative abundance of detyrosinated tubulin was significantly upregulated after RARRES1 knockdown and expression of exogenous AGBL2; and significantly down-regulated after exogenous expression of RARRES1 or AGBL2 knockdown when compared to the appropriate control (Figure 5b, c). Although knockdown of AGBL2 did not completely abolish detyrosinated tubulin as measured by immunocytochemical quantitation of whole cells, examination of individual micrographs reveals a more significant loss of microtubule-associated detyrosinated tubulin. Diffuse cytoplasmic staining observed under all conditions makes the threshold of this particular assay rather high in HEK293 cells. The association between detyrosinated tubulin and microtubules is shown in figure S3. Interestingly treatment of HEK293 cells with paclitaxol does not result in a major increase in the levels of detyrosinated tubulin as observed previously in HeLa cells (21). This may be a result of the known drug resistant phenotype of HEK293 cells, an embryonically derived cell line. While immunoblots show an increase in detyrosinated tubulin upon transfection of AGBL2, immunofluorescence staining reveals a more significant increase at the single cell level. Taken together these data provide strong evidence that AGBL2 and RARRES1 are α-tubulin tyrosine carboxypeptidase and carboxypeptidase inhibitor respectively.
Figure 4. RARRES1 and AGBL2 regulate α-tubulin tyrosination in HEK 293 cells.

(a) AGBL2 immunoblot depicting the full length protein (104 kDa) and other predicted variants (or degradation fragments) at 72, 64, 38, 33, and 31 kDa. Myc-AGBL2 transfection results in a low amount of full length exogenous protein expression. AGBL2 knock-down results in the disappearance of all AGBL2 variants and fragments. (b) RARRES1 immunoblot depicting exogenous pGlue-RARRES1 (45 kDa) and endogenous RARRES1 (35 kDa) using a mouse monoclonal antibody. (c) Immunoblot for detyrosinated α-tubulin in HEK 293 cells in which RARRES1 or AGBL2 were knocked down or exogenously expressed. Control myc, control pGlue, Myc-AGBL2, and RARRES1-pGlue transfections were done in duplicate. Loading control was performed using a monoclonal anti-α-tubulin antibody.
Figure 5. RARRES1 and AGBL2 regulate the detyrosination cycle of α-tubulin in HEK 293 cells.

(a) Immunofluorescence signal of Alexa 488 probing the detyrosinated α-tubulin (Green) and DAPI probing the nucleus (Blue) in HEK 293 controls, RARRES1 knockdown, AGBL2 knockdown, RARRES 1 overexpression, AGBL2 overexpression with and without taxol treatment. The color balance and the contrast of all the images combined were optimized using Photoshop cs3 to allow for visualization of both DAPI and detyrosinated tubulin staining on an 8-bit resolution monitor. An example of the original image used for quantitation is included in the supplementary materials (Figure S1); (b) Average signal intensities of detyrosinated α-tubulin in HEK 293 cells following knockdown or exogenous expression of RARRES1 with and without taxol treatment; (c) Average signal intensities of detyrosinated α-tubulin in HEK 293 cells following knockdown or exogenous expression of AGBL2 with and without taxol treatment.
DISCUSSION
Previous studies indicated a role for RARRES1 in some aspect of cellular proliferation and tumorigenicity (3). However, these groups utilized the variant version of RARRES1 in their studies (the only form identified at the time), and we have demonstrated that the variant mRNA species is present in very small quantities and can not verify that this transcript is translated into a functional protein. Consequently it is likely that the major function of RARRES1 is carried out by the full-length isoform.
The RARRES1 paralogue latexin, was initially described as a carboxypeptidase inhibitor in the rodent brain and regulates haematopoietic stem cell numbers and lifespan in mice (4;22). RARRES1 also regulates proliferation and differentiation in adipose-derived mesenchymal stem cells and proliferation and motility in HK1 cells suggesting a role for this family of genes in the differentiation of stem cells from several different tissues (23). Recombinant latexin can inhibit the activity of the lysosomal carboxypeptidase A (CPA) family members in vitro, and can be co-crystallized with them; however, structural analyses and localization patterns of latexin clearly suggest that it is a cytoplasmic protein and thus, it is not likely to interact with members of the lysosomal CPA family (24). As RARRES1 is a type-III transmembrane protein the cytoplasmic localization of its putative carboxypeptidase inhibitor domain would preclude it too from interacting with the lysosomal CPAs. This suggests that its cognate carboxypeptidase(s) are likely active within the cytoplasm. Although little is known about cytoplasmic carboxypeptidases or their substrates, removal of the C-terminal tyrosine of α-tubulin by an unknown carboxypeptidase (the tyrosination cycle) is important in several aspects of microtubule function including kinesin interactions, spindle dynamics, mitosis and neuronal specification (25). Microtubules containing large amounts of detyrosinated α-tubulin are more stable, and resistant to depolymerization by nocodazole and other destabilizing agents (26). Detyrosinated α-tubulin is elevated in aggressive breast and prostate cancers which are often resistant to microtubule-targeted chemointerventions (27). Elevated levels of detyrosinated α-tubulin, and Δ2-tubulin, a highly stable version generated from the precursor detyrosinated form, predominate in normal brain tissue, but are also associated with tumors in other tissues, further suggesting a role for the tubulin tyrosination cycle in tumorigenesis (28). Recently, a role for detyrosinated tubulin in epithelial to mesenchymal transitions (EMT) important in development, stem cell differentiation and tumor invasion has been proposed (29). Remarkably, although the tubulin tyrosination cycle has been known to occur for decades the identity and regulation of tubulin carboxypeptidase has remained a mystery (30;31). Our demonstration that AGBL2 is a RARRES1 interacting protein that regulates the tubulin tyrosination cycle implicates both molecules in the regulation of this evolutionarily ancient process and identifies it as a novel target for intervention (Figure 6).
Figure 6. Model for RARRES1/AGBL2 function.
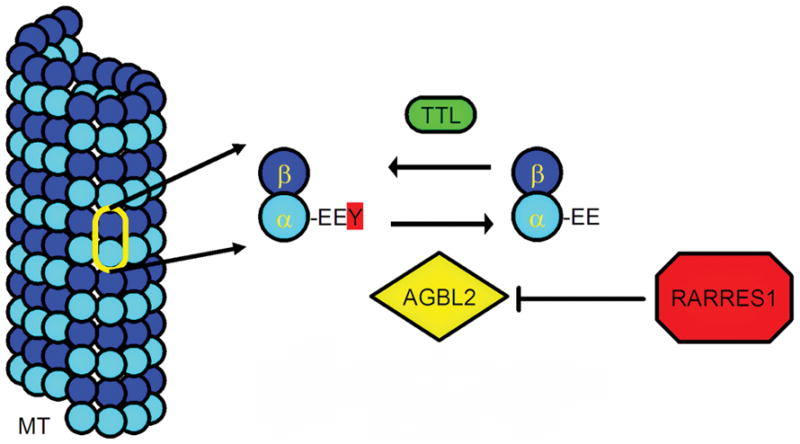
The C-terminal EEY motif of α-tubulin is detyrosinated by AGBL2. Tyrosination, in the case of soluble α-tubulin, is mediated by TTL. RARRES1 blocks AGBL2 activity, presumably through direct inhibition, increasing the proportion of tyrosinated tubulin and altering the accessibility of MT’s to certain kinesins. (AGBL2-ATP/GTP binding protein-like 2; MT-microtubule; RARRES1-retinoic acid receptor responder 1; TTL-tubulin tyrosine ligase).
Supplementary Material
Acknowledgments
The authors wish to acknowledge the support the following Lombardi Cancer Center Core Facilities (NIH P30 CA51008): microscopy, tissue culture, proteomics, genomics and epigenomics
Financial Support: This study was funded by NIH R01CA129813, NIH 1 P01 CA130821, R01 DK58196 (SWB), and NIH U56 LCCC/UDC Partnership (DK and SWB). ). Y.J. was partly supported by an NIGMS T32 grant.
Reference List
- 1.Nagpal S, Patel S, Asano AT, Johnson AT, Duvic M, Chandraratna RA. Tazarotene-induced gene 1 (TIG1), a novel retinoic acid receptor-responsive gene in skin. J Invest Dermatol. 1996;106(2):269–274. doi: 10.1111/1523-1747.ep12340668. [DOI] [PubMed] [Google Scholar]
- 2.Youssef EM, Chen XQ, Higuchi E, Kondo Y, Garcia-Manero G, Lotan R, et al. Hypermethylation and silencing of the putative tumor suppressor Tazarotene-induced gene 1 in human cancers. Cancer Res. 2004;64(7):2411–2417. doi: 10.1158/0008-5472.can-03-0164. [DOI] [PubMed] [Google Scholar]
- 3.Jing C, El Ghany MA, Beesley C, Foster CS, Rudland PS, Smith P, et al. Tazarotene-induced gene 1 (TIG1) expression in prostate carcinomas and its relationship to tumorigenicity. J Natl Cancer Inst. 2002;94(7):482–490. doi: 10.1093/jnci/94.7.482. [DOI] [PubMed] [Google Scholar]
- 4.Liang Y, Jansen M, Aronow B, Geiger H, Van Zant G. The quantitative trait gene latexin influences the size of the hematopoietic stem cell population in mice. Nat Genet. 2007;39(2):178–188. doi: 10.1038/ng1938. [DOI] [PubMed] [Google Scholar]
- 5.Arimatsu Y. Latexin: a molecular marker for regional specification in the neocortex. Neurosci Res. 1994;20(2):131–135. doi: 10.1016/0168-0102(94)90030-2. [DOI] [PubMed] [Google Scholar]
- 6.Hatanaka Y, Uratani Y, Takiguchi-Hayashi K, Omori A, Sato K, Miyamoto M, et al. Intracortical regionality represented by specific transcription for a novel protein, latexin. Eur J Neurosci. 1994;6(6):973–982. doi: 10.1111/j.1460-9568.1994.tb00592.x. [DOI] [PubMed] [Google Scholar]
- 7.Normant E, Gros C, Schwartz JC. Carboxypeptidase A isoforms produced by distinct genes or alternative splicing in brain and other extrapancreatic tissues. J Biol Chem. 1995;270(35):20543–20549. doi: 10.1074/jbc.270.35.20543. [DOI] [PubMed] [Google Scholar]
- 8.Normant E, Martres MP, Schwartz JC, Gros C. Purification, cDNA cloning, functional expression, and characterization of a 26-kDa endogenous mammalian carboxypeptidase inhibitor. Proc Natl Acad Sci U S A. 1995;92(26):12225–12229. doi: 10.1073/pnas.92.26.12225. [DOI] [PMC free article] [PubMed] [Google Scholar]
- 9.Orford K, Crockett C, Jensen JP, Weissman AM, Byers SW. Serine phosphorylation-regulated ubiquitination and degradation of beta-catenin. J Biol Chem. 1997;272(40):24735–24738. doi: 10.1074/jbc.272.40.24735. [DOI] [PubMed] [Google Scholar]
- 10.Sahab ZJ, Man YG, Semaan SM, Newcomer RG, Byers SW, Sang QXA. Alteration in protein expression in estrogen receptor alpha-negative human breast cancer tissues indicates a malignant and metastatic phenotype. Clin & Exp Metastasis. 2010;27(7):493–503. doi: 10.1007/s10585-010-9338-8. [DOI] [PMC free article] [PubMed] [Google Scholar]
- 11.Sahab ZJ, Iczkowski KA, Sang QXA. Anion exchange fractionation of serum proteins versus albumin elimination. Anal Biochem. 2007;368(1):24–32. doi: 10.1016/j.ab.2007.06.004. [DOI] [PubMed] [Google Scholar]
- 12.Sahab ZJ, Suh Y, Sang QXA. Isoelectric point-based prefractionation of proteins from crude biological samples prior to two-dimensional gel electrophoresis. J of proteome res. 2005;4(6):2266–2272. doi: 10.1021/pr0501822. [DOI] [PubMed] [Google Scholar]
- 13.Sahab ZJ, Semaan SM, Sang QXA. Methodology and applications of disease biomarker identification in human serum. Biomarker Insights. 2007;2:21–43. [PMC free article] [PubMed] [Google Scholar]
- 14.Aagaard A, Listwan P, Cowieson N, Huber T, Ravasi T, Wells CA, et al. An inflammatory role for the mammalian carboxypeptidase inhibitor latexin: relationship to cystatins and the tumor suppressor TIG1. Structure. 2005;13(2):309–317. doi: 10.1016/j.str.2004.12.013. [DOI] [PubMed] [Google Scholar]
- 15.Sahab ZJ, Hall MD, Zhang L, Cheema AK, Byers SW. Tumor Suppressor RARRES1 Regulates DLG2, PP2A, VCP, EB1, and Ankrd26. J of Cancer. 2010;1:14–22. doi: 10.7150/jca.1.14. [DOI] [PMC free article] [PubMed] [Google Scholar]
- 16.Hanks SK, Polte TR. Signaling through focal adhesion kinase. Bioessays. 1997;19(2):137–145. doi: 10.1002/bies.950190208. [DOI] [PubMed] [Google Scholar]
- 17.Fernandez-Gonzalez A, La Spada AR, Treadaway J, Higdon JC, Harris BS, Sidman RL, et al. Purkinje cell degeneration (pcd) phenotypes caused by mutations in the axotomy-induced gene, Nna1. Science. 2002;295(5561):1904–1906. doi: 10.1126/science.1068912. [DOI] [PubMed] [Google Scholar]
- 18.Kalinina E, Biswas R, Berezniuk I, Hermoso A, Aviles FX, Fricker LD. A novel subfamily of mouse cytosolic carboxypeptidases. FASEB J. 2007;21(3):836–850. doi: 10.1096/fj.06-7329com. [DOI] [PubMed] [Google Scholar]
- 19.Chakrabarti L, Neal JT, Miles M, Martinez RA, Smith AC, Sopher BL, et al. The Purkinje cell degeneration 5J mutation is a single amino acid insertion that destabilizes Nna1 protein. Mamm Genome. 2006;17(2):103–110. doi: 10.1007/s00335-005-0096-x. [DOI] [PubMed] [Google Scholar]
- 20.Berezniuk I, Sironi J, Callaway MB, Castro LM, Hirata IY, Ferro ES, et al. CCP1/Nna1 functions in protein turnover in mouse brain: Implications for cell death in Purkinje cell degeneration mice. FASEB J. 2010 doi: 10.1096/fj.09-147942. [DOI] [PMC free article] [PubMed] [Google Scholar]
- 21.Fonrose X, Ausseil F, Soleilhac E, Masson V, David B, Pouny I, et al. Parthenolide inhibits tubulin carboxypeptidase activity. Cancer Res. 2007;67(7):3371–3378. doi: 10.1158/0008-5472.CAN-06-3732. [DOI] [PubMed] [Google Scholar]
- 22.Arimatsu Y, Ishida M. Early patterning of the rat cerebral wall for regional organization of a neuronal population expressing latexin. Brain Res Dev Brain Res. 1998;106(1–2):71–78. doi: 10.1016/s0165-3806(97)00197-1. [DOI] [PubMed] [Google Scholar]
- 23.Kwok WK, Pang JC, Lo KW, Ng HK. Role of the RARRES1 gene in nasopharyngeal carcinoma. Cancer Genet Cytogenet. 2009;194(1):58–64. doi: 10.1016/j.cancergencyto.2009.06.005. [DOI] [PubMed] [Google Scholar]
- 24.Takiguchi-Hayashi K, Arimatsu Y. Restricted expression of latexin in dorsal midline cells of developing rat forebrain. Neuroreport. 1995;6(2):281–283. doi: 10.1097/00001756-199501000-00014. [DOI] [PubMed] [Google Scholar]
- 25.Konishi Y, Setou M. Tubulin tyrosination navigates the kinesin-1 motor domain to axons. Nat Neurosci. 2009;12(5):559–567. doi: 10.1038/nn.2314. [DOI] [PubMed] [Google Scholar]
- 26.Khawaja S, Gundersen GG, Bulinski JC. Enhanced stability of microtubules enriched in detyrosinated tubulin is not a direct function of detyrosination level. J Cell Biol. 1988;106(1):141–149. doi: 10.1083/jcb.106.1.141. [DOI] [PMC free article] [PubMed] [Google Scholar]
- 27.Mialhe A, Lafanechere L, Treilleux I, Peloux N, Dumontet C, Bremond A, et al. Tubulin detyrosination is a frequent occurrence in breast cancers of poor prognosis. Cancer Res. 2001;61(13):5024–5027. [PubMed] [Google Scholar]
- 28.Lafanechere L, Job D. The third tubulin pool. Neurochem Res. 2000;25(1):11–18. doi: 10.1023/a:1007575012904. [DOI] [PubMed] [Google Scholar]
- 29.Whipple RA, Matrone RA, Cho EH, Balzer EM, Vitolo ME, Yoon JR, et al. Epithelial-to-Mesenchymal Transition Promotes Tubulin Detyrosination and Microtentacles that Enhance Endothelial Engagement. Cancer Res. 2010;70(20):8127–8137. doi: 10.1158/0008-5472.CAN-09-4613. [DOI] [PMC free article] [PubMed] [Google Scholar]
- 30.Argarana CE, Barra HS, Caraway H. Release of [C-14]Tyrosine from Tubulinyl-[C-14]Tyrosine by Brain Extract - Separation of a Carboxypeptidase from Tubulin-Tyrosine Ligase. Mol and Cellular Biochem. 1978;19(1):17–21. doi: 10.1007/BF00231230. [DOI] [PubMed] [Google Scholar]
- 31.Barra HS, Arce CA, Argarana CE. Posttranslational tyrosination/detyrosination of tubulin. Mol Neurobiol. 1988;2(2):133–153. doi: 10.1007/BF02935343. [DOI] [PubMed] [Google Scholar]
Associated Data
This section collects any data citations, data availability statements, or supplementary materials included in this article.