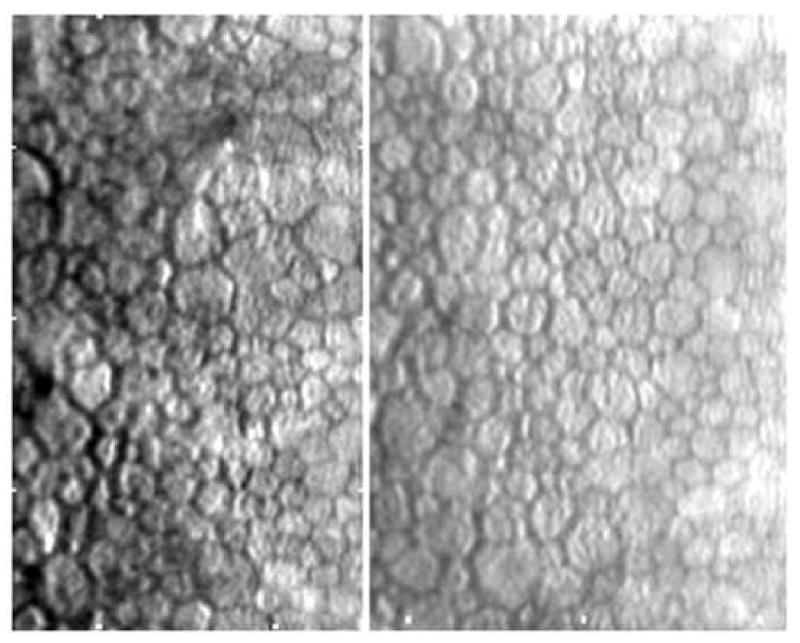
Figure 12.

The same center to center data set presented in Figure 11 is re-plotted as the per cent of cells doted relative to the number of cell areas defined. If 50 cells are dotted then cell area will be defined for 45% of the dotted cells. This relationship plateaus at approximately 70%.
