
Figure 13.
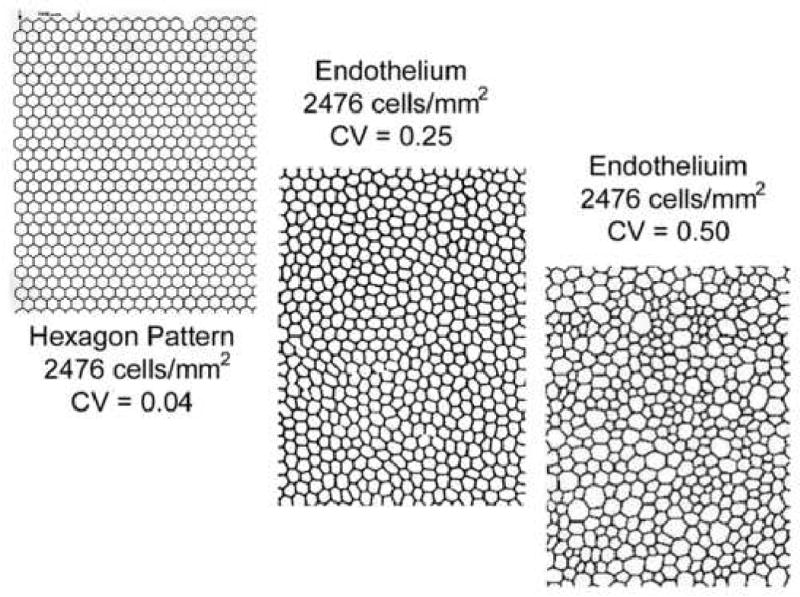
The effect of endothelial cell coefficient of variation relative to the number of cells counted per field is demonstrated in Figures A to D. Figures A and B are from a corneal with CV=25. Based on Graph A, a minimum of 75 cells per field should be counted to best represent cell density. In Figure B illustrates the large variation in estimating the coefficient of variation when counting <25 cells per field. Figures C and D were generated from a corneal with a coefficient of variation of 45. As the coefficient of variation increases the estimate for the endothelial cell density has a large increase in variation.