Abstract
Megavoltage, cone-beam computed tomography (MV CBCT) employing an electronic portal imaging device (EPID) is a highly promising technique for providing soft-tissue visualization in image-guided radiotherapy. However, current EPIDs based on active matrix flat-panel imagers (AMFPIs), which are regarded as the gold standard for portal imaging and referred to as conventional MV AMFPIs, require high radiation doses to achieve this goal due to poor x-ray detection efficiency (~2% at 6 MV). To overcome this limitation, the incorporation of thick, segmented, crystalline scintillators, as a replacement for the phosphor screens used in these AMFPIs, has been shown to significantly improve the DQE performance, leading to improved image quality for projection imaging at low dose. Toward the realization of practical AMFPIs capable of low dose, soft-tissue visualization using MV CBCT imaging, two prototype AMFPIs incorporating segmented scintillators with ~11 mm thick CsI:Tl and BGO crystals were evaluated. Each scintillator consists of 120 × 60 crystalline elements separated by reflective septal walls, with an element-to-element pitch of 1.016 mm. The prototypes were evaluated using a bench-top CBCT system, allowing the acquisition of 180 projection, 360° tomographic scans with a 6 MV radiotherapy photon beam. Reconstructed images of a spatial resolution phantom, as well as of a water-equivalent phantom, embedded with tissue equivalent objects having electron densities (relative to water) varying from ~0.28 to ~1.70, were obtained down to one beam pulse per projection image, corresponding to a scan dose of ~4 cGy – a dose similar to that required for a single portal image obtained from a conventional MV AMFPI. By virtue of their significantly improved DQE, the prototypes provided low contrast visualization, allowing clear delineation of an object with an electron density difference of ~2.76%. Results of contrast, noise and contrast-to-noise ratio are presented as a function of dose and compared to those from a conventional MV AMFPI.
Keywords: Megavoltage cone-beam CT, soft-tissue contrast, flat-panel imager, electronic portal imaging device, segmented crystalline scintillators, high x-ray detection efficiency
I. INTRODUCTION
Over the last several years, many imaging techniques have been developed to facilitate image-guided radiation therapy (IGRT) (Saw et al., 2006; Dawson and Jaffray, 2007) with the goal of achieving increased radiation dose to tumor volumes while minimizing dose to surrounding normal tissues and critical structures. These techniques generally provide in-room, 3-D volumetric image information and therefore are considered complimentary to portal imaging, which is typically achieved using an electronic portal imaging device (EPID). Among the advantages of 3-D imaging is the possibility of not only visualizing the bony anatomy, which typically is used as a surrogate for tumor localization (and often visible in EPID images), but also soft-tissue structures, allowing assessment of anatomical changes over the course of radiation treatment (Barker et al., 2004). One type of 3-D imaging techniques involves the acquisition of computed tomography (CT) images using a diagnostic CT scanner, referred to as “CT on rails” (Court et al., 2003). In this technique, the treatment couch is moved between the treatment gantry and the CT scanner. Another technique involves the acquisition of cone-beam computed tomography (CBCT) images using a kilovoltage (kV) x-ray source and an active matrix flat-panel imager (AMFPI), both mounted orthogonally to the treatment gantry (Jaffray and Siewerdsen, 2000; Jaffray et al., 2002). This technique, which has seen widespread clinical implementation, results in clinical doses on the order of 1–3 cGy (Islam et al., 2006; Amer et al., 2007) – doses that are approximately equivalent to those resulting from a single portal image.
An alternative imaging technique involves the use of the megavoltage (MV) treatment beam and an EPID to acquire CT scans – eliminating the need for additional x-ray sources or detectors. One example of such a technique involves the use of Tomotherapy equipment, which employs a high-pressure xenon gas detector (Mackie et al., 1999; Meeks et al., 2005). Another example involves the use of a large area EPID based on an AMFPI, employing a cone-beam geometry (Pouliot et al., 2005; Morin et al., 2006). Although the intrinsic contrast of human anatomical structures at MV energies is inferior to that at kV energies (Groh et al., 2002), it has been shown that soft tissue can be visualized at MV energies (Groh et al., 2002; Ford et al., 2002; Keller et al., 2002; Ghelmansarai et al., 2005). In addition, the use of the therapy beam for imaging presents some distinct advantages. Compared to kVCT, the images obtained using MVCT exhibit reduced streak artifacts, which are due to the presence of high Z materials such as dental fillings and hip prostheses (Pouliot et al., 2005; Yin et al., 2005). Furthermore, the CT numbers obtained from MVCT may be readily used for treatment planning dose calculations and inhomogeneity corrections – without the need for a conversion table such as used in kVCT (Guan et al., 2002; Langen et al., 2005; Morin et al., 2005). Finally, the fact that MVCT images are obtained from the therapy beam’s eye view eliminates any geometrical uncertainties associated with the additional apparatus of the kVCT configuration.
Despite these advantages, the practical implementation of MV CBCT is constrained by the relatively large dose required to achieve clinically useful contrast resolution using current MV AMFPIs, hereafter referred to as conventional MV AMFPIs (Groh et al., 2002). This limitation is the result of the relatively low x-ray detection efficiency (less than ~2% at 6 MV) of the x-ray converter, which consists of a relatively thick Gd2O2S:Tb phosphor screen coupled to a Cu plate, leading to a detective quantum efficiency (DQE) of only ~1% at zero spatial frequency (El-Mohri et al., 2001). In order to overcome this limitation, high efficiency x-ray detectors, based on area detection as well as linear scanning arrays, have been widely investigated (Lewis et al., 1992; Mosleh-Shirazi et al., 1998b; Mosleh-Shirazi et al., 1998a; Seppi et al., 2003; Pang and Rowlands, 2004; Sawant et al., 2005; Sawant et al., 2006; Samant and Gopal, 2006; Sillanpaa et al., 2006; Monajemi et al., 2006b; Monajemi et al., 2006a; Rathee et al., 2006; Wang et al., 2009b). The premise behind these efforts is that a substantial increase in x-ray detection efficiency achieved through increased detector thickness can be realized while minimizing the spatial spreading of secondary imaging quanta. One example of such an approach involves the use of thick, large-area, segmented crystalline scintillators consisting of 2D matrices of scintillator crystals [e.g., CsI:Tl, Bi4Ge3O12 (BGO), CdWO4 and ZnWO4] that are separated by optically opaque/reflective septal walls (Mosleh-Shirazi et al., 1998b; Seppi et al., 2003; Monajemi et al., 2004; Sawant et al., 2006; Wang et al., 2009b). The use of crystalline scintillators, as opposed to the granular phosphors employed in conventional MV AMFPIs, offers the advantage of lower optical Swank noise – enabling the use of thicker detector material with less severe degradation of DQE (Wang et al., 2009a). In addition, the use of opaque/reflective septal walls limits the extent of spatial resolution degradation, which would otherwise be significant as a result of the lateral spreading of secondary optical photons within the scintillator. Recent Monte Carlo simulations of radiation and optical transport have shown that segmented CsI:Tl and BGO scintillators up to 40 mm thick can provide significantly improved DQE values (~20% and 42%, respectively, at zero spatial frequency) (Wang et al., 2009a). Other Monte Carlo simulations involving radiation transport at 6 MV have been used to investigate the potential of such scintillators to visualize soft-tissue using CBCT at low dose (Wang et al., 2008). From this study, contrast-to-noise ratio (CNR) results suggest that a 40 mm thick, segmented CsI:Tl detector could delineate electron density differences of ~2.3% and 1.3% at a dose of 1.54 and 3.08 cGy, respectively.
Toward the realization of thick, large area segmented scintillators, a series of relatively small area prototypes with thicknesses ranging from ~11 mm to 40 mm, employing BGO and CsI:Tl crystals have been fabricated and examined (Sawant et al., 2006; Wang et al., 2009b). (While thicker scintillators are more desirable for larger increases in x-ray detection efficiency, examination of a range of scintillator thicknesses allows the probing of limitations and parameter dependencies.) These prototypes, which have an element-to-element pitch of 1.016 mm, were coupled to a 0.508 mm pitch AMFPI array and evaluated for projection imaging using a 6 MV photon beam. The prototypes exhibited input-quantum limited operation at the lowest available dose (i.e. 0.022 cGy corresponding to one beam pulse) with DQE values ranging from ~12 to 25 times that of a conventional MV AMFPI at zero spatial frequency. Spatial resolution, however, was less than optimal, especially for the thicker prototypes, in part due to some degree of light spreading between adjacent elements as well as less-than-ideal registration between the elements and the AMFPI array pixels (Sawant et al., 2006; Wang et al., 2009b). In the present article, two of these prototypes, based on BGO and CsI:Tl scintillators and having a thickness of ~11 mm, are examined for MV CBCT imaging using a high resolution (0.127 mm pitch) AMFPI array to circumvent the difficult task of registration. Reconstructed images of tissue-equivalent objects embedded in a water-equivalent phantom are obtained down to the lowest available dose per image frame corresponding to a total scan dose of ~4 cGy. Performance, in terms of contrast, noise and contrast-to-noise ratio of the tissue-equivalent objects is examined and compared to that from a prototype imager representative of conventional MV AMFPIs (El-Mohri et al., 2001).
II. METHODS
A. Segmented scintillator prototypes
The two segmented scintillator prototypes employed in this study have been described previously (Wang et al., 2009b) and a summary follows. Specifications for these prototypes are given in Table I. The prototypes consist of ~11.4 mm thick CsI:Tl and ~11.3 mm thick BGO detectors, having estimated x-ray detection efficiencies of ~25% and 39%, respectively (Wang et al., 2009a). Each detector consists of 120 × 60 scintillator elements arranged in a two-dimensional grid with an element-to-element pitch of 1.016 mm, resulting in an active area of ~122 × 61 mm2. Each scintillator element comprises a scintillating crystal surrounded by ~0.05 mm thick septal walls consisting of a polymer reflector and transparent glue. The walls, which act as a light barrier to limit spatial resolution degradation, have a reflectivity of ~90%, resulting in some degree of light sharing between adjacent elements. The choice of the septal wall thickness in these prototypes was motivated by the desire to improve element-to-element alignment in the manufacturing process, as compared to an earlier prototype (Sawant et al., 2006). While thinner walls present the added advantage of higher volumetric fill factor (the fraction of detector volume efficiently absorbing radiation and generating light), they may allow more light spread, resulting in poorer spatial resolution performance. Ideally, this performance should only be limited by the spread of the secondary Compton electrons within the scintillator (Sawant et al., 2006). Figure 1 shows both detectors resting on a high-contrast surface. Under illumination by white light, while the BGO detector exhibits excellent transparency, the CsI:Tl detector is more opaque as a result of a higher degree of optical self-scattering within the scintillating crystals as well as additional scattering at the rougher surfaces of the crystals. [For the respective emission spectra of these scintillators, peaked at ~480 nm for BGO and ~565 nm for CsI:Tl (Saint Gobain Crystals), light transmission might be somewhat different.]
Table I.
Summary of the properties and dimensions of the two segmented scintillator prototypes.
| Prototype segmented scintillator | Scitillator density (g/cm3) | Scintillator thickness (mm) | Pixel format | Pixel pitch (mm) | Active area (mm2) | Septal wall Thickness (mm) |
|---|---|---|---|---|---|---|
| CsI-1 | 4.51 | 11.4 | 120 × 60 | 1.016 | 122 × 61 | 0.05 |
| BGO-1 | 7.13 | 11.3 | 120 × 60 | 1.016 | 122 × 61 | 0.05 |
Figure 1.
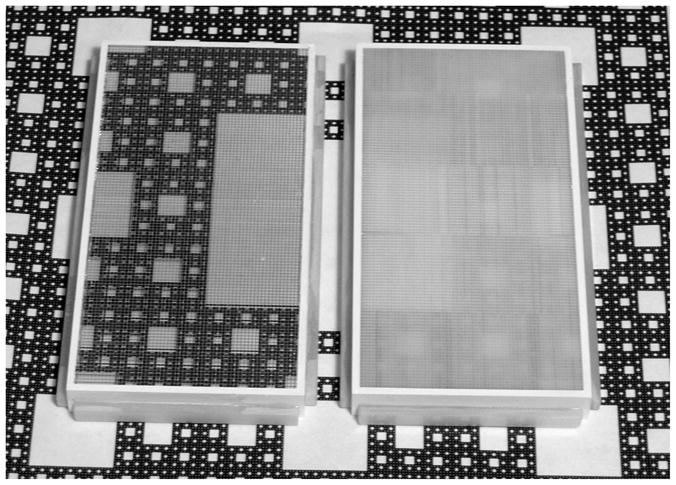
Photograph showing the BGO (left) and CsI:Tl (right) segmented scintillator prototypes resting on a high contrast print depicting a Sierpinski carpet. For each scintillator, a grid of vertical and horizontal lines corresponding to the septal walls is visible in the photo.
Each segmented scintillator prototype was coupled to an indirect detection AMFPI array operated in conjunction with a custom set of acquisition electronics (Huang et al., 1999). (In the present article, the imaging systems incorporating the CsI:Tl and BGO prototypes will be referred to as CsI-1 and BGO-1, respectively). The array design consists of a pixel format of 1024 × 1024 and a pitch of 0.127 mm, resulting in an area of ~13 × 13 cm2. Arrays of this design have been described and characterized in an earlier publication and have an optical fill factor of ~80% (Antonuk et al., 2009). The choice of this high resolution array, which has a pixel pitch eight times smaller than that of the scintillators, was motivated by the desire to achieve rapid and optimal registration of the scintillator elements with array pixels during set-up of the apparatus in the treatment room. Using this array, good registration was simply and quickly attained through angular alignment of the grid of septal walls with the gate and data lines of the array – without further need for registration of the scintillator elements (Wang et al., 2009b). Such over-sampling allows the acquisition of x-ray images that give a pictorial representation of the pixel structure of the segmented scintillators, from which precise binning to the size of the scintillator elements is achieved. Examples of such images are shown in Figure 2 for BGO-1 and CsI-1. Note that for both scintillators, as a result of the scintillator assembly process, the element-to-element alignment is better in the vertical direction. Also, note that while the septal walls for CsI-1 [Figure 2(a)] appear darker than the surrounding scintillating crystals, corresponding to lower light output, the relative shading is reversed for BGO-1. This unexpected result for BGO-1, where the septal walls appear to emit more light than the surrounding scintillating crystals can probably be attributed to the large mismatch in index of refraction between the BGO crystals and the transparent glue (2.15 for BGO and 1.55 for the glue) – leading to the entrapment and channeling of light along the septal walls. For each scintillator, close physical contact with the array was maintained simply by means of the weight of the scintillator. Optical coupling between the scintillator and the array was maintained without the use of an additional coupling medium. For CsI-1, the high optical conversion gain of the scintillating crystals (~54 photons/keV compared to only ~9 photons/keV for BGO crystals) (Saint-Gobain Crystals) required the use of an ~0.25 mm thick neutral density filter with ~21% light transmission. The filter was positioned between the scintillator and the array to help avoid array pixel saturation. For both prototypes, an ~1 mm thick Cu plate was positioned directly over the scintillators. The Cu plate acts as an optical mirror reflector as well as a radiation buildup layer, and also serves to absorb scattered radiation. Finally, for purposes of comparison, measurements were also conducted with a conventional MV AMFPI, consisting of a Lanex Fast-B phosphor screen (133 mg/cm2 Gd2O2S:Tb, Eastman Kodak, Rochester, NY), an overlying ~1 mm thick Cu plate, and the same AMFPI array and associated acquisition electronics used for the prototype scintillators.
Figure 2.
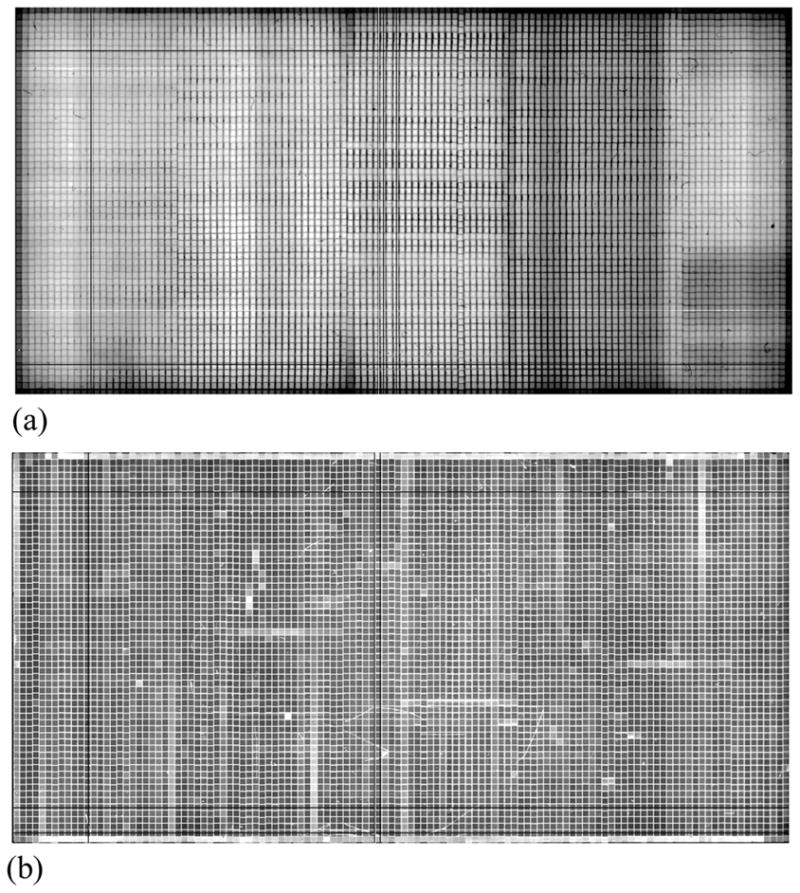
Flood images acquired at 6 MV at a dose of ~0.133 cGy using (a) CsI-1 and (b) BGO-1. Note that the observed grid of lines with lower signal (darker) for CsI-1 and higher signal (whiter) for BGO-1 correspond to the septal walls. See text for further details.
B. Experimental technique and apparatus
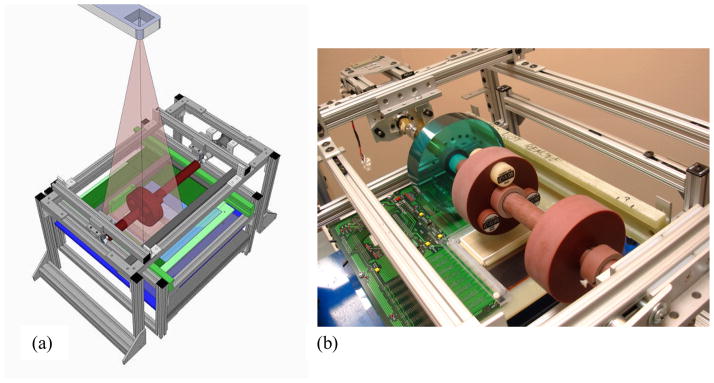
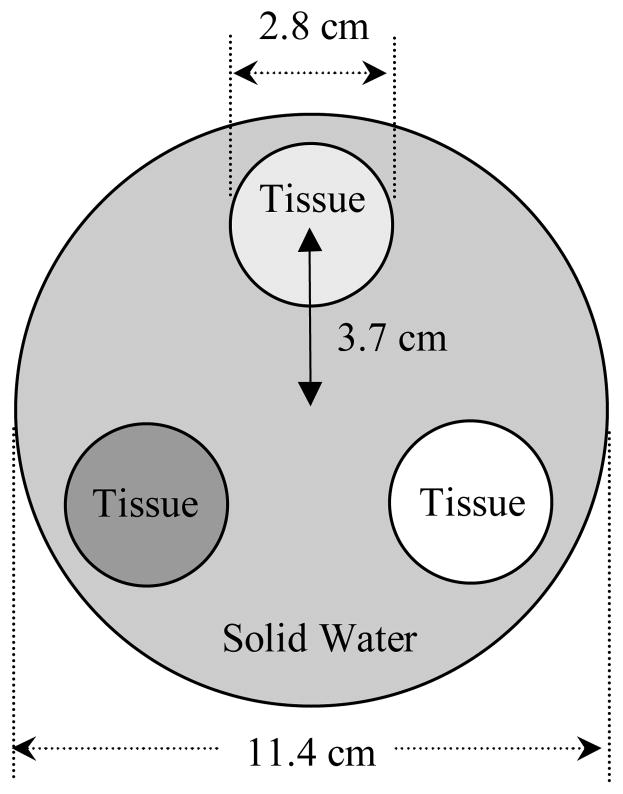
In order to explore the potential of the prototype segmented scintillators for low-contrast soft-tissue CBCT imaging, a bench-top scanning system allowing the acquisition of MV tomographic images has been constructed. The system consists of an aluminum frame that supports a solid cylindrical rod made of water-equivalent material (solid water) onto which phantoms can be inserted, as seen in Figures 3(a) and 3(b). Each phantom consists of a 4 cm thick disk with a hole drilled through the center to allow the phantom to slip onto the rod. During image acquisition, the rod is made to rotate around its axis above the scintillator, while keeping the x-ray source at a fixed position. This relatively simple configuration allowed tomographic scans to be obtained by controlling the rotation of the phantom rather than controlling the rotation of the x-ray source and imager. The rotation of the phantom was controlled by a hybrid stepping motor equipped with a 14:1 speed-reducing gearbox operated at a constant speed. The angular velocity of the phantom, as well as the start and stop of the motor, were controlled by a high accuracy stepper motor controller card connected to a host computer via a USB port. Three different phantoms were used to characterize CsI-1, BGO-1 and the conventional MV AMFPI. One phantom, referred to as the contrast phantom, has three holes into which tissue-equivalent objects can be inserted. Details of this phantom are shown in Figure 4. A total of twelve different, ~7 cm long, cylindrical objects of various densities were used. Designations and relative electron densities of these objects are summarized in Table II. A second phantom made with the same material and dimensions (referred to as the uniform phantom) has no inserted objects or holes and was used to provide a reference for the cupping artifact correction (discussed below). Finally, a third phantom, referred to as the resolution phantom, was used to characterize the spatial resolution performance of the various MV AMFPI configurations (CsI-1, BGO-1 and conventional). This phantom consists of an epoxy mix and contains 2 mm thick aluminum contrast line-pair inserts with resolution sections ranging from 1 to 21 lp/cm, in steps of 1 lp/cm (High Resolution Module, CTP528, The Phantom Laboratory, Salem, NY).
Figure 3.
(a) Conceptual drawing of the cone-beam CT bench-top system used in the study, including the radiation source. (b) Photograph showing a close up of the system clearly depicting the three phantoms mounted above the CsI:Tl segmented scintillator prototype and the underlying AMFPI array.
Figure 4.
Cross-sectional drawing of the contrast phantom with various dimensions indicated. The phantom is made of solid water into which cylindrical holes are drilled in order to accommodate three tissue-equivalent objects at a time.
Table II.
List of designations, densities and electron densities relative to water for the tissue-equivalent objects examined in this study (Tissue Characterization phantom, Gammex 467, Gammex rmi, Middleton, WI). Note that there are two entries for solid water material: one for the material of the main body of the contrast phantom and the other for the tissue-equivalent object inserted in that body. The inclusion of this solid water object in the study was motivated by the fact that it provided the lowest electron density difference relative to the solid water of the main body (2.76%) – offering a challenging test for visualization of low contrast objects at the lowest available dose. The last column in the table gives the percentage difference in electron density between the tissue-equivalent objects and the solid water of the main body of the contrast phantom.
| Designation of Tissue- equivalent Object | Physical Density (g/cm3) | Electron Density Relative to Water | Electron density difference (%) |
|---|---|---|---|
| Lung (LN-300) | 0.29 | 0.280 | 72.44 |
| Lung (LN-450) | 0.44 | 0.429 | 57.78 |
| Adipose (AP6) | 0.94 | 0.925 | 8.96 |
| Breast | 0.98 | 0.954 | 6.10 |
| Solid Water (Object) | 1.017 | 0.988 | 2.76 |
| Solid Water (Phantom) | 1.046 | 1.016 | 0.00 |
| Brain | 1.053 | 1.049 | 3.25 |
| Liver (LV1) | 1.097 | 1.065 | 4.82 |
| Inner Bone | 1.143 | 1.096 | 7.87 |
| Bone (B200) | 1.154 | 1.106 | 8.86 |
| Bone (CB2-30% Mineral) | 1.335 | 1.280 | 25.98 |
| Bone (CB2-50% Mineral) | 1.56 | 1.470 | 44.69 |
| SB3 Cortical Bone | 1.825 | 1.697 | 67.03 |
MV CBCT images were acquired using a 6 MV photon beam from a Varian radiotherapy linear accelerator (LINAC) operated at a dose rate of 100 Monitor Units (MU)/minute. The LINAC was calibrated so that 1 MU delivers a dose of 0.8 cGy for a 10 × 10 cm2 field at 10 cm water depth and at a source-to-detector distance (SDD) of 100 cm. At this dose rate, the LINAC delivers ~36 beam pulses per MU, corresponding to a dose of ~0.022 cGy per pulse. In this article, the dose for a tomographic scan is reported in terms of the LINAC’s radiation output in cGy, assuming the aforementioned correspondence between dose in cGy and the delivered MUs under calibration conditions. Beam pulses, which are typically 5 μs long, were generated at a frequency of 60 Hz, corresponding to a time interval between pulses of ~16.7 ms. These pulses were used to trigger array readout, allowing synchronization between radiation delivery and image acquisition. Given the desire to acquire projection images at the lowest dose available, corresponding to a single beam pulse, each image must be read out within the 16.7 ms time interval between consecutive beam pulses. However, due to limitations of the electronic acquisition system (Huang et al., 1999) which allows a minimum readout time of ~113 ms for addressing the 1024 gate lines of the AMFPI array, it was necessary to use a combination of simultaneous readout of multiple gate lines and partial array readout to accomplish this objective. (The readout speed of the acquisition system is limited by the conversion rate of the 18-bit analog-to-digital converters as well as the 16:1 multiplexing of the data, resulting in a minimum readout time of ~110 μs for a single gate line.) As a result, only a total of 400 gate lines were addressed with each four consecutive lines being addressed simultaneously, resulting in a total of 100 binned lines and a readout time of ~14 ms. Such a configuration for array readout achieves pixel binning, which partially fulfills the intended matching of the scintillator elements, without causing any adverse affects on imager performance. The corresponding active area of the array was ~5.1 × 13 cm2 – an area sufficiently large to accommodate the projected area of the contrast phantom (~4.2 × 12.0 cm2). For all AMFPI configurations, the SDD was set to ~130 cm and the field size to ~9 × 13 cm2 at isocenter.
C. Image acquisition and analysis
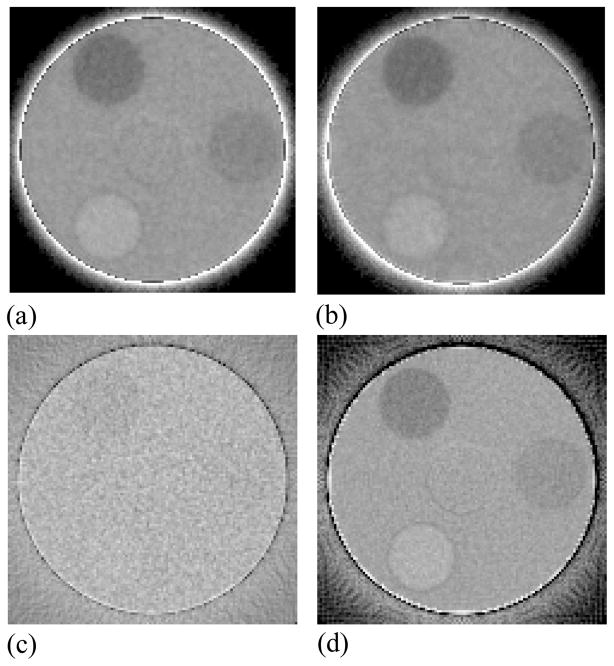
For each tomographic acquisition, a total of 8000 projection images were acquired corresponding to a total of 44 complete 360° scans, with each scan comprising 180 images. The total dose delivered per scan was ~4 cGy. To investigate performance at higher doses, images from different scans were combined resulting in averaged scans with equivalent doses corresponding to a multiple of 4 cGy. In this case, the large number of scans acquired allowed the study of dose dependence as well as the determination of the statistical error in the measurements (obtained through calculation of the standard deviation derived from the data of the multiple scans). For the case of BGO-1, a total of 2000 MUs were delivered prior to the start of the measurements in order to attain a stable scintillator light output that is largely independent of accumulated dose. This pre-irradiation was necessary since the BGO-1 signal response is known to exhibit an initial sharp decline of ~17% with increasing cumulative dose before reaching an asymptotic level (Wang et al., 2009b). For each MV AMFPI configuration (BGO-1, CsI-1 or conventional) a set of 100 flood images were also obtained in the absence of the phantoms along with a further 100 dark images – to provide gain and offset correction parameters for processing of the projection images of the tomographic scans. A Feldkamp-based algorithm employing a ramp filter was used to reconstruct the spatial distribution of attenuation coefficients for the phantoms using gain and offset-corrected projection and flood images (Wang et al., 2008). Prior to image reconstruction, all projection images were filtered by means of a 3 × 3 median filter in order to remove array pixel and line defects. In addition, the images were binned in a 8 × 2 format (gate × data line direction) so as to match the element-to-element pitch of the scintillators (1.016 × 1.016 mm2). (Note that, in the data line direction, only × 2 binning is required since array pixels have already been binned in a 1 × 4 format by means of multiple gate line readout.) The reconstructed voxel and slice thickness were chosen to be 1.016 mm, matching the element-to-element pitch of the scintillators. Unless otherwise stated, all results shown correspond to the sum of five consecutive slices, resulting in a slice thickness of ~5 mm. All reconstructed images, except for those of the resolution phantom, were subjected to a cupping artifact correction to remove a background trend as well as ring artifacts. While the background trend, which manifests itself as a general increase in signal along the radial direction of the phantom, is due to beam hardening, ring artifacts are likely due to non-uniform detector response. Figure 5 shows an example of a reconstructed image of the contrast phantom before and after the application of the cupping correction. The correction consists of mapping the average signal as a function of radial distance in the background region, excluding the regions of the inserts (Wang et al., 2008). In order to compare results from different sets of inserts as well as different AMFPI configurations, the signal in the background was normalized to values obtained from corresponding reconstructed images of the uniform phantom. After application of the cupping correction, the reconstructed images exhibit a more uniform response, as seen in Figure 5(b).
Figure 5.
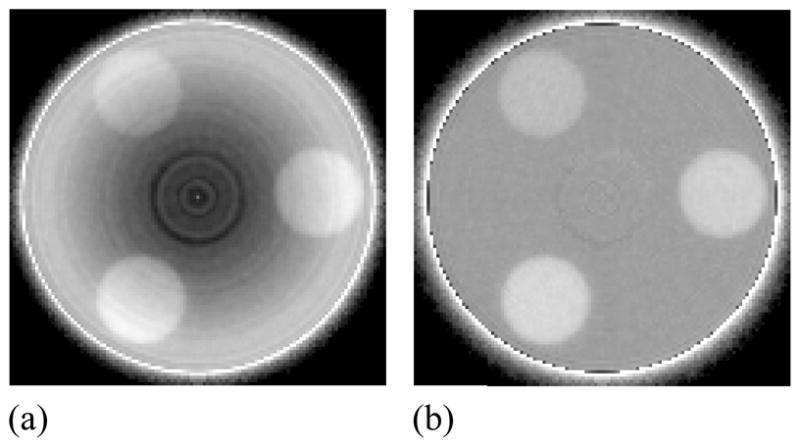
Reconstructed images of the contrast phantom embedded with three tissue-equivalent objects (a) before and (b) after the application of a cupping artifact correction. The images were obtained with BGO-1 at a scan dose of 16 cGy. Note the presence of a ring-like artifact close to the center of the phantom that was not removed by the correction. This artifact is likely due to the presence of unintended air gaps between the phantom and the solid water rod that supports it.
D. Performance evaluation
Performance of various MV AMFPI configurations was characterized in terms of contrast (Contrast), noise (Noise) and contrast-to-noise-ratio (CNR) of the tissue-equivalent objects relative to the surrounding water-equivalent background in the reconstructed images of the contrast phantom. The contrast of a given object was calculated (in Hounsfield units, HU) as follows:
| (1) |
where Sobj and Swater represent the mean signal in the object and solid water regions, obtained through averaging signals from 185 and 555 voxels, respectively. The choice of these regions of interest excluded the edge of the objects and the phantom as well as the center of the phantom. Similarly, the noise in the object was calculated from:
| (2) |
where σobj represents the standard deviation of the signal in the object. Therefore, the CNR was calculated from:
| (3) |
III. RESULTS
A. Reconstructed Images
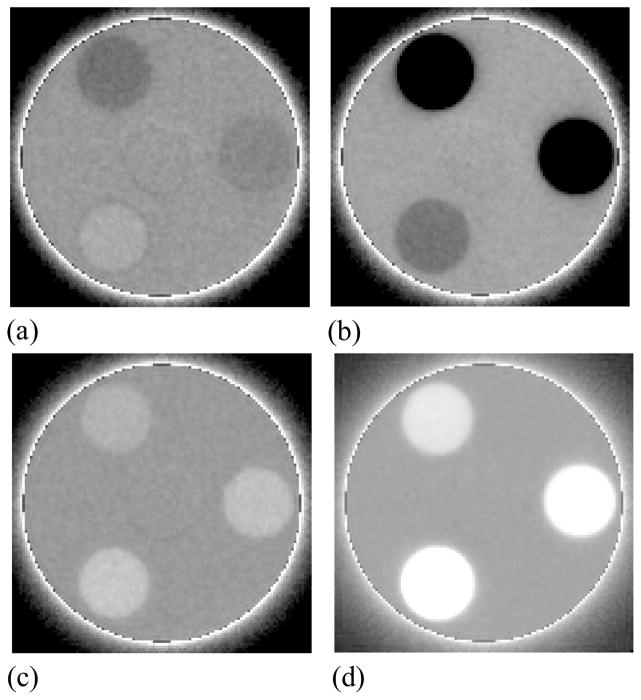
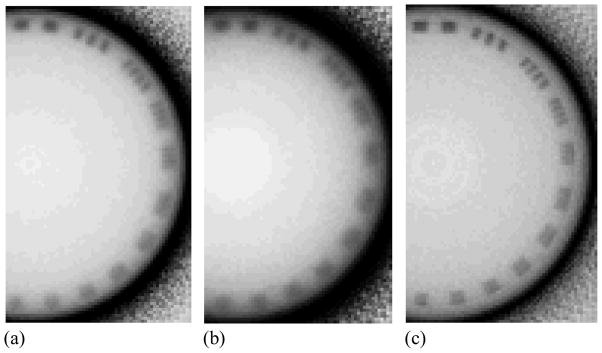
Examples of reconstructed images of the contrast phantom obtained with BGO-1 for a slice thickness of ~5 mm are shown in Figure 6. The images, depicting all twelve tissue-equivalent objects used, were obtained at a scan dose of ~4 cGy corresponding to a single beam pulse per projection image. These and similar images of the contrast phantom were used to derive the following results for Contrast, Noise and CNR. Reconstructed images of the contrast phantom including the three objects that exhibit the lowest relative electron density difference relative to the solid water background are shown in Figure 7 for various AMFPI configurations. At a total scan dose of ~4 cGy, the images obtained with BGO-1 and CsI-1 [Figure 7(a) and 7(b)] exhibit significantly higher contrast resolution compared to that of the conventional MV AMFPI [Figure 7(c)]. Such good performance is the result of the more efficient use of the incident x-rays by BGO-1 and CsI-1 achieved by virtue of DQE(0) values of ~20%, and ~12%, respectively (Wang et al., 2009b) – compared to only ~1% for the conventional MV AMFPI. While all the tissue-equivalent objects are clearly seen for BGO-1 and CsI-1, including the water-equivalent object (see Table I), none of these objects are easily discerned for the conventional MV AMFPI. However, with the use of forty times more dose (160 cGy) for the conventional MV AMFPI, the objects become visible with slightly improved edge definition compared to the BGO-1 and CsI-1 images – a consequence of the superior spatial resolution performance of the phosphor screen. Finally, BGO-1 exhibits slightly better spatial resolution performance compared to CsI-1, confirming the findings from a previous study of the prototypes involving measurements of the modulation transfer function (Wang et al., 2009b). These observations on spatial resolution performance are consistent with the results of reconstructed images obtained with the resolution phantom, shown in Figure 8. These images depict some of the line-pair inserts of the resolution phantom with sizes ranging from 1 to 11 lp/cm. While for BGO-1 [Figure 8(a)] it is possible to discern the inserts representing a resolution of 4 lp/cm (corresponding to a line spacing of ~1.25 mm), for CsI-1 [Figure 8(b)] the highest discernable insert is that at 3 lp/cm (corresponding to a line spacing of ~1.66 mm). By comparison, the image obtained with the conventional MV AMFPI [Figure 8(c)] demonstrates sharper edge definition and a clear definition of the inserts up to that at 4 lp/cm.
Figure 6.
Reconstructed images of the contrast phantom embedded with various tissue-equivalent objects. The objects shown correspond to relative electron densities of (clockwise from the top): (a) 0.954, 0.988, 1.049; (b) 0.280, 0.429, 0.925; (c) 1.065, 1.096, 1.106; and (d) 1.280, 1.470, 1.697. The images were obtained with BGO-1 at a scan dose of ~4 cGy.
Figure 7.
Reconstructed images of the contrast phantom embedded with three tissue-equivalent objects corresponding to relative electron densities of (clockwise from the top): 0.954, 0.988, and 1.049. The images were obtained at a scan dose of ~4 cGy with (a) BGO-1, (b) CsI-1 and (c) the conventional MV AMFPI. The image in (d) was obtained with the conventional MV AMFPI at 160 cGy by averaging 40 tomographic scans.
Figure 8.
Reconstructed images of the resolution phantom obtained with (a) BGO-1, (b) CsI-1, and (c) the conventional MV AMFPI at a scan dose of 16, 16, and 160 cGy, respectively. The images were obtained using a slice thickness of 1.016 mm, corresponding to the element-to-element pitch of the BGO-1 and CsI-1 segmented scintillators. Note that the choice of doses used to produce these images was guided by the desire to produce good images whose quality is not limited by image noise. Also, note that for these images the gray scale has been inverted in order to enhance presentation. The line-pair inserts shown in the images represent spatial resolutions of (clockwise from the top) 1, 2, 3, 4, 5, 6, 7, 8, 9, 10, and 11 lp/cm corresponding to a line spacing distance of ~5.00, 2.50, 1.66, 1.25, 1.00, 0.83, 0.71, 0.62, 0.55, 0.50, and 0.45 mm, respectively.
B. Contrast, Noise and CNR
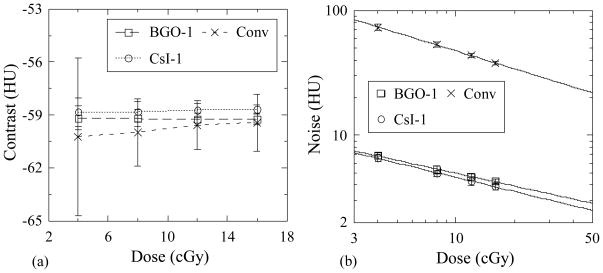
Figures 9(a) and 9(b) show Contrast and Noise results as a function of dose for the breast tissue-equivalent object obtained using BGO-1 and CsI-1 as well as with the conventional MV AMFPI. Within statistical error, Contrast exhibits no clear dependence on dose or on the type of detector used – a consequence of the fact that the value of this metric is largely determined by the properties of the object imaged. Noise, shown in Figure 9(b), decreases as a function of dose as a result of the increase in the x-ray quanta sampled. For a given dose, while CsI-1 is expected to exhibit higher Noise values compared to BGO-1 by virtue of its inferior x-ray detection efficiency (~25% compared to ~39%), the more pronounced light spreading for CsI-1, which causes inferior spatial resolution performance, leads to reduced voxel-to-voxel signal variations in the reconstructed images – resulting in slightly lower values of Noise. As expected, the conventional MV AMFPI exhibits the highest Noise values due to the substantially lower number of x-ray quanta sampled (~2% x-ray detection efficiency).
Figure 9.
(a) Contrast and (b) Noise for the breast tissue-equivalent object as a function of total scan dose. Results are shown for BGO-1 and CsI-1, as well as for the conventional MV AMFPI. The lines connecting the data points in (a) are drawn to guide the eye while the lines in (b) are fits to the data. Statistical error bars are illustrated in this and the following figures, except as noted.
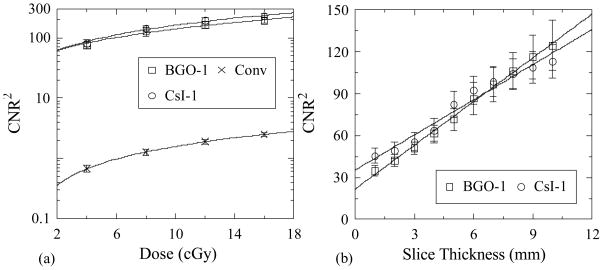
Figure 10(a) shows values for CNR2 derived from the Contrast and Noise results of Figure 9. For all detector configurations, CNR2 is observed to increase with increasing dose, mainly due to the corresponding decrease of Noise. This dependence follows a linear trend – as demonstrated by the lines running through the data points which correspond to linear fits of the data, plotted on a log scale. Figure 10(b) illustrates CNR2 performance as a function of slice thickness up to ~10 mm for BGO-1 and CsI-1 at a scan dose of ~4 cGy. These results also exhibit a linear increase with increasing slice thickness. The linear behaviors observed in Figures 10(a) and 10(b) for the breast object, and similarly observed for all objects studied, are as expected and are due to the inverse proportionality between the square of Noise (Noise2) and the number of sampled quanta (i.e., Noise2 ∝ 1/Ntot where Ntot is the total number of x-ray photons interacting in a given voxel).
Figure 10.
CNR2 as a function of (a) total scan dose and (b) slice thickness. Results for the breast tissue-equivalent object are shown for BGO-1 and CsI-1, as well as for the conventional MV AMFPI. Results in (a) are plotted on a log scale to enhance clarity of presentation for the data corresponding to the conventional MV AMFPI. The lines connecting the points in (a) and (b) are linear fits to the data.
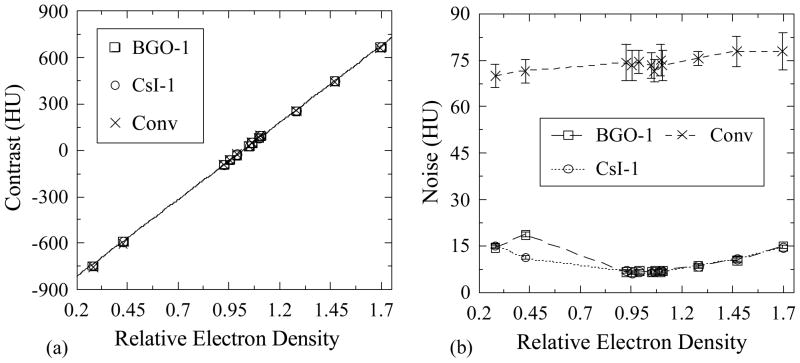
Figures 11(a) and 11(b) show Contrast and Noise, respectively, plotted as a function of the relative electron density of the various tissue-equivalent objects, obtained with BGO-1 and CsI-1 as well as with the conventional MV AMFPI. Contrast is seen to exhibit a fairly linear dependence on relative electron density due to the dominance of Compton interactions at radiotherapy x-ray energies. Specifically, this behavior is the consequence of the linear dependence of the probability of Compton interactions on the electron density of the interaction material. The observed values of Contrast indicate that this quantity is a property of the object imaged and is largely independent of the detector configuration. For the two prototypes, Noise values are observed to be similar except for the anomalously high (and repeatable) value for BGO-1 at an electron density of 0.429. For objects with relative electron densities closer to that of water, Noise is seen to be fairly independent of this quantity. Moreover, for objects with densities much higher or lower than that of water, Noise values are higher. Since such a pattern of behavior is not observed in the results obtained from the conventional MV AMFPI, it is suspected that this pattern is due to the cupping correction. In the case of the MV AMFPI, any uncertainties introduced by the cupping correction are dwarfed by the inherently large values of Noise in the reconstructed images.
Figure 11.
(a) Contrast and (b) Noise as a function of relative electron density for the various tissue-equivalent objects. Results are shown for BGO-1 and CsI-1, as well as for the conventional MV AMFPI, at a total scan dose of ~4 cGy. The line appearing in (a) represents a linear fit to the BGO-1 data while the lines in (b) are drawn to guide the eye. Note that the error bars in (a) have been purposely omitted due to their small size.
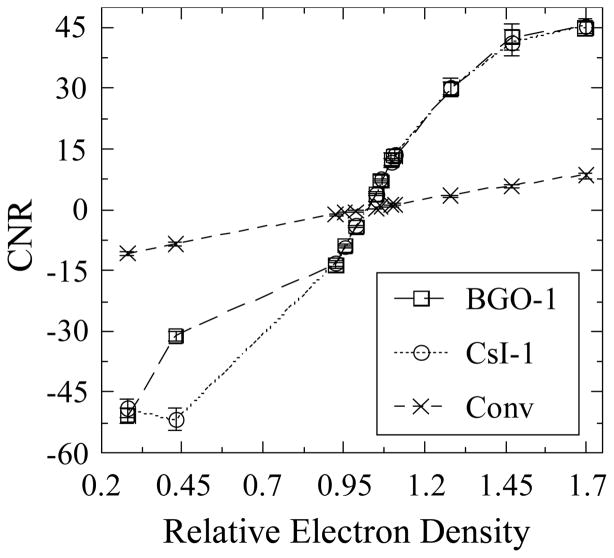
Figure 12 shows results for CNR derived from the Contrast and Noise data of Figure 11 and plotted as a function of relative electron density. While CNR for the conventional MV AMFPI is seen to be linear for all objects, for BGO-1 and CsI-1 a reasonable degree of linearity is observed only for objects with relative electron densities ranging from ~0.92 to ~1.11 – due to the corresponding linear behavior of Contrast and constancy of Noise for these objects. The CNR values for objects with densities outside this range exhibit a non-linear dependence on this metric due to the higher than expected Noise values discussed above. Finally, the observed superior performance of the prototypes compared with that of the conventional MV AMFPI is the result of significantly lower Noise values.
Figure 12.
CNR as a function of the relative electron density of the various tissue-equivalent objects. The results were obtained with BGO-1 and CsI-1, as well as with the conventional MV AMFPI, at a total scan dose of ~4 cGy. Note that the lines connecting the data points are drawn to guide the eye.
IV. SUMMARY AND DISCUSSION
Active matrix flat-panel imagers, currently regarded as the gold standard for portal imaging, utilize a very inefficient x-ray converter in the form of a relatively thick Gd2O2S:Tb phosphor screen coupled to a ~1 mm metal plate, resulting in an x-ray detection efficiency of only ~2% at a photon beam energy of 6 MV. However, the incorporation of thick segmented scintillators, as a replacement for such granular phosphor screens, provides a substantial increase in detection efficiency and has shown considerable promise for improving the imaging performance without seriously degrading spatial resolution or contributing additional Swank noise due to variations in the generation of optical photons. Toward the realization of practical AMFPIs capable of performance largely limited by the radiation transport within the x-ray converter material, and offering minimal degradation due to optical transport, a number of prototype AMFPIs based on thick BGO and CsI:Tl scintillators have been developed and evaluated by our group for portal (i.e., 2-D) imaging. Given the high detection efficiency of these prototypes, combined with the desire to obtain 3-D image information in the treatment room for image-guided radiation therapy, it is of interest to investigate these prototypes in the context of low dose MV CBCT. In this article, preliminary MV CBCT results from two prototypes based on ~11 mm thick BGO and CsI:Tl scintillators for MV CBCT are reported and these results are compared to those from a conventional MV AMFPI. The study was performed for 180 projection, 360° tomographic scans employing the lowest available dose of ~4 cGy (corresponding to one beam pulse per projection). This dose is similar to that typically employed for patient setup using kV CBCT or acquiring a single portal image from a conventional MV AMFPI. By virtue of their greatly improved detection efficiency, the prototypes provided reconstructed images allowing visualization of low contrast objects for a 5 mm slice thickness. For example, an object with an electron density difference of ~2.76%, corresponding to a CNR value of ~4, was clearly visible in the reconstructed images of the two prototypes. By comparison, the conventional MV AMFPI demonstrated a corresponding CNR value more than ten times smaller, and did not permit delineation of the object. For this imager, much higher doses were required to reduce image noise so as to allow visualization of the object. The level of improved contrast resolution offered by the current prototypes should facilitate soft-tissue visualization in image-guided radiotherapy at practical MV patient doses, and are also expected to benefit portal imaging through improved image quality at current levels of dose, or equivalent image quality at substantially lower dose.
While both types of scintillators (BGO and CsI:Tl) have shown definite promise for improving the imaging performance of current MV AMFPIs, BGO provides a number of advantages. For a given thickness, BGO offers higher DQE and superior spatial resolution by virtue of its higher material density and refractive index, respectively. These properties engender opposing effects upon noise, resulting in a CNR performance that is largely equivalent for the two prototypes. However, if ideal optical isolation between scintillator elements could be achieved, the BGO-1 prototype would provide lower noise and thus higher CNR (Wang et al., 2008). Furthermore, BGO is non-hygroscopic and provides better material hardness, resulting in easier machining and polishing. Finally, although BGO has a significantly lower light output compared to CsI:Tl, this has minimal influence on performance, given that for BGO-1 the system is input-quantum limited, even at the lowest dose of 1 beam pulse (Wang et al., 2009b). However, the present BGO scintillator exhibits an undesirable radiation-induced effect, which consists of a sharp decline of light output within the first few hundred cGy of radiation, requiring the use of a pre-irradiation procedure to stabilize signal (Wang et al., 2009b). While previous examinations of the effect of radiation on the performance of BGO crystals have indicated widely varying results (Wei et al., 1990; Zhu et al., 1991; Zhu et al., 1995; Zhu, 1998; Georgii et al., 1998; Peng et al., 2000; Sahu et al., 1997), the introduction of Eu3+ as a doping agent may significantly reduce the effect (Wei et al., 1990; Zhu et al., 1991; Zhu et al., 1995; Zhu, 1998), facilitating practical implementation of such detectors in a clinical setting.
With a scintillator thickness of ~11 mm, the BGO prototype offers a zero-frequency DQE of ~20% – twenty times higher than that of conventional MV AMFPIs. While prototypes with thicker scintillators could further improve the DQE and allow even better soft-tissue visualization at low dose, degradation of spatial resolution due to obliquely incident radiation could mitigate the improvement expected from higher x-ray detection efficiencies (Wang et al., 2010). For example, for a large area (e.g., 40 × 40 cm2) clinical imager based on segmented scintillators with thicknesses much greater than ~10 mm, x-rays incident at locations away from the central axis will impinge the scintillators at increasingly oblique angles – resulting in a substantial lateral displacement of energy deposition across the scintillator and causing severe degradation of spatial resolution and DQE performance. Future substantial increases in DQE beyond the levels obtained with the present prototypes could potentially be achieved through the use of thicker (i.e., greater than ~10 mm) scintillators arranged in a two-dimensionally focused geometry (Wang et al., 2010) or, alternatively, through the use of higher density scintillators with thicknesses up to ~10 mm. The strong motivation to improve DQE for MV imagers will doubtless inspire interesting innovations in the coming years.
Acknowledgments
The authors would like to thank Mike Yeakey, Alan Young, Charles Martelli and Dr. Yi Wang for assistance with the establishment of the bench-top CT system. The authors would also like to thank Dr. Jeffrey Fessler for providing the cone-beam reconstruction algorithm, and Martin Koniczek with assistance in the utilization of the algorithm. This project is supported by NIH grant R01 CA051397.
References
- Amer A, Marchant T, Sykes J, Czajka J, Moore C. Imaging doses from the Elekta Synergy x-ray cone beam CT system. Br J Radiol. 2007;80 doi: 10.1259/bjr/80446730. [DOI] [PubMed] [Google Scholar]
- Antonuk LE, Zhao Q, El-Mohri Y, Du H, Wang Y, Street RA, Ho J, Weisfield R, Yao W. An investigation of signal performance enhancements achieved through innovative pixel design across several generations of indirect detection, active matrix, flat-panel arrays. Medical Physics. 2009;36:3322–39. doi: 10.1118/1.3049602. [DOI] [PMC free article] [PubMed] [Google Scholar]
- Barker JL, Garden AS, Ang KK, O’Daniel JC, Wang H, Court LE, Morrison WH, Rosenthal DI, Chao SC, Tucker SL, Mohan R, Dong L. Quantification of volumetreic and geometric changes occuring during fractional radiotherapy for head-and-neck cancer using an integrated CT/linear accelerator system. Int J Radiat Oncol, Biol, Phys. 2004;59:960–70. doi: 10.1016/j.ijrobp.2003.12.024. [DOI] [PubMed] [Google Scholar]
- Court L, Rosen I, Mohan R, Dong L. Evaluation of mechanical precision and alignment uncertainties for an integrated CT/LINAC system. Med Phys. 2003;30:1198–210. doi: 10.1118/1.1573792. [DOI] [PubMed] [Google Scholar]
- Dawson LA, Jaffray DA. Advances in image-guided radiation therapy. Journal of Clinical Oncology. 2007;25:938–46. doi: 10.1200/JCO.2006.09.9515. [DOI] [PubMed] [Google Scholar]
- El-Mohri Y, Jee K-W, Antonuk LE, Maolinbay M, Zhao Q. Determination of the Detective Quantum Efficiency of a Prototype, Megavoltage Indirect Detection, Active Matrix Flat-Panel Imager. Medical Physics. 2001;28:2538–50. doi: 10.1118/1.1413516. [DOI] [PubMed] [Google Scholar]
- Ford EC, Chang J, Mueller K, Sidhu K, Todor D, Mageras G, Yorke E, Ling CC, Amols H. Cone-beam CT with megavoltage beams and an amorphous silicon electronic portal imaging device: potential for verification of radiotherapy of lung cancer. Medical Physics. 2002;29:2913–24. doi: 10.1118/1.1517614. [DOI] [PubMed] [Google Scholar]
- Georgii R, Meifll R, Hajdas W, Henschel H, Graf HD, Lichti GG, Neumann-Cosel Pv, Richter A, Schonfelder V. Influence of radiation damage on BGO scintillation properties. Nuclear Instruments and Methods in Physics Research Section A. 1998;413:50–8. [Google Scholar]
- Ghelmansarai FA, Bani-Hashemi A, Pouliot J, Calderon E, Hernandez P, Mitschke M, Aubin M, Bucci K. Soft Tissue Visualization Using a Highly Efficient Megavoltage Cone Beam CT Imaging System. Proc SPIE. 2005;5745:159–70. [Google Scholar]
- Groh BA, Siewerdsen JH, Drake DG, Wong JW, Jaffray DA. A performance comparison of flat-panel imager-based MV and kV cone-beam CT. Med Phys. 2002;29:967–75. doi: 10.1118/1.1477234. [DOI] [PubMed] [Google Scholar]
- Guan H, Yin FF, Kim JH. Accuracy of inhomogeneity correction in photon radiotherapy from CT scans with different settings. Physics in Medicine and Biology. 2002;47:N223–N31. doi: 10.1088/0031-9155/47/17/402. [DOI] [PubMed] [Google Scholar]
- Huang W, Antonuk LE, Berry J, Maolinbay M, Martelli C, Mody P, Nassif S, Yeakey M. An asynchronous, pipelined, electronic acquisition system for active matrix flat-panel imagers (AMFPIs) Nucl Instrum Meth Phys Res A. 1999;431:273–84. [Google Scholar]
- Islam MK, Purdie TG, Norrlinger BD, Alasti H, Moseley DJ, Sharpe MB, Siewerdsen JH, Jaffray DA. Patient dose from kilovoltage cone beam computed tomography imaging in radiation therapy. Med Phys. 2006:33. doi: 10.1118/1.2198169. [DOI] [PubMed] [Google Scholar]
- Jaffray DA, Siewerdsen JH. Cone-beam computed tomography with a flat-panel imager: initial performance characterization. Med Phys. 2000;27:1311–23. doi: 10.1118/1.599009. [DOI] [PubMed] [Google Scholar]
- Jaffray DA, Siewerdsen JH, Wong JW, Martinez AA. Flat-panel cone-beam computed tomography for image-guided radiation therapy. Int J Radiat Oncol, Biol, Phys. 2002;53:1337–49. doi: 10.1016/s0360-3016(02)02884-5. [DOI] [PubMed] [Google Scholar]
- Keller H, Glass M, Hinderer R, Ruchala K, Jeraj R, Olivera G, Mackie TR. Monte Carlo study of a highly efficient gas ionization detector for megavoltage imaging and image-guided radiotherapy. Medical Physics. 2002;29:165–75. doi: 10.1118/1.1445414. [DOI] [PubMed] [Google Scholar]
- Langen KM, Meeks SL, Poole DO, Wagner TH, Willoughby TR, Kupelian PA, Ruchala KJ, Haimerl J, Olivera GH. The use of megavoltage CT (MVCT) images for dose recomputations. Phys Med Biol. 2005;50:4259–76. doi: 10.1088/0031-9155/50/18/002. [DOI] [PubMed] [Google Scholar]
- Lewis DG, Swindell W, Morton EJ, Evans PM, Xiao ZR. A megavoltage CT scanner for radiotherapy verification. Phys Med Biol. 1992;37:1985–99. doi: 10.1088/0031-9155/37/10/013. [DOI] [PubMed] [Google Scholar]
- Mackie TR, Balog J, Ruchala K, Shepard D, Aldridge S, Fitchard E, Reckwerdt P, Olivera G, McNutt T, Mehta M. Tomotherapy. Semin Radiat Oncol. 1999;9:108–17. doi: 10.1016/s1053-4296(99)80058-7. [DOI] [PubMed] [Google Scholar]
- Meeks SL, Harmon JF, Langen KM, Willoughby TR, Wagner TH, Kupelian PA. Performance characterization of megavoltage computed tomography imaging on a helical tomotherapy unit. Med Phys. 2005;32:2673–81. doi: 10.1118/1.1990289. [DOI] [PubMed] [Google Scholar]
- Monajemi TT, Fallone BG, Rathee S. Thick, segmented CdWO4-photodiode detector for cone beam megavoltage CT: A Monte Carlo study of system design parameters. Med Phys. 2006a;33:4567–77. doi: 10.1118/1.2370503. [DOI] [PubMed] [Google Scholar]
- Monajemi TT, Steciw S, Fallone BG, Rathee S. Modeling scintillator-photodiodes as detectors for megavoltage CT. Med Phys. 2004;31:1225–34. doi: 10.1118/1.1710733. [DOI] [PubMed] [Google Scholar]
- Monajemi TT, Tu D, Fallone BG, Rathee S. A bench-top megavoltage fan-beam CT using CdWO4-photodiode detectors. II. Image performance evaluation. Med Phys. 2006b;33:1090–100. doi: 10.1118/1.2181291. [DOI] [PubMed] [Google Scholar]
- Morin O, Chen J, Aubin M, Bose S, Gillis A, Bucci M, Pouliot J. Dose Calculation Using Megavoltage Cone Beam CT Imaging. International Journal of Radiation Oncology Biology Physics. 2005;63:S62–S3. doi: 10.1016/j.ijrobp.2006.10.048. [DOI] [PubMed] [Google Scholar]
- Morin O, Gillis A, Chen J, Aubin M, Bucci MK, Roach M, III, Pouliot J. Megavoltage cone-beam CT: system description and clinical applications. Med Dos. 2006;31:51–61. doi: 10.1016/j.meddos.2005.12.009. [DOI] [PubMed] [Google Scholar]
- Mosleh-Shirazi MA, Evans PM, Swindell W, Symonds-Tayler JRN, Webb S, Partridge M. Rapid portal imaging with a high-efficiency, large field-of-view detector. Med Phy. 1998a;25:2333–46. doi: 10.1118/1.598443. [DOI] [PubMed] [Google Scholar]
- Mosleh-Shirazi MA, Swindell W, Evans PM. Optimization of the scintillation detector in a combined 3D megavoltage CT scanner and portal imager. Med Phys. 1998b;25:1880–90. doi: 10.1118/1.598377. [DOI] [PubMed] [Google Scholar]
- Pang G, Rowlands JA. Development of high quantum efficiency, flat panel, thick detectors for megavoltage x-ray imaging: a novel direct-conversion design and its feasibility. Med Phys. 2004;31:3004–16. doi: 10.1118/1.1803771. [DOI] [PubMed] [Google Scholar]
- Peng KC, Lu RS, Ueno K, Wang CH, Wang MZ, Chou FI, Wei YY, Hou WS. Low-dose radiation damage and recovery of undoped BGO crystals. Nuclear Instruments and Methods in Physics Research Section A. 2000;452:252–5. [Google Scholar]
- Pouliot J, Bani-Hashemi A, Chen J, Svatos M, Ghelmansarai F, Mitschke M, Aubin M, Xia P, Morin O, Bucci K, Roach M, 3rd, Hernandez P, Zheng Z, Hristov D, Verhey L. Low-dose megavoltage cone-beam CT for radiation therapy. Int J Radiat Oncol, Biol, Phys. 2005;61:552–60. doi: 10.1016/j.ijrobp.2004.10.011. [DOI] [PubMed] [Google Scholar]
- Rathee S, Tu D, Monajemi TT, Rickey DW, Fallone BG. A bench-top megavoltage fan-beam CT using CdWO4-photodiode detectors. I. System description and detector characterization. Med Phys. 2006;33:1078–89. doi: 10.1118/1.2181290. [DOI] [PubMed] [Google Scholar]
- Sahu SK, Peng KC, Huang HC, Wang CH, Chang YH, Hou WS, Ueno K, Chou FI, Wei YY. Radiation hardness of undoped BGO crystals. Nuclear Instruments and Methods in Physics Research. 1997;A388:144–8. [Google Scholar]
- Saint-Gobain Crystals Product data sheet for scintillation crystal arrays and assemblies. Saint-Gobain Crystals; OH, U.S.: [Google Scholar]
- Samant SS, Gopal A. Study of a prototype high quantum efficiency thick scintillation crystal video-electronic portal imaging device. Med Phys. 2006;33:2783–91. doi: 10.1118/1.2216877. [DOI] [PubMed] [Google Scholar]
- Saw CB, Heron DE, Huq MS, Yue NJ. Target delineation and localization (IGRT)-part 1. Med Dos. 2006;31:1–2. doi: 10.1016/j.meddos.2005.12.001. [DOI] [PubMed] [Google Scholar]
- Sawant A, Antonuk LE, El-Mohri Y, Li Y, Su Z, Wang Y, Yamamoto J, Zhao Q, Du H, Daniel J, Street RA. Segmented phosphors – MEMS-based high quantum efficiency detectors for megavoltage x-ray imaging. Med Phys. 2005;32:553–65. doi: 10.1118/1.1854774. [DOI] [PubMed] [Google Scholar]
- Sawant A, Antonuk LE, El-Mohri Y, Zhao Q, Wang Y, Li Y, Du H, Perna L. Segmented crystalline scintillators: empirical and theoretical investigation of a high quantum efficiency EPID based on an initial engineering prototype CsI(Tl) detector. Medical Physics. 2006;33:1053–66. doi: 10.1118/1.2178452. [DOI] [PubMed] [Google Scholar]
- Seppi EJ, Munro P, Johnsen SW, Shapiro EG, Tognina C, Jones D, Pavkovich JM, Webb C, Mollov I, Partain LD, Colbeth RE. Megavoltage cone-beam computed tomography using a high-efficiency image receptor. Int J Radiat Oncol, Biol, Phys. 2003;55:793–803. doi: 10.1016/s0360-3016(02)04155-x. [DOI] [PubMed] [Google Scholar]
- Sillanpaa J, Chang J, Mageras G, Yorke E, De Arruda F, Rosenzweig K, Munro P, Seppi E, Pavkovich J, Amols H. Low-dose megavoltage cone-beam computed tomography for lung tumors using a high-efficiency image receptor. Med Phys. 2006;33:3489–97. doi: 10.1118/1.2222075. [DOI] [PubMed] [Google Scholar]
- Wang Y, Antonuk LE, El-Mohri Y, Zhao Q. A Monte Carlo investigation of Swank noise for thick, segmented, crystalline scintillating detectors for radiotherapy imaging. Med Phys. 2009a;36:3227–38. doi: 10.1118/1.3125821. [DOI] [PMC free article] [PubMed] [Google Scholar]
- Wang Y, Antonuk LE, El-Mohri Y, Zhao Q, Sawant A, Du H. Monte Carlo investigations of megavoltage cone-beam CT using thick, segmented scintillating detectors for soft tissue visualization. Medical Physics. 2008;35:145–58. doi: 10.1118/1.2818957. [DOI] [PMC free article] [PubMed] [Google Scholar]
- Wang Y, Antonuk LE, Zhao Q, El-Mohri Y, Perna L. High-DQE EPIDs based on thick, segmented BGO and CsI:Tl scintillators: Performance evaluation at extremely low dose. Med Phys. 2009b;36:5707–18. doi: 10.1118/1.3259721. [DOI] [PMC free article] [PubMed] [Google Scholar]
- Wang Y, El-Mohri Y, Antonuk LE, Zhao Q. Monte Carlo investigations of the effect of beam divergence on thick, segmented crystalline scintillators for radiotherapy imaging. Physics in Medicine and Biology. 2010;55:3659–73. doi: 10.1088/0031-9155/55/13/006. [DOI] [PMC free article] [PubMed] [Google Scholar]
- Wei ZY, Zhu RY, Newman H, Yin ZW. Radiation resistance and fluorescence of europium doped BGO crystals. Nuclear Instruments and Methods in Physics Research Section A. 1990;297:163. [Google Scholar]
- Yin FF, Guan H, Lu W. A technique for on-board CT reconstruction using both kilovoltage and megavoltage beam projections for 3D treatment verification. Medical Physics. 2005;32:2819–26. doi: 10.1118/1.1997307. [DOI] [PubMed] [Google Scholar]
- Zhu RY. Radiation damage in scintillating crystals. Nuclear Instruments and Methods in Physics Research Section A. 1998;413:297–311. [Google Scholar]
- Zhu RY, Ma DA, Newman H. Scintillating crystals in a radiation environment. Nuclear Physics B. 1995;44:547–56. [Google Scholar]
- Zhu RY, Stone H, Newman H, Zhou TQ, Tan HR, He CF. A study on radiation damage in doped BGO crystals. Nuclear Instruments and Methods in Physics Research Section A. 1991;302:69–75. [Google Scholar]


