Abstract
Burn injury is a significant and severe representation of critical illness. Nearly, 50% of patients admitted to hospitals for burn injuries have detectable levels of ethanol in their circulations and these patients have poorer clinical outcomes than burned individuals without measurable circulating ethanol. We report here data on a clinically relevant form of hepatic injury, the development of microvesicular steatosis, in a murine model wherein animals were either given ethanol or saline, and were subjected to burn or sham injury. Because better glycemic control with insulin has been shown in clinical studies to impart major clinical benefit, an additional group of burn ethanol animals were treated with insulin. Insulin significantly reduced blood glucose in injured animals to levels no different from those seen in animals that were neither ethanol exposed nor burned. A single intraperitoneal injection of ethanol was insufficient to raise blood alanine aminotransferase (ALT), measured as an index of liver injury. However, burn injury led to significant increases in ALT at 24 and 48 hours, which had returned to preinjury levels by 7 days. This ALT rise was completely prevented with insulin treatment. A single injection of ethanol did not evoke increased microvesicular steatosis but did potentiate the ability of burn to do so at 24 hours after injury. The burn induced increase in microvesicular steatosis was also seen at 48 hours, but had subsided by 7 days. The increased microvesicular steatosis was prevented by insulin therapy. Thus, ethanol potentiates the ability of burn to cause acute liver injury, which is completely preventable by insulin therapy. These findings may have substantial clinical significance and suggest this model may be useful for the study of the mechanisms of hepatic injury as well as the mechanisms, probably multiple, of insulin action in this setting.
Critical illness, including thermal injury, has been well documented to result in increased morbidity and mortality. Burn injury is a significant and severe clinical representation of critical illness, as nearly 50% of the patients admitted to hospitals for burn injuries have detectable levels of ethanol in their circulation.1 These patients suffer from increased mortality and infectious and/or surgical complications in comparison with those patients with burn injury alone.1–3 We have previously shown inflammatory change in the livers of mice after ethanol and/or burn injury. This is of crucial clinical concern as the liver is a central target of insulin action and plays a central regulatory role in inflammation. In these mice, hepatic inflammatory markers including polymorphonuclear infiltration, adhesion molecules, proinflammatory cytokines, and nuclear factor kappa B were all increased by ethanol and/or burn, and these increases were prevented by insulin treatment.4 Insulin has been demonstrated to improve clinical outcomes in critically ill patients, including decreased all-cause mortality, reduced sepsis, dialysis, transfusions, and decreased length of hospital stay.5 Because insulin has substantial antiinflammatory effects, this may underlie its dramatic clinical benefit in critical illness.6,7
Using a well-validated murine burn/ethanol paradigm as a model of critical illness, we tested two hypotheses. First, ethanol administration before burn injury would significantly worsen parameters indicative of the systemic consequences of burn injury.
Second, insulin treatment will prevent or ameliorate the deleterious effects of ethanol and/or burn on liver pathology.
MATERIALS AND METHODS
Animals
Male C57BL/6 (8- to 10-week old) mice were obtained from Harlan Laboratories (Indianapolis, IN) and Jackson Laboratories (Bar Harbor, MA). Mice were housed at Loyola University Medical Center Animal Facility with food and water available ad libitum. Temperature, humidity, and 12-hour light cycles beginning at 7 AM were controlled. All animal studies described were approved by the Loyola University Chicago Animal Care and Use Committee.
Murine Model of Acute Ethanol and Burn Injury
Thirty minutes before burn, mice received an intraperitoneal injection of ethanol (20% vol/vol ethanol/saline) at a dose of 1.2 g/kg or saline vehicle. The ethanol dosage is designed to produce a blood–alcohol concentration of 100 mg/dl at time of injury.8 Mice were then anesthetized with Nembutal (50 mg/kg intraperitoneal), their dorsum shaved and placed in a plastic template that exposes 13 to 15% of their total body surface area to burn or sham injury. The mouse was then immersed in boiling water (94–96°C) for 8 seconds to achieve a full thickness burn.8 Sham injury constituted the same treatment; however, animals were immersed in a room temperature water bath for 8 seconds. Immediately after injury, all animals received warmed saline fluid resuscitation (1 ml intraperitoneal, 37°C) and placed on warming pads to prevent circulatory shock and compensate for fluid loss. Two hours postinjury animals receiving therapeutic treatment were given subcutaneously injected insulin glargine (5 units/kg, 20 μl, Aventis Pharmaceuticals Inc., Bridgewater, NJ).
Determination of Glucose
Glucose levels were tested using blood glucose monitors and strips from Abbott Diabetes Care Inc., Alameda, CA as previously reported.4 Glucose levels were measured 6 hours after burn/sham injury.
Determination of Alanine Aminotransferase
Serum was assayed for alanine aminotransferase (ALT) levels using a commercially available colorimetric assay kit (Biotron Diagnostics Inc., Hemets, CA) as previously described.9
Processing and Evaluation of Liver
The liver tissues were fixed in 10% buffered formalin, embedded in paraffin, and processed routinely. Five micron thick tissue sections were stained with hematoxylin and eosin (H&E) and examined for the presence of necrosis, inflammation, apoptosis, Kupffer cell morphology, hepatic cell mitosis, and steatosis. Slide treatment group identity was blinded before analysis by a pathologist. Fresh liver tissue was embedded in optimal cutting temperature media and allowed to freeze in the cryostat at −21°C. Frozen sections were cut at 6 microns, stained with Oil-Red-O, and then examined for the presence of fat droplets. Briefly, the Oil-Red-O procedure used is as follows. The frozen sections slides were rinsed in isopropyl alcohol and then placed in a filtered working solution of Oil-Red-O for 20 minutes. The slides were then rinsed in isopropyl alcohol, followed by tap water and counterstained with hematoxylin for 1 minute. The slides were then serially rinsed in tap water, ammonia water (lithium carbonate), and finally tap water. The slides were cover slipped using an aqua-mounting media. Typical examples of Oil-Red-O stained liver sections from each of the five experimental groups are shown in Figure 1.
Figure 1.

Liver microvesicular scoring of Oil-Red-O staining. Liver sections showing the degrees of microvesicular steatosis as demonstrated by the presence of positive red staining fat droplets within the hepatocyte cytoplasm. No microvesicular steatosis identified (A). Minimal microvesicular steatosis with rare small focal areas involving periportal areas (B). Mild microvesicular steatosis with multifocal areas involving periportal areas (C). Moderate microvesicular steatosis involving zones periportal or mid-zonal regions and/or with areas of portal to portal bridging microvesicular steatosis (D). Severe microvesicular steatosis with diffuse steatosis involving all zones of the hepatic parenchyma (E). Images are at ×400 and insets are at ×1000.
A portion of liver was preserved in glutaraldehyde and saved for electron microscopic studies. Two cases were chosen for electron microscopy, which included a liver showing microvesicular steatosis and one without any evidence of steatosis by H&E and Oil-Red-O staining. In each case, fresh liver was fixed in phosphate buffered 2.5% glutaraldehyde. In the two cases chosen for electron microscopy, the tissue underwent postfixation in 1% OsO4 (osmium tetroxide) and then was dehydrated in a grade series of ethanol followed by propylene oxide. Next, the tissue was embedded in epoxy resin, (Pol/Bed 812, Polysciences Inc., Warrington, PA). Semithin sections (0.5 microns) were cut and stained in 1% toluidine blue. Thin sections (100 nm) were cut on a diamond knife, stained with uranyl acetate and lead citrate. Specimens were viewed and photographed at 50 KV on a Zeiss EM 900 electron microscope.
Grading of Liver Injury
The numbers of foci of hepatocyte necrosis were counted (with uniform-sized tissue sections on the slide measuring 0.8 × 0.5 cm and at a thickness of 5 microns) and the overall percentage of necrosis was determined and recorded. The number of apoptotic hepatocytes was counted in 10 consecutive high-power fields in three different areas of the tissue. Kupffer cells were labeled as “flat” or “reactive.” Reactive Kupffer cells were identified as having an enlarged triangular appearance. The number of hepatic mitosis per slide was counted. If present, inflammation was recorded. Microvesicular steatosis was identified and graded as: none (grade 1), minimal (grade 2), mild (grade 3), moderate (grade 4), and severe (grade 5) for both the H&E stain and Oil-Red-O stain. Figure 1 illustrates examples of all grades as seen by Oil-Red-O staining. In all cases of grades 2 to 5, identifiable microvesicular steatosis was present on both the H&E stain and Oil-Red-O stain. Conversely, in all cases without microvesicular steatosis (grade 1), no clear droplets were seen on the H&E stain and the Oil-Red-O stain was negative for fat droplets. The hepatic parenchyma was considered to show minimal microvesicular steatosis (grade 1) when only one to two small foci of microvesicular fat were identified. Mild (grade 3) microvesicular steatosis involved easily identifiable regions of the hepatic parenchyma and was limited to a periportal distribution. Moderate (grade 4) microvesicular steatosis involved both periportal and mid-zonal regions of the hepatic parenchyma, whereas severe (grade 5) microvesicular steatosis was diffusely present and involved periportal, mid-zonal, and centrilobular regions of the hepatic parenchyma.
Statistical Analysis
Values reported are means ± SEM. Glucose and ALT data were analyzed by one-way analysis of variance and Tukey-Kramer post-hoc analysis. The microvesicular steatosis scores were analyzed using the Kruskal-Wallis analysis of variance on ranks test.
RESULTS
Serum Glucose Levels
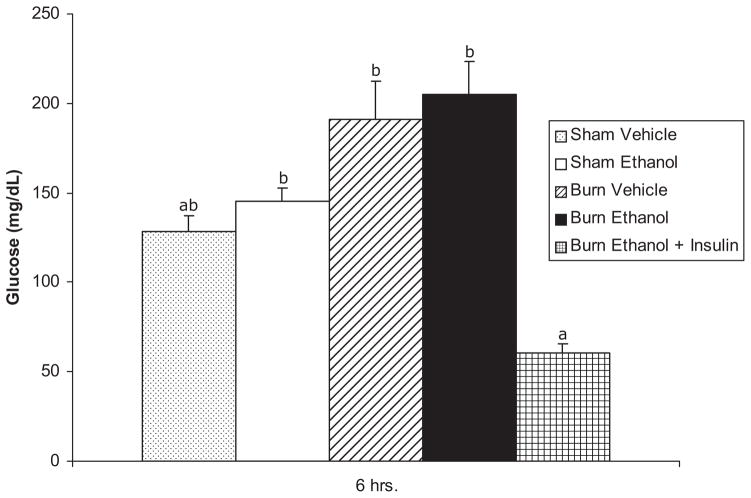
Figure 2 illustrates that burn ethanol-injured animals treated with insulin exhibited glucose levels comparable with and not statistically different from sham/vehicle animals.
Figure 2.
Blood glucose levels. Glucose levels of ethanol treated and/or burn-injured ± insulin-treated mice at 6 hours postinjury. Data are expressed as mean ± SEM. n = 10–20 per group. Data are analyzed by one-way analysis of variance and Tukey-Kramer post-hoc testing for statistical significance. P < .05 for groups not sharing a letter.
Serum Alanine Aminotransferase Levels
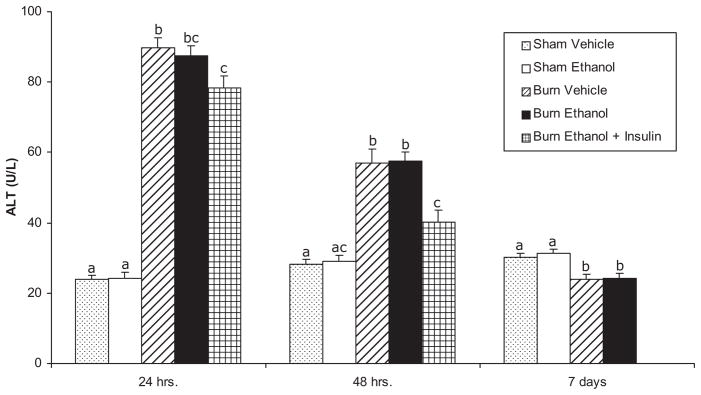
As a chemical index of liver injury, serum ALT was measured (Figure 3). The single intraperitoneal administration of ethanol was insufficient to increase serum ALT. However, the burn vehicle animals had sharp, approximately 4-fold increases in ALT at 24 hours after burn, the first time point measured. This remained significantly elevated, at about three times the level seen in sham vehicle mice at 48 hours, but returned to sham vehicle levels by 7 days. Ethanol did not augment the effect of burn as the ALT concentrations and pattern of change in burn ethanol animals was no different from that seen in the burn vehicle group. Finally, the administration of insulin significantly decreased ALT concentrations compared with burn vehicle mice at 24 hours and compared with burn vehicle and burn ethanol animals at 48 hours.
Figure 3.
Alanine aminotransferase (ALT) levels in serum of ethanol-treated and/or burn-injured mice 24, 48 hours, and 7 days postinjury. Data are expressed as mean ± SEM. n = 5–14 per group. Data are analyzed by one-way analysis of variance and Tukey-Kramer post-hoc testing for statistical significance. At each time point, P < .05 for groups not sharing a letter.
Hepatic Microsteatosis
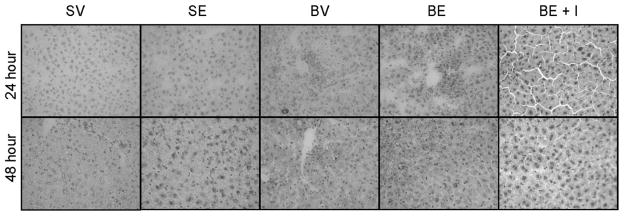
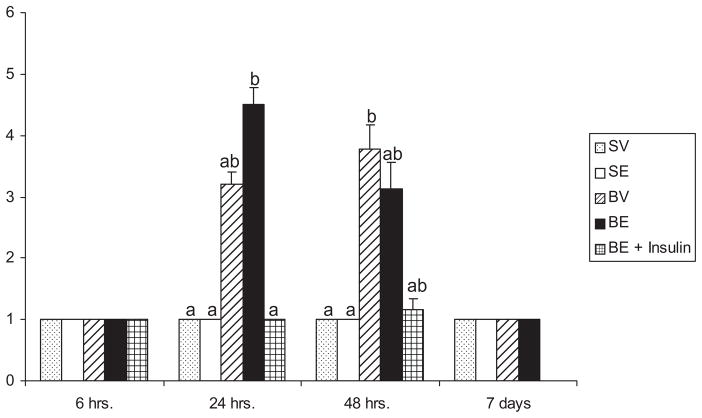
Examples of the histologic appearance of livers from which microvesicular steatosis scores were derived are shown in Figures 4 and 5. Actual microvesicular steatosis scores are shown in Figure 6. Just as the single ethanol administration had no effect on serum ALT, similarly this manipulation did not induce increased microvesicular steatosis. However, there was a substantial, though not statistically significant, trend toward increased microvesicular steatosis scores caused by burn injury that began sometime between 6 and 24 hours after the insult. This was sustained at 48 hours and, at this time point, the microvesicular steatosis scores were significantly higher than those seen in sham vehicle or sham ethanol mice. The effect waned by 7 days. Although, ethanol alone did not cause microsteatosis to develop, it appeared to augment the lipid infiltration caused by burn at 24 hours. Specifically, though burn alone did not cause significantly increased microvesicular steatosis scores at 24 hours after injury, the combined insults of burn and ethanol did. This phenomenon was no longer seen at 48 hours. Insulin administration completely prevented the development of microvesicular steatosis at 24 hours and there was a strong trend toward the same effect at 48 hours, though it did not reach statistical significance.
Figure 4.
Microvesicular steatosis. Comparison of Oil-Red-O stained liver sections from sham vehicle, sham ethanol, burn vehicle, burn ethanol, and burn ethanol + insulin mice at 24 and 48 hours postinjury (×400).
Figure 5.
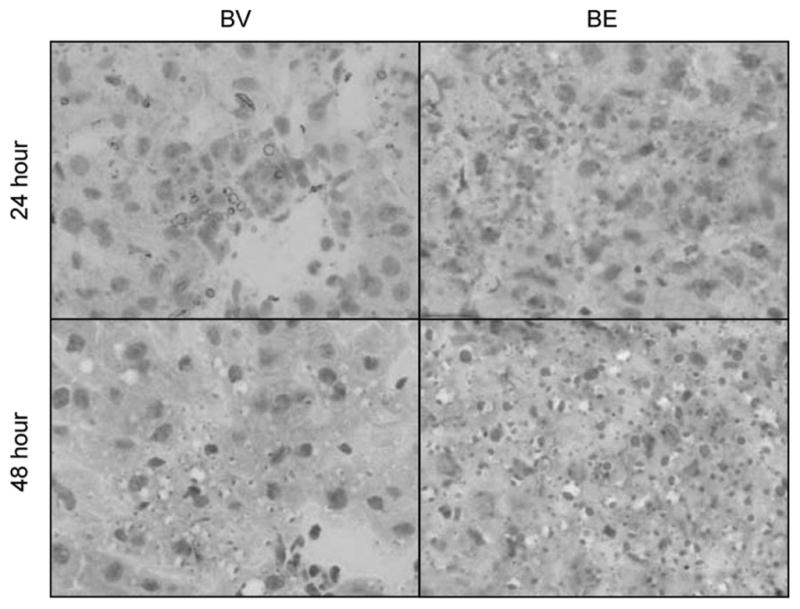
Microvesicular steatosis. Oil-Red-O stained liver sections from burn vehicle and burn ethanol mice at 24 and 48 hours postinjury (×1000).
Figure 6.
Microvesicular steatosis severity score of burn-injured mice 24 and 48 hours postinjury. Sections of liver were stained with Oil-Red-O and analyzed for microvesicular steatosis. Data are expressed as mean ± SEM. n = 3–15 per group. Data are analyzed by Kruskal-Wallis analysis of variance (ANOVA) on ranks and post-hoc testing for statistical significance. At each time point, P < .05 for groups not sharing a letter.
The initial H&E findings prompted further investigation with Oil-Red-O stains and electron microscopy. Electron microscopy was performed on livers that appeared normal and those that had the severest of injury on Oil-Red-O staining based the presence of obvious fat droplets presumed to be microvesicular steatosis. These livers were chosen by the pathologist (S.Y.), who was blinded, and wished to establish that the “clear droplets” seen on H&E stains was indeed microvesicular fat. Figure 7 is an electron micrograph of a representative liver taken from a mouse treated with ethanol and subsequent burn injury but not treated with insulin. This ultrastructural study demonstrated the presence of small lipid droplets within the cytoplasm of the hepatocytes. The ultrastructural presence of small lipid droplets confirmed the positive staining seen on Oil-Red-O staining and identified the small clear cytoplasmic vacuoles seen on the H&E stains. The hepatocyte mitochondria showed no ultrastructural aberrations.
Figure 7.
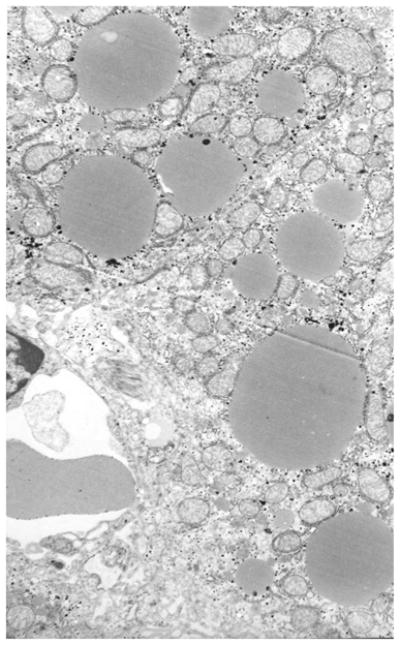
Small lipid droplets are seen in the cytoplasm of the heptocytes measuring 1 to 2 microns and confirming the presence of fat droplets as seen in the Oil-Red-O stains.
DISCUSSION
We report here, in a murine model of critical illness, that the rapid development of fatty infiltration of the liver in burn-injured mice was potentiated by ethanol treatment and was robustly prevented by insulin treatment. This model consists of two insults, ethanol administration, and subsequent burn injury. Nearly, 50% of the patients admitted to hospitals for burn injuries have detectable levels of ethanol in their circulation.10,11 Ethanol seems to be a causal factor in the burn injury and appears to substantially worsen the clinical course.1,3,10,11 Thus, our model of ethanol and burn is relevant and clinically there seems to be an interaction between ethanol and burn injury. In this initial report, antecedent ethanol administration did appear to augment the severity of hepatic fatty infiltration caused by burn. This is extremely relevant in light of the clinical observation (earlier) that patients with burn injury who have measurable amounts of ethanol in their circulations have poorer clinical outcomes than those without circulating ethanol.
In a recent clinical autopsy report, 81% (30 of 37) of pediatric burn patients had fatty infiltration of the liver, occurring in the total absence of parenteral nutrition.12 The onset of the process in these patients was rapid, seen as soon as 1 day after burn, just as in our model. Early on, there was microvacuolar infiltration just as in the animal model. Later on, this seemed to progress to macrovacuolar, so it will be interesting to see, in future time course studies, whether or not the same progression occurs in the animals.
To understand the possible pathophysiology of this remarkably rapid and extensive development of hepatic fat infiltration, it is relevant to examine what is known about the development of steatosis in the noncritical illness setting.13–15 For fatty liver to develop, a large variety of molecular and pathophysiologic adjustments occur, usually in the setting of insulin resistance. The stress of illness may increase insulin resistance. Briefly, fat accumulation in the liver results because of accelerated breakdown of visceral adipocyte triglyceride to free fatty acids. This is a manifestation of insulin resistance because the usual effect of insulin at the adipocyte is to cause incorporation of free fatty acids into triglyceride. These free fatty acids enter the portal circulation and are delivered to the hepatocyte. There, the free fatty acids are both 1) reesterified to triglycerides and incorporated into very low-density lipoprotein particles for secretion or accumulation in liver cells and 2) oxidized to generate ATP. Further liver damage that may lead to steatohepatitis or cirrhosis occurs because the lipid-laden liver cells may be more vulnerable to damage from oxidative stress and/or inflammation. The genesis of advanced liver disease is, therefore, generally conceived of as being due to two “hits”: triglyceride accumulation and then damage to these vulnerable cells by oxidative stress or inflammation. In this view, the development of fatty liver is central and essential to progression to more advanced and severe liver disease. It follows that reduction of this lipid accumulation would be protective to the liver and to the whole organism. Unlike what has been reported in other causes of microvesicular steatosis, such as Reye’s syndrome, the mitochondria in our experimental model do not show any apparent morphologic ultrastructural alterations. These mitochondria have an average diameter of 1 to 2 microns, which is also the diameter of most of the lipid droplets.16,17
In this initial report, treatment with insulin led to a rather remarkable protection of the liver from fatty infiltration. It is not possible in this model to dissect the effects of the insulin molecule itself from its many physiologic effects on carbohydrate, lipid, and protein metabolism as well as its antiinflammatory effects. We would speculate that at least part of insulin’s effect in this model is due to its well-known ability to reduce free fatty acids. The potential multiple sites of insulin benefit in this model should be addressed in future studies.13 In this light, it is worth emphasizing that insulin treatment has shown dramatic benefit in improving outcomes in critically ill patients.5,18
Acknowledgments
We thank Dr. Raoul Fresco for his invaluable assistance in the preparation and interpretation of the electron micrographs and Luis Ramirez for assistance with burn injury procedures.
Supported by NIAAA grant AA 012034 and AA 013527 (E.J.K.), the Ralph and Marian C Falk Medical Research Trust, and the Illinois Excellence in Biomedical Medicine Grant.
References
- 1.McGill V, Kowal-Vern A, Fisher SG, Kahn S, Gamelli RL. The impact of substance use on mortality and morbidity from thermal injury. J Trauma. 1995;38:931–4. doi: 10.1097/00005373-199506000-00019. [DOI] [PubMed] [Google Scholar]
- 2.Nelson S, Kolls JK. Alcohol, host defense and society. Nat Rev Immuno. 2002;2:205. doi: 10.1038/nri744. [DOI] [PubMed] [Google Scholar]
- 3.Kowal-Vern A, Walenga JM, Hoppensteadt D, Sharp-Pucci M, Gamelli RL. Interleukin-2 and interleukin-6 in relation to burn wound size in the acute phase of thermal injury. J Am Coll Surg. 1994;178:357–62. [PubMed] [Google Scholar]
- 4.Emanuele M, Emanuele N, Gamelli R, Kovacs E, Lapaglia N. Effects of insulin on hepatic inflammation induced by ethanol and burn injury in a murine model of critical illness. J Burn Care Res. 2007;28:490–9. doi: 10.1097/BCR.0B013E318053DAED. [DOI] [PubMed] [Google Scholar]
- 5.Van den Berghe G, Wouters P, Weekers F, et al. Intensive insulin therapy in critically ill patients. N Eng J Med. 2001;8:183–92. doi: 10.1056/NEJMoa011300. [DOI] [PubMed] [Google Scholar]
- 6.Dandona P, Aljada A, Mohanty P. The anti-inflammatory and potential anti-atherogenic effect of insulin: a new paradigm. Diabetologia. 2002;45:924–30. doi: 10.1007/s00125-001-0766-5. [DOI] [PubMed] [Google Scholar]
- 7.Fonseca VA. The effects of insulin on the endothelium. Endocrinol Metab Clin North Am. 2007;2(Suppl):20–6. doi: 10.1016/s0889-8529(07)80009-0. [DOI] [PubMed] [Google Scholar]
- 8.Faunce D, Gregory M, Kovacs E. Effects of acute ethanol exposure on cellular immune responses in a murine model of thermal injury. J Leukoc Biol. 1997;62:733–40. doi: 10.1002/jlb.62.6.733. [DOI] [PubMed] [Google Scholar]
- 9.Gomez CR, Nomellini V, Baila H, Oshima K, Kovacs EJ. Effects of aging and interleukin-6 on hepatic injury after systemic inflammation in response to lipopolysaccharide. Shock. 2009;31:178–84. doi: 10.1097/SHK.0b013e318180feb8. [DOI] [PMC free article] [PubMed] [Google Scholar]
- 10.Messingham KA, Faunce DE, Kovacs EJ. Alcohol, injury, and cellular immunity. Alcohol. 2002;2:137–49. doi: 10.1016/s0741-8329(02)00278-1. [DOI] [PubMed] [Google Scholar]
- 11.Choudhry MA, Chaudry IH. Alcohol intoxication and post-burn complications. Front Biosci. 2006;11:998–1005. doi: 10.2741/1857. [DOI] [PubMed] [Google Scholar]
- 12.Barret J, Jeschke M, Herndon D. Fatty infiltration of the liver in severely burned pediatric patients: autopsy findings and clinical implications. J Trauma. 2001;51:736–9. doi: 10.1097/00005373-200110000-00019. [DOI] [PubMed] [Google Scholar]
- 13.Browning J, Horton J. Molecular mediators of hepatic steatosis and liver injury. J Clin Investig. 2004;114:147–52. doi: 10.1172/JCI22422. [DOI] [PMC free article] [PubMed] [Google Scholar]
- 14.Diehl A, Li Z, Lin H, Yang S. Cytokines and the pathogenesis of non-alcoholic steatohepatitis. Gut. 2005;54:303–6. doi: 10.1136/gut.2003.024935. [DOI] [PMC free article] [PubMed] [Google Scholar]
- 15.McCullough A. Pathophysiology of nonalcoholic steatohepatitis. J Clin Gastroenterol. 2006;40:S17–29. doi: 10.1097/01.mcg.0000168645.86658.22. [DOI] [PubMed] [Google Scholar]
- 16.MacSween R, Burst A, Portman B, Ishak K, Scheuer P, Anthony P. Pathology of the liver. 4. Toronto: Churchill Livingstone; 2002. p. 134. [Google Scholar]
- 17.Daughtery CC, Gartside PS, Heubi JE, Saalfeld K, Synder J. A morphometric study of Reye’s syndrome. Correlation of reduced mitochondrial numbers and increased mitochondrial size with clinical manifestations. Am J Pathol. 1987;129:313–26. [PMC free article] [PubMed] [Google Scholar]
- 18.Malmberg K DIGAMI Study Group. Prospective randomized study of intensive insulin treatment on long term survival after acute myocardial infarction in patients with diabetes mellitus. BMJ. 1997;314:1512–5. doi: 10.1136/bmj.314.7093.1512. [DOI] [PMC free article] [PubMed] [Google Scholar]


