

Abstract
Epidermal growth factor receptors (EGFRs) and their cytoplasmic tyrosine kinases play important roles in cell proliferation and signaling. EGFR extracellular domain (sEGFR) forms a dimer upon the binding of ligands, such as epidermal growth factor (EGF) and transforming growth factor α (TGFα). In this study, multiple molecular dynamics (MD) simulations of the 2:2 EGF:sEGFR3–512 dimer and the 2:2 TGFα:sEGFR3–512 dimer were performed in solvent and crystal environments. The simulations of systems comprising up to half a million atoms reveal part of the structural dynamics that sEGFR dimers are capable of. The solvent simulations consistently exhibited a prominent conformational relaxation from the initial crystal structures on the nanosecond time scale, leading to a symmetry breaking and more extensive contacts between the two sEGFR monomers. In the crystal control simulation, this symmetry breaking and compaction was largely suppressed by crystal packing contacts. The simulations also provided evidence that the disordered domain IV of sEGFR may act as a stabilizing spacer in the dimer. Thus the simulations suggest that the sEGFR dimer can take diverse configurations in solvent environments. These biologically relevant conformations of the EGFR signal transduction network can be controlled by contacts among the structural domains of sEGFR and its ligands.
Keywords: epidermal growth factor, transforming growth factor α, receptor, dimer, crystal packing, buttressing, spacer
The epidermal growth factor receptor (EGFR) system has been studied with increasing interest for more than thirty years. Signal transduction by the EGFR family is associated with various forms of cancer, which makes it an excellent therapeutic target [1, 2]. The EGFR family of receptor tyrosine kinase (RTK) consists of four members: EGFR (HER1/ErbB1), ErbB2 (Neu/HER2), ErbB3 (HER3), and ErbB4 (HER4) [3]. They can be activated by a dozen potential ligands [4, 5].
The human EGFR (1186 residues) is one of the members of this family [6]. Similar to other RTKs, it comprises five regions: an extracellular ligand binding region (residues 1–620), a transmembrane domain (residues 621–643), an intracellular juxtamembrane region (residues 644–685), a tyrosine kinase domain (residues 686–953), and a C-terminal regulatory region (residues 954–1186) [3]. The extracellular region consists of four subregions (Fig. 1a): I (residues 1–165), II (residues 166–310), III (residues 311–480), and IV (residues 481–620) [7, 8]. Domains I and III are the homologous ligand binding domains (37% sequence identity); whereas domains II and IV are homologous cysteine-rich domains [9]. The human EGFR is activated by EGF-family ligand proteins, such as human EGF and transforming growth factor α (TGFα) [5].
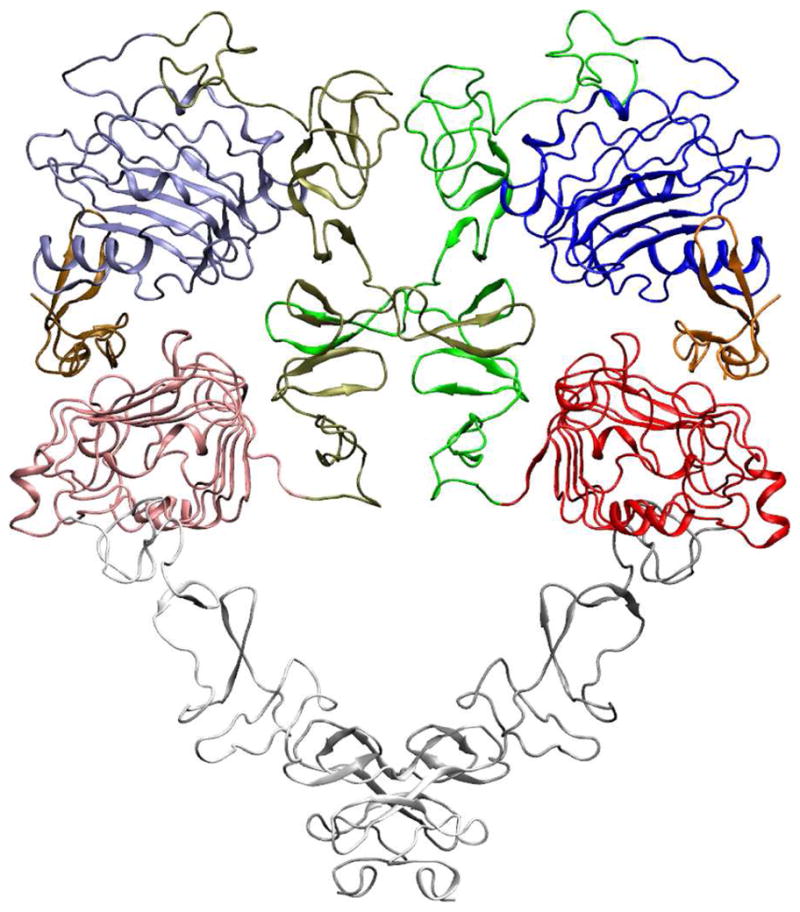
Figure 1.

Start structures used for the MD simulations. (a) The 2:2 EGF:sEGFR complex (PDB entry 1IVO). Domains I–IV and the EGF ligands (in different colors) are labeled. (b) The crystal unit cell of the 2:2 EGF:sEGFR complex with space group P3121. (c) The 2:2 TGFα:sEGFR complex (based on PDB entry 1MOX, see Methods section). Domains I–IV are colored as in (a) and the TGFα ligands are labeled. All molecular graphics Figures in this work were created by VMD [38].
EGF induces dimerization of EGFR by binding to the extracellular region of the receptor to form a 2:2 EGF:EGFR complex [10, 11]. This event causes the autophosphorylation of the cytoplasmic tyrosine kinase, which in turn activates a complex network of downstream signaling pathways that regulate cell proliferation and differentiation [12, 13]. In 2002, two essential structures at the heart of this mechanism were solved [14, 15] that confirmed the so-called receptor-mediated model of dimerization [3]. In this model, each ligand can only bind to one EGFR inducing a conformational change that promotes the dimerization [11]. Both structures contain the soluble extracellular region of EGFR (sEGFR). One is a 2:2 EGF:sEGFR complex (solved at 3.3 Å resolution), in which the sEGFR comprises residues 3–512 [15]. The other is a 2:2 TGFα:sEGFR complex (solved at 2.5 Å resolution), in which the sEGFR is truncated (residues 1–501) [14]. The (EGF or TGFα) ligand binding sites are located between domains I and III (Fig. 1a) and are distant from the dimer interface. The dimer contacts are mediated by sEGFR domain II, particularly by a β-hairpin referred to as the dimerization arm [16].
Based on the known experimental structures of sEGFR, it was proposed that sEGFR could exist in a dynamic equilibrium and sample multiple conformational states [17]. An unliganded sEGFR is in a tethered configuration in which the dimerization arm is buried [18, 19]. Binding of the ligand between domains I and III would bring the two domains closer and expose the dimerization arm in domain II (to create an extended sEGFR) [20, 21]. Domain II establishes contacts with domain II in another extended sEGFR, forming the dimer [22]. This conformational change from the tethered to the extended sEGFR upon ligand binding would require a large rigid body movement of domains I and II (130° rotation plus 2 nm translation) [3], establishing a possible second dimerization contact between the two domain IVs in the Ferguson model of the sEGFR dimer (Fig. 2). Little is known about domain IV in the dimer as it was incomplete or missing in the crystal structures. The structural experiments [21] did not reveal atomic details of the mechanism.
Figure 2.
Ferguson model of the sEGFR dimer with a hypothetical domain IV structure. An 130° rotation plus 2 nm translation is required to bring domain I from its position in the tethered structure [20] to its proposed location in the dimer [3]. Domain IV maintains the same domain III/IV relationship as in the tethered structure. Domains I, II, and III are from PDB entry 1IVO and are shown in the same orientation as in Fig. 1a,c.
Computer simulation techniques, such as molecular dynamics (MD) simulations, can reveal functional dynamics of proteins at the atomic level [23, 24]. In this work, we investigated the structure and dynamics of 2:2 sEGFR-ligand dimers by MD simulations. With the available computational power, a typical MD simulation of a system comprising of several hundreds of thousands of atoms could possibly be carried out in nanosecond or, at best, microsecond timescales [25, 26]. The extensive conformational transition of sEGFR from the tethered to the extended structure is not accessible by standard MD, so we did not simulate this transition directly in this work. Instead we performed multiple MD simulations, starting with the crystal structures of 2:2 EGF:sEGFR [15] and 2:2 TGFα:sEGFR [14] dimer complexes in different environments. There is a growing evidence that supports the notion that the intrinsic dynamics of proteins may play an important role in determining the conformational changes induced by ligands [27]. Therefore it is meaningful to perform limited MD simulations of sEGFR dimers in the ligand-bound state. The observed polymorphism and dynamical modes of motion provide insights into the general structural variability of the system.
This paper is organized as follows. The Methods section introduces the techniques used in this work, in particular the MD protocols used for 2:2 EGF:sEGFR (in solvent and in crystal) and for 2:2 TGFα:sEGFR (in solvent). The polymorphism of sEGFR configurations was explored by principal component analysis. As described in the Results and Discussion section, our first simulation of 2:2 EGF:sEGFR in solvent revealed a fast relaxation from the initial crystal structure resulting in a significant compaction of the system. The apparent instability of the crystal structure was unexpected and we subsequently carried out a number of control simulations to better understand the origin of this instability, and to rule out the effects of modeling and of biophysical structure determination. We also report detailed time-resolved changes related to symmetry breaking of the dimer interface. The Conclusion section summarizes how the results of this investigation provide a consistent and biologically relevant explanation for the observed changes.
Methods
2:2 EGF:sEGFR Solvent Simulations
The crystal structure of a 2:2 complex of human EGF and sEGFR (PDB entry 1IVO), with a resolution of 3.3 Å, was used as the starting structure [15]. The majority of domain IV was missing since it was not well ordered to give interpretable electron density. In the simulated system (Fig. 1a), we included 47 residues (5–51) of the two EGF molecules and 510 residues (3–512) of the two sEGFR molecules (domains I–III and a small part of domain IV).
The standard MD simulation was performed with a parallel implementation of the GROMACS package (Version 3.3.1) [28, 29], using a GROMOS-96 force field (43a1) with a united-atom model [30]. The proteins (with 79 water molecules at crystallographic sites) were placed in a rectangular box. The minimal distance between the solute and the box boundary was 1.2 nm. The box was then filled with SPC water molecules from an equilibrated cubic box containing 216 water molecules [31]. The system, protein, and water were energy-minimized using the steepest descent method, until the maximum force on the atoms was less than 1000 kJ mol−1 nm−1. To compensate for the net negative charges on the protein, two Na+ ions were added by replacing water molecules with the most favorable electrostatic potential. The system (protein, two ions, and 53,281 water molecules, with 170,909 atoms in total) was energy minimized again using the conjugate gradient algorithm with a force tolerance of 200 kJ mol−1 nm−1 and a steepest descent step was done every 100 steps to make the minimization more efficient [32]. After energy minimization, two positional-restraint simulations (force constant 1000 kJ mol−1 nm−2) were performed (100 ps each) with different initial velocities (generated according to a Maxwell distribution at 310 K with different random seeds). Two separate production runs (12 ns each) at 310 K were carried out to sample the conformational space.
The Verlet integration scheme (with a 2 fs time-step) [33] and an isothermal-isobaric simulation algorithm [34] were used. The three groups (protein, ions, and solvent) were coupled separately to a temperature bath of 310 K, with a relaxation time of 0.1 ps. The pressure was adjusted to 1 bar with a relaxation time of 0.5 ps, and the compressibility was 4.5×10⁻⁵ bar−1. Covalent bonds in the protein were constrained using the LINCS algorithm [35]. A twin-range cutoff was used for the van der Waals interactions: interactions within 0.9 nm were updated every step, while those within 1.4 nm were updated every 5 steps, together with the pair list. The long-range electrostatic interactions were treated by the PME algorithm [36], with a tolerance of 10−5 and an interpolation order of 4.
2:2 EGF:sEGFR Crystal Simulation
The native crystal of the EGF:sEGFR complex belongs to the space group P3121, which has the following unit cell parameters: a = b = 22.016 nm, c = 11.312 nm, and α =β = 90°, γ = 120°. The unit cell of a P3121 crystal contains six symmetry-related molecules (Fig. 1b), which were obtained by applying the P3121 transformation using SwissPDBViewer [37].
The simulation was performed with the GROMACS package [28, 29] as before, using the same force field as in the solvent simulations. The same parameters as in the solvent simulations were used here, except for those mentioned below. The six EGF:EGFR complexes (including 474 crystal waters) were placed into a triclinic box that was the exact size of the unit cell, and hydrated by SPC waters. After a first energy minimization using the steepest descent method, twelve Na+ ions were added to compensate for the net negative charges of the system. After the second energy minimization using the conjugate gradient method, a 100 ps MD simulation with positional restraints was performed under a NPT condition. Since the crystals were grown at 293 K, the initial velocities were generated at this temperature. After the 100 ps NPT simulation, the box size was changed back to the original size of the unit cell, and water molecules were added or removed accordingly. The above energy minimization and NPT simulation with positional restraints were repeated until the box was equilibrated at its original unit-cell size. The final system consists of 447,366 atoms in total (six subunits of the 2:2 EGF:sEGFR complex, twelve Na+ ions, and 126,990 water molecules). A production NVT run at 293 K was performed for 12 ns.
2:2 TGFα:sEGFR Solvent Simulations
A crystal structure of the 2:2 TGFα:sEGFR complex, at a 2.5 Å resolution (PDB entry 1MOX), was used as the starting structure [14]. There were only two truncated sEGFR molecules (residues 1–501) in the PDB file. To compare with the EGF:EGFR complex, the first two residues were removed in sEGFR, and the residues 502–512 were grafted from the 2:2 EGF:sEGFR complex to be consistent among the simulations. Missing residues were added from the 2:2 EGF:sEGFR complex, and the missing side-chain atoms were placed by SwissPDBViewer [37]. Therefore, the sEGFR atoms in the simulated 2:2 TGFα :sEGFR complex were the same as those in the 2:2 EGF:sEGFR complex (residues 3–512). 48 residues (3–50) from the two TGFα molecules were included in the simulation (Fig. 1c).
The 2:2 TGFα:sEGFR complex was simulated only in the solvent environment, and the force field and parameters were the same as those in the solvent simulations of the 2:2 EGF:sEGFR complex. The system was comprised of 160,447 atoms in total (protein and 49,807 water molecules). Two independent production runs (12 ns each) at 310 K were performed, which was similar to 2:2 EGF:sEGFR.
Principal Component Analysis
All MD trajectory analysis in this work was carried out with the tools in the GROMACS package [28, 29] and with VMD [38]. Most of the techniques are self-explanatory but it is worth mentioning Principal Component Analysis (PCA) in more detail.
PCA is a statistical method that can be used to analyze a MD trajectory to extract large-amplitude collective motions of the protein out of its small, random internal motions [39, 40]. Technically, a covariance matrix of internal atomic fluctuations is built from the MD trajectory after eliminating the overall translational and rotational motion of the protein. The covariance matrix is then diagonalized to yield eigenvectors and eigenvalues. An eigenvector represents a dynamical mode of motion in the protein (PCA mode) and the corresponding eigenvalue is the amplitude of fluctuation along this mode. Generally only the first few PCA modes with the largest fluctuations dominate the major protein dynamics, defining a so-called essential subspace [41]. The fluctuations in the essential subspace, referred to as essential dynamics, may describe functionally important protein dynamics.
To illustrate the dynamics observed along individual PCA modes, it is customary to project the MD trajectory along the modes. By projecting the MD trajectory along the first two principal components, one can embed the high-dimensional conformational space linearly within the 2D subspace of the largest positional fluctuations. This 2D embedding reveals how the system explores its conformational space during the MD simulation. It also reveals how the system populates conformational states and transits between them. If specific modes are sufficiently well-sampled, the 1D projections along individual modes exhibit relaxation times that are shorter than the simulation length, and the corresponding autocorrelation function decays to (near) zero [42, 43]. Therefore, 1D projections along PCA modes and their autocorrelation function can reveal whether the MD simulation is long enough for sampling the specific modes.
Results and Discussion
Figure 3 illustrates the 2D embedding of all trajectories afforded by PCA. After concatenating the trajectories (uc1-uc6, EGF-S1, and EGF-S2 for the 2:2 EGF:sEGFR complex, TGFα-S1 and TGFα-S2 for the 2:2 TGFα:sEGFR complex, 120 ns in total), PCA was performed on the combined meta-trajectory, and the PCA modes with the largest amplitudes were investigated. The embedding in a 2D essential subspace in Figure 3 provides a general “roadmap” of the observed structural variability.
Figure 3.

Projections of sEGFR dimer trajectories onto a 2D subspace spanned by the first two PCA modes. The Cα atoms of domains I–III of the sEGFR dimer were used to perform PCA on the combined meta-trajectory. The initial structure of the 2:2 EGF:sEGFR complex is marked by a red up-triangle. The six subunits of the crystal simulation (uc1 to uc6) are colored black, and their final structures are marked by orange down-triangles. The trajectories EGF-S1 and EGF-S2 are colored red, and their final structures are marked by blue down-triangles. The initial structure of the 2:2 TGFα:sEGFR complex is marked by a green up-triangle. The trajectories TGFα-S1 and TGFα-S2 are colored green, and their final structures are marked by magenta down-triangles.
The first two PCA modes with the largest amplitudes contributed about 54% fluctuation of the meta-trajectory. All observed and simulated conformations were projected onto this 2D plane (Fig. 3). The sampled regions of conformational space are well-separated and the plot shows that the configurations and different trajectories of the sEGFR dimer span a large range of the essential subspace. It is worth noting that the sign of modes 1 and 2 was chosen such that a positive direction corresponds to higher radius of gyration (Rg). In other words, the systems were less compact in the direction of the diagonal. The Figure demonstrates that all solvent simulations exhibit a significant compaction of the system (despite the ligand-dependent differences in initial conformation), whereas crystal subunits (with the exception of uc3) remain close to the initial structure. The Figure contains many more details that we will use to explain the following descriptions of the individual trajectories.
Solvent simulations of the 2:2 EGF:sEGFR complex
Historically, trajectory EGF-S1 was the first simulation carried out in this work. To test the reproducibility of the result, a second independent simulation, EGF-S2, was performed after the discovery of the significant compaction (Fig. 3). The conformational changes were evaluated by root mean square deviations (RMSD) from the initial structure. Due to the incomplete and disordered domain IV, only domains I–III (residues 3–480) were used to calculate the RMSD. The two independent simulations, EGF-S1 and EGF-S2, both exhibit a large conformational change with about 0.6 nm RMSD from the initial structure (Table 1). To quantify the compaction, the radius of gyration (Rg) of the sEGFR dimer (domains I–III) was also calculated for each trajectory of the 2:2 EGF:sEGFR complex. The initial structure had a Rg of 3.70 nm, which decreased to 3.43 nm in EGF-S1 and 3.39 nm in EGF-S2, respectively (Table 2). Comparing the initial and the final structures of EGF-S2 in Figure 4a,d, the compaction is very prominent and involves large displacements between 0.34 and 1.09 nm for domains I, III, and the ligand. The surprisingly large conformational changes in the solvent simulations called for additional control simulations to better explore the origin of the observed compaction.
Table 1.
Average RMSD values (in nm) of the sEGFR dimer in different simulation systems.
| EGF-SOLa | EGF-CRYb | TGFα-SOLc | |||
|---|---|---|---|---|---|
| EGF-S1 | 0.55d (0.03e) | uc1 | 0.35 (0.01) | TGFα-S1 | 0.62 (0.05) |
| EGF-S2 | 0.65 (0.06) | uc2 | 0.39 (0.01) | TGFα-S2 | 0.41 (0.02) |
| uc3 | 0.41 (0.01) | ||||
| uc4 | 0.35 (0.01) | ||||
| uc5 | 0.36 (0.01) | ||||
| uc6 | 0.44 (0.01) | ||||
Solvent MD simulations of the 2:2 EGF:sEGFR complex - two independent simulations (EGF-S1 and EGF-S2) were performed;
Crystal MD simulation of the 2:2 EGF:sEGFR complex, which has six subunits (referred to as uc1-uc6) in the unit cell;
Solvent MD simulations of the 2:2 TGFα:sEGFR complex - two independent simulations (TGFα-S1 and TGFα-S2) were performed;
The average RMSD value was calculated from the last 2 ns of each trajectory;
Standard deviation. Only domains I-III in the sEGFR dimer were used to compute the RMSD.
Table 2.
Average radius of gyration (Rg, in nm) of the sEGFR dimer in different simulation systems.
| EGF-SOL | EGF-CRY | TGFα-SOL | |||
|---|---|---|---|---|---|
| EGF-S1 | 3.43a (0.01b) | uc1 | 3.50 (0.01) | TGFα-S1 | 3.46 (0.02) |
| EGF-S2 | 3.39 (0.02) | uc2 | 3.54 (0.01) | TGFα-S2 | 3.51 (0.02) |
| uc3 | 3.45 (0.01) | ||||
| uc4 | 3.59 (0.01) | ||||
| uc5 | 3.55 (0.01) | ||||
| uc6 | 3.51 (0.01) | ||||
The average Rg was calculated from the last 2 ns trajectory in each simulation;
Standard deviation. Only domains I–III in the sEGFR dimer were used to compute Rg.
Figure 4.

Conformational changes observed in the MD simulations of the 2:2 EGF:sEGFR complex. (a and d) The initial and final structures of trajectory EGF-S2. (b and e) The initial and final structures of one subunit (uc1) in the crystal simulation. (c and f) The initial and final structures of trajectory TGFα-S1. Panels (a–c) show a ribbon representation of the structures: the domains are colored in the same manner as in Fig. 1, the initial structure is transparent, and the final one is solid. Panels (d–f) show a non-photorealistic rendering of the molecular surfaces of domains I–III and the ligands: a layer blend shows the initial structure at 34% and the final structure at 66% transparency, and the center of mass locations of domains I, III, and ligands are marked by spheres, with displacements labelled in nm units. The structures are superimposed by domains I–III of the sEGFR dimer.
Crystal simulations of the 2:2 EGF:sEGFR complex
One possible explanation for the instability of the 2:2 EGF:sEGFR crystal structure was the absence of crystal packing constraints when placed into solvent. To test this hypothesis, we simulated an entire crystallographic unit cell with periodic boundaries reflecting the symmetry space group (see Methods and Fig. 1b). Indeed, the PCA embedding (Fig. 3) illustrates that (with the exception of subunit uc3) the crystal subunits exhibit a markedly different behavior than the solvent simulations with EGF ligand. Five of the six subunits remain very close to the initial structure. RMSD analysis (Table 1) confirms that average RMSD values (≈ 0.4 nm) and standard deviations are significantly lower for the crystal subunits compared to the solvent simulations. As one would expect in the presence of crystal packing [44, 45, 46], the system exhibits both smaller deviations from the start structure and smaller fluctuations. Comparing the initial and the final structures of uc1 in Figure 4e, one observes only a very minor compaction of domains I and III (between 0.13 and 0.34 nm displacements), whereas the ligand appears to be more flexible (0.4 nm displacement).
The Rg analysis (Table 2) reveals that crystal packing does not fully restrain the crystal subunits. The Rg for five out of six subunits ranges from 3.50–3.59 nm, except for the uc3 outlier, which has a final Rg of 3.45 nm (Table 2). These values occupy an intermediate range between the Rg of the initial structure (3.70 nm) and the Rg of the solvent simulations (3.39 and 3.43 nm). It is interesting to note that the conformational states sampled by the crystal subunits (except uc3) are anti-correlated in Fig. 3. Since the Rg is increasing in the diagonal direction, this means that the Rg of five subunits is stabilized by a compensation among the two modes. For example, a mode 1 extension (opening), as in uc2, is compensated by a mode 2 contraction (compaction). The stabilization of the Rg appears to be an effect of crystal packing, since no other trajectory exhibited such a pronounced anti-correlated pattern (Fig. 3).
Although crystal packing effects can explain much of the behavior of the EGF simulations, such as the increased stability in the crystal unit cell, they do not fully explain our observations. The Rg results indicate that the simulated sEGFR dimers in the crystal are systematically more compact than the initial structure (although not as compact as in solvent). This residual compaction cannot be explained by crystal packing alone and is especially pronounced for the outlier uc3. We note that domain IV did exist in the experimental 2:2 EGF:sEGFR complex expressed for crystallization. However, it was too disordered to yield full atomic coordinates in the PDB structure and was thus not complete in our system. Mutation analysis and the Ferguson model for the sEGFR dimer including domain IV (Fig. 2) suggests that, in addition to domain II, domain IV may contribute to EGFR dimerization [22]. Therefore, it is likely that the initial crystal structure of the sEGFR dimer is stabilized by domain IV, and the absence of parts of this domain in our system could explain the residual compaction in the crystal simulation. To test this hypothesis, we have carried out two simulations of the Ferguson model (Fig. 2) in solution. These additional control simulations demonstrated that the compaction of the system (which occurs within 2 ns, see below) can be delayed for 8 ns by the presence of the full domain IV. Eventually, the modeled domain IVs will slip past each other (due to an observed instability of the speculative domain IV interface in that model), and the system will compact. The instability of domain IVs can be expected since the speculative interface between the domains (derived from the stable tethered conformation) is probably different from that in the untethered dimer (where the domain was too disordered to be solved by crystallography). It is therefore worth noting that we observed a significant delay of the compaction while the speculative domain IV contacts remained intact, in support of the proposed role of domain IV in stabilizing the 2:2 EGF:sEGFR crystal structure.
In a true biological system, the domain IV is tethered to the membrane by a transmembrane helix. If this helix were included in the Ferguson model, it may stabilize the domain IV and somewhat prevent compaction. Unfortunately we could not address this issue due to the lack of structural information. The extracellular domain by itself is quite important as evident from the recent crystal structure published for the Drosophila sEGFR [47] which did not include the transmembrane helices.
In summary, the results of the crystal simulation indicate that the dimer is significantly stabilized (compared to the solvent simulations) by crystal packing effects. In addition, there is indirect evidence that points to domain IV’s role as a spacer in stabilizing the 2:2 EGF:sEGFR crystal structure.
Solvent simulations of the 2:2 TGFα:sEGFR complex
The resolution of the electron density of the 2:2 EGF:sEGFR complex was 3.3 Å. At such low resolution, it is possible during crystallographic refinement that artifacts are introduced into the solved structure. To rule out any effect of the relatively low resolution, we carried out two simulations of the 2:2 TGFα:sEGFR complex which was solved at a higher 2.5 Å resolution. TGFα is another member of the EGF-family, which has similar structural and functional characteristics to EGF. Starting from the crystal structure of the 2:2 TGFα:sEGFR complex [14], two independent MD simulations (referred to as TGFα-S1 and TGFα-S2, respectively) were performed in solvent.
The initial structures of the sEGFR dimer in the 2:2 EGF:sEGFR complex (red up-triangle in Fig. 3) and the 2:2 TGFα:sEGFR complex (black up-triangle in Fig. 3) are distant on the embedding plane, with a RMSD of 0.44 nm. Several factors may contribute to this significant difference. (1) Domain IV was absent in the specimen expressed for crystallization of the 2:2 TGFα:sEGFR complex, but does exist in the 2:2 EGF:sEGFR complex (although it is not well ordered). Therefore, the 2:2 TGFα:sEGFR complex may have a different initial configuration from the 2:2 EGF:sEGFR complex, due to the absence/presence of domain IV. (2) The crystal of the 2:2 EGF:sEGFR complex belongs to the space group P3121 (Fig. 1b), whereas that of the 2:2 TGFα:sEGFR complex belongs to the space group P21. Different space groups may generate different crystallographic contacts that affect the configurations in the crystal unit cell. (3) The sEGFR dimer may take different configurations upon binding of different ligands.
A large compaction from the start structure was observed in the TGFα simulations (Fig. 3). The RMSD from the initial structure was 0.62 nm for TGFα-S1, and 0.41 nm for TGFα-S2 (Table 1). The Rg of the initial structure is 3.72 nm, which decreased to 3.46 nm in TGFα-S1 and 3.51 nm in TGFα-S2 (Table 2). Comparing the initial and the final structures of TGFα-S1 in Figure 4f, the compaction is very prominent (although not as dramatic as in EGF-S2) and involves large displacements between 0.33 and 0.60 nm for domains I, III, and the ligand.
The results demonstrate that the sEGFR dimer also becomes compact in the simulations of the 2:2 TGFα:sEGFR complex. Since the resolution of the 2:2 TGFα:sEGFR crystal structure is fairly high (2.5 Å) and all of domain IV was absent in the specimen expressed for crystallization, the large compaction of the 2:2 TGFα:sEGFR solvent simulations can only be explained by a relaxation from the crystal packing effects.
Principal component analysis of dominant motions
We have evidence for two distinct functional motions in our simulations: relaxation from crystal packing and relaxation from domain IV stabilization. Could these two motions be related to the dominant two PCA modes in Fig. 3? Our results suggest so. The solvent simulations TGFα-S1 and TGFα-S2 sample a broad region mainly along mode 1 (green dots and magenta down-triangles in Fig. 3). As mentioned above, domain IV is absent in the crystal structure of the 2:2 TGFα:sEGFR complex, which implies that mode 1 exclusively corresponds to the relaxation due to the loss of the crystallographic contacts. On the other hand, in the crystal simulation of the 2:2 EGF:sEGFR complex, five subunits sample only a limited region of conformational space, except that uc3 escapes from the initial state along mode 2 (Fig. 3). Since uc3 is still restrained by crystal packing, the motion along mode 2 appears to originate exclusively in the relaxation due to the incomplete domain IV. Consistent with this interpretation is the observation that the intial structure and simulation trajectories of the TGFα dimer are roughly on the same mode 2 elongation level as the EGF dimer simulations EGF-S1, EGF-S2, and uc3 after their proposed relaxation from domain IV stabilization. The observation that, without both crystal packing and domain IV constraints, EGF-S1 and EGF-S2 move diagonally to both lower mode 1 and mode 2 elongation is also consistent with this interpretation.
The first simulations described in this work were carried out several years ago when nanosecond time scale MD simulations were state of the art. Over time the opportunity arose to perform multiple control simulations and to model larger systems consisting of nearly half a million atoms. This expansion in computational complexity (Fig. 3) required that the running length of individual trajectories be kept short. To demonstrate a sufficient simulation time and to analyze the relaxation times of the observed collective motions, we performed an autocorrelation analysis of the PCA modes. Figure 5 shows projections of the EGF-S2 trajectory onto the three largest eigenvalue PCA modes and their auto-correlation functions. The results show that the projections along the first two modes exhibit a fast relaxation from the initial conformation, with relaxation times (2–3 ns) that are much shorter than the simulation length of 12 ns. Also, the autocorrelation of the first two modes drops to within ± 0.25 at 6 ns lag time (for the dynamics to converge, the auto-correlation function should decay to near zero within lag times on the order of the sampling time). The results confirm that the two-dimensional subspace spanned by the first two modes is reasonably well-converged. In contrast, the third mode exhibits no apparent relaxation and fluctuates about the initial value. The autocorrelation of the third mode remains at −0.5 at 6 ns lag time, indicating insufficient sampling of this mode. This result further justifies our use of two (converged) dimensions for the embedding in Fig. 3.
Figure 5.

Projections of the EGF-S2 trajectory along its first three PCA modes (a–c, left) and their auto-correlation functions (d–f, right). (a and d) the first PCA mode, (b and e) the second PCA mode, and (c and f) the third PCA mode. We note that modes 1 and 2 in this Figure are not identical but very close to the modes in Figures 3 and 6). Here, the PCA analysis was performed on EGF-S2 only to maximize the variability of the projection along the modes (as is customary in PCA). An autocorrelation analysis based on projection along the PCA modes from the combined meta-trajectory (as in Fig. 3) gave nearly identical results for modes 1 and 2 (results not shown).
In the following two sections, we will explore the first two PCA modes derived from the meta-trajectory in more detail and relate them to biological function.
Asymmetric mode 1 - relaxation from crystal packing effects
Figure 6a shows that PCA mode 1 corresponds to an asymmetric motion between the two sEGFR monomers. In the left sEGFR monomer (Fig. 6a), domain I (iceblue) comes into the plane of the page as domain III (pink) moves out of the plane, and vice versa. The sEGFR monomer on the right performs a similar but antiparallel motion relative to the left monomer. That is to say, its domain I (blue) comes out of the plane of the page while domain III (red) moves into the plane, and vice versa. In the crystal unit cell, the motions of domains I and III are constrained by crystallographic contacts (Fig. 1b), which are relaxed in the solvent simulations. This antiparallel motion described by the first PCA mode twists the two sEGFR monomers, and thus the dimer becomes more compact. The two dimerization arms in the domain IIs (ocher and green) are tightened by this twisting motion, which indicates stronger contacts for sEGFR dimerization.
Figure 6.

The important relaxation modes of the sEGFR dimer. (a) The first (asymmetric) PCA mode, and (b) the second (near-symmetric) PCA mode. The arrows indicate the direction of motion and the maximum amplitude of the displacement: Arrows point from the most positive to the most negative projection observed in the combined trajectory along each mode. Cα atoms of domains I–III are shown for the most positive projection, colored in the same manner as in Fig. 1.
After completion of this work the structure of a ligand-Induced dimer of Drosophila sEGFR (d-sEGFR) was reported that exhibited a surprisingly asymmetric conformation [47]. The timely discovery of this asymmetric structure allowed us to compare the MD simulation results of (human) sEGFR symmetry breaking to those observed in an actual asymmetric crystal structure. We chose trajectory TGFα-S1 as a model for the symmetry breaking because of its dominant movement along the asymmetric mode 1 (Fig. 3). In Figure 7 we compare the motions observed in TGFα-S1 with the new asymmetric d-sEGFR structure. There is a striking similarity in overall domain arrangement and in two of the three dimer interface contact points (Fig. 7b,d). Moreover, the time evolution of the conformation provides information about the sequence of symmetry breaking events. The RMSD between TGFα-S1 and d-sEGFR (Fig. 7c) exhibits a funnel-like pattern where the structure quickly relaxes from an initial 0.48 nm RMSD to 0.28 nm within the first 1.5 ns simulation time. Detailed inspection of the trajectory reveals that contact point I breaks first, after 0.3 ns. This contact point involves interactions between Q194 and P204 (corresponding to Q189 and P200 in d-sEGFR, see Fig. 5 in [47]). Subsequently, after 0.5 ns, the central dimerization arms move out of register. This motion is due to the breaking of a stabilizing contact involving D279 and H280 (not shown), two residues that were found to be important for dimerization by mutation analysis [22]. We note that the misalignment ranging from contact point I to the dimerization arm appears quite similar between TGFα-S1 and d-sEGFR. However, an additional asymmetric contact point formed after 1.4 ns (labelled II in Fig. 7 and comprised by E306 and K301) that was observed only in the simulation. It is apparrent from the RMSD values (Fig. 7c) that the simulation first approached d-sEGFR, but after 1.5 ns the simulated system relaxes even further, establishing an asymmetric contact point II (which remains symmetric in d-sEGFR).
Figure 7.

The trajectory TGFα-S1 as a model for symmetry breaking. (a and b) The initial (TGFα-ini) and final (TGFα-fin) structures of TGFα-S1. (c) RMSD of Cα atoms of TGFα-S1 from corresponding Cα atoms of the d-sEGFR structure (820 out of 956 Cα atoms of domains I-III were matched using the ‘Multiseq’ program of VMD [38]); the blue drop from the baseline emphasizes the difference to the initial RMSD. (d) The d-sEGFR structure [47]. There are three symmetry-breaking contacts in the dimer interface: contact I (near domain I), the central dimerization arm (not labeled), and contact II (see text for details).
Near-symmetric mode 2 - relaxation from domain IV stabilization
The motion described by PCA mode 2 is nearly symmetric, and it essentially takes place within the plane of the page (Fig. 6b). As discussed above, this mode appears to describe a relaxation due to the absence (or incompleteness) of domain IV which acts as a spacer. The domain IIIs are getting closer and the dimerization interface (domain II) can interact more tightly than in the initial structure. In other words, the loss of putative dimerization contacts in domain IV (Fig. 2) is compensated by an increase in contacts between the two domain IIs. Among our trajectories, uc3 best mimics this particular mode (Fig. 3). Since uc3 is still restrained by crystal packing, it does not exhibit the pronounce symmetry breaking of mode 1. The motion along mode 2 in uc3 appears to originate exclusively in the relaxation due to the incomplete domain IV.
It has been reported that deletion of domain IV has only a minor effect on dimerization strength [22] despite of its obvious importance (e.g., for ligand binding). We propose that domain IV may play a dual role in EGFR dimerization. Contacts between the two domain IVs contribute to the dimerization. On the other hand, domain IV may act as a stabilizing spacer that can buttress domain III. The two domain IIIs both move inwards without the support of the domain IVs and further squeeze the two domain IIs together (Fig. 6b), which seems to strengthen dimerization. This dual role of domain IV may explain why its deletion has little affect on dimerization [22], since contacts are merely shifted from IV to II. In mode 2, the ligand-binding sites between domains I and III are closed as well (Fig. 6b), which may enhance ligand binding. The result could help rationalize how deletion of domain IV increases ligand binding affinity 24-fold [22], but the detailed mechanism is possibly more complex [3] because it might also involve changes in the tethered conformation that is believed to be in a dynamic equilibrium with the untethered (dimer) conformation.
Structural characterization of the sEGFR dimer compaction
The collective motions observed in our simulations have major implications for the dimerization interface of sEGFR. It is worth noting that most trajectories move along both PCA modes 1 and 2. In Figure 7 we described the symmetry-breaking motions observed in trajectory TGFα-S1 which approximately mimics mode 1, but even bigger relaxation motions occurred in EGF-S2 that moves along both dominant PCA modes. In this section we describe functionally relevant details of the compaction resulting from the combined effect of modes 1 and 2 in the EGF-S2 trajectory.
Figure 8a shows the time evolution of secondary structures in the EGF-S2 trajectory. The number of residues that belong to any kind of secondary structure, α-helix or β -sheet are all fairly stable during the simulation (Fig. 8a), suggesting that the major relaxation in solvent is not caused by the forming or breaking of any secondary structure. RMSD of different domains in one sEGFR monomer for EGF-S2 were computed to find out which domain contributes most to the structural relaxation (Fig. 8b). The RMSD values of domain I (blue in Fig. 8b, about 0.15 nm on average) and domain III (red in Fig. 8b, about 0.2 nm on average) are small, whereas domain II (green in Fig. 8b) exhibits a RMSD larger than 0.3 nm. Interestingly, the RMSD values of the sEGFR monomer, excluding domain IV (black in Fig. 8b), are correlated with the RMSD of domain II. These results indicate that domains I and III act like two rigid bodies linked by domain II (see also Fig. 4d). The relaxation in the sEGFR dimer in EGF-S2 (which involves both PCA modes 1 and 2) originates in a collective motion between domains I and III, in which they approach each other in each sEGFR monomer (Fig. 4d) and push its domain II (green) toward the other monomer. Thus the dimerization arms between the two sEGFR monomers intertwine more extensively, and the sEGFR dimer becomes compact.
Figure 8.

Structural characteristics of trajectory EGF-S2. (a) Time evolution of secondary structure. The black plot shows the number of residues that belong to any kind of secondary structure as detected by DSSP [58], the red plot shows the number of residues that belong to α-helices, and the green plot shows the number of residues that belong to β -sheets. (b) RMSD from the initial structure plotted for one sEGFR monomer and its domains. Black: the sEGFR monomer without domain IV, blue: domain I, green: domain II, and red: domain III.
Structural data [15] and mutational analysis [22] have shown that domain III may buttress the C-terminus of domain II for dimerization. The side chain of N274 in module 6 of domain II forms hydrogen bonds with many residues in domain III (Fig. 9). The number of these hydrogen bonds increases in the EGF-S2 simulation (Fig. 10a). Also, the side chain of E293 in module 7 of domain II forms a salt bridge with the side chain of R405 of domain III (Fig. 9). The distance between the side chains of E293 and R405 decreases in EGF-S2 (Fig. 10b). These results indicate that the buttressing interactions between domains II and III are strengthened in the simulation. In EGF-S2, without domain IV acting as a stabilizing spacer, the two domain IIIs both move toward the center of the dimer interface as described by the second PCA mode (Fig. 6b). Through those strengthened buttressing interactions between domains II and III (Figs. 9 and 10), the two domain IIs (especially modules 6 and 7) are effectively pushed further into dimer interface so that they may promote sEGFR dimerization.
Figure 9.

Buttressing interactions between domains II and III in the 2:2 EGF:sEGFR complex (PDB entry 1IVO). Hydrogen bonds between N274 in domain II and residues in domain III are shown in the left sEGFR monomer, and a salt bridge between E293 and R405 is shown in the right sEGFR monomer.
Figure 10.

Time evolution of buttressing interactions between domains II and III in trajectory EGF-S2. (a) The number of hydrogen bonds between N274 in domain II and residues in domain III. A hydrogen bond is defined when the hydrogen-acceptor distance is within 0.35 nm. (b) The distance of the salt bridge between E293 and R405 (measured by the distance between the centers-of-mass of the side chains of the two residues).
Conclusions
In this work, multiple MD simulations of the 2:2 EGF:sEGFR and 2:2 TGFα:sEGFR complexes were performed in different (solvent or crystal) environments. The goal of the simulations was to explore the configurations of the sEGFR dimer in the presence of EGF family ligands and to investigate its dynamical modes of motion and relate them to the dimerization of sEGFR. We observed a significant (≈0.5 nm RMSD) structural relaxation in solvent that strengthens the dimerization contacts of domain II, especially in the two dimerization arms between the two sEGFR monomers. The observed structural instability and large-scale conformational change are quite exceptional for nanosecond time scale simulations. The compaction in solvent can be attributed to the loss of crystal contacts (both EGF and TGFα ligands) and to a relaxation from stabilization by domain IV (EGF ligand). There is consistent evidence that the two relaxation modes are identical to the first two PCA modes that dominate the fluctuations of the sEGFR dimer in the combined meta-trajectory of all simulations (Fig. 6). The first (asymmetric) PCA mode is due to the relaxation from the crystal packing, and the second (near-symmetric) mode reveals a possible stabilizing role of domain IV (which was incomplete in our simulations).
The extent of the relaxation of sEGFR dimers in solvent, for both EGF and TGFα ligands, appeared to be quite reasonable when compared to experiments and interpreted by function. First, the relaxation along mode 1 was on the order of the conformational difference between the initial crystal structures, with any remaining differences between EGF and TGFα simulations possibly attributable to the type of ligand. We note that such a significant compaction in solvent after relaxation from crystal packing is not unusual. A well-known historic example of this behavior is calmodulin, which was first solved in an elongated conformation with X-ray crystallography [48], but shown to compact in solution by small-angle X-ray scattering (SAXS) experiments [49], a result that remained controversial until the compaction was eventually confirmed by NMR [50]. Second, we found the relaxed EGF-bound structures (EGF-S1, EGF-S2, and the crystal subunit uc3) at a level of mode 2 similar to the TGFα simulations (which were based on a crystal structure that had domain IV missing) consistent with our interpretation of mode 2 relating to the absence of domain IV stabilization. Third, we observed a striking similarity between symmetry breaking motions in our asymmetric trajectory TGFα-S1 and conformational differences in the novel d-sEGFR structure [47]. The asymmetric relaxation in d-sEGFR has a completely different biophysical origin and thereby provides an independent validation of our interpretation. Interestingly, our simulated system first approaches d-sEGFR, but after 1.5 ns the system relaxes even further, breaking the remaining symmetric dimer interface in d-sEGFR. Although we do not expect a complete analogy between our asymmetric simmulation of human sEGFR and Drosophila sEGFR, one possible explanation for this discrepancy is that the asymmetric contact point II (Fig. 7) is stabilized by residual crystal packing effects in the d-sEGFR structure that are free to relax in the simulation.
Due to necessary assumptions of the models and the simulation protocols we point out possible limitations of our work. First, we were unable to address the issue of glycosylation. The extracellular region of EGFR is about 20% carbohydrate by mass but there are very few (10 and 14) solvent-exposed sugars present in the PDB structures (1IVO and 1MOX). Without complete atomic information we did not include any residual sugars in the models studied here. The present studies demonstrate mainly the water-based polymorphism the structures are capable of; we cannot rule out that oligosaccharide-mediated interactions could help stabilize the crystal packing and the conformation of the dimer in the extracellular region. Second, the importance of domain IV for ligand binding arises here from its proposed role in domain II/III butressing in the untethered dimer structure (observed in the near-symmetric mode 2). It is believed that effects of domain IV deletion on the tethered structure (in a dynamic equilibrium with untethered states) will have a significant influence on ligand binding affinity [3]. Our observations of compaction in the untethered dimer alone can play only a part in rationalizing how deletion of domain IV alters ligand binding.
In summary, our simulations predict that the sEGFR dimer in solution, in the absence of domain IV, is significantly more compact compared to the known crystal structures. Our predictions are consistent with the asymmetric crystal structure of d-sEGFR and with a number of experiments. The results could inspire future experimental research and be further verified experimentally by structural probes and techniques such as FRET and SAXS. Unfortunately, the published SAXS experiments included the stabilizing domain IV, and also they were focused mainly on the larger transition from the tethered to the extended conformation [21]. It is hoped that the experimental sensitivities are soon sufficient to confirm our computational predictions.
Some aspects of this work could also inspire future computational research. The EGF and TGFα systems did not fully converge to the same end conformation. This could be due to the short simulation time (under-sampling), so we did not discuss any ligand-specific differences in structural dynamics. Longer simulations are required to study why certain antibodies can selectively inhibit binding by one of these ligands but not the other. One could also investigate the dimerization affinity between sEGFR upon binding of different ligands by binding free energy calculations, some of which are reasonably efficient for a system of this size [51, 52, 53]. Finally, the conformational transition from the tethered to the extended sEGFR may be studied directly by taking advantage of targeted or enhanced sampling techniques in MD [54, 55, 56, 57].
Supplementary Material
Acknowledgments
Funding Information: This work was supported in part by grants from NIH (1R01GM62968), Human Frontier Science Program (RGP0026/2003), and Alfred P. Sloan Foundation (BR-4297).
We are grateful to Stefan Birmanns for providing continuing computational resources and support at the University of Texas School of Biomedical Informatics after both authors moved to new positions. We also thank Mili Shah (Rice University) for helpful discussions in the early stages of this work.
Abbreviations
- EGF
epidermal growth factor
- EGFR
EGF receptor
- sEGFR
EGFR extracellular domain
- d-sEGFR
dimer of Drosophila sEGFR
- TGFα
transforming growth factor α
- MD
molecular dynamics
- RTK
receptor tyrosine kinase
- PDB
Protein Data Bank
- NPT
isothermal-isobaric ensemble
- NVT
canonical ensemble
- PCA
principal component analysis
- RMSD
root mean square deviation
- Rg
radius of gyration
- NMR
nuclear magnetic resonance
- FRET
Förster resonance energy transfer
- SAXS
small-angle X-ray scattering
Footnotes
We have made the final structures of the simulations available as supplemental materials, which may be accessed free of charge online at http://pubs.acs.org.
References
- 1.Yarden Y. The EGFR family and its ligands in human cancer. signalling mechanisms and therapeutic opportunities. Eur J Cancer. 2001;37(Suppl 4):S3–S8. doi: 10.1016/s0959-8049(01)00230-1. [DOI] [PubMed] [Google Scholar]
- 2.Grandal MV, Madshus IH. Epidermal growth factor receptor and cancer: Control of oncogenic signalling by endocytosis. J Cell Mol Med. 2008;12:1527–1534. doi: 10.1111/j.1582-4934.2008.00298.x. [DOI] [PMC free article] [PubMed] [Google Scholar]
- 3.Ferguson KM. Structure-based view of epidermal growth factor receptor regulation. Ann Rev Biophys. 2008;37:353–373. doi: 10.1146/annurev.biophys.37.032807.125829. [DOI] [PMC free article] [PubMed] [Google Scholar]
- 4.Yarden Y, Sliwkowski MX. Untangling the ErbB signalling network. Nature Rev Mol Cell Biol. 2001;2(2):127–137. doi: 10.1038/35052073. [DOI] [PubMed] [Google Scholar]
- 5.Harris RC, Chung E, Coffey RJ. EGF receptor ligands. Exp Cell Res. 2003;284(1):2–13. doi: 10.1016/s0014-4827(02)00105-2. [DOI] [PubMed] [Google Scholar]
- 6.Ullrich A, Coussens L, Hayflick JS, Dull TJ, Gray A, Tam AW, Lee J, Yarden Y, Libermann TA, Schlessinger J, Downward J, Mayes ELV, Whittle N, Waterfield MD, Seeburg PH. Human epidermal growth factor receptor cDNA sequence and aberrant expression of the amplified gene in A431 epidermoid carcinoma cells. Nature. 1984;309:418–425. doi: 10.1038/309418a0. [DOI] [PubMed] [Google Scholar]
- 7.Bajaj M, Waterfield MD, Schlessinger J, Taylor WR, Blundell T. On the tertiary structure of the extracellular domains of the epidermal growth factor and insulin receptors. Biochim Biophys Acta. 1987;916(2):220–226. doi: 10.1016/0167-4838(87)90112-9. [DOI] [PubMed] [Google Scholar]
- 8.Lax I, Johnson A, Howk R, Sap J, Bellot F, Winkler M, Ullrich A, Vennstrom B, Schlessinger J, Givol D. Chicken epidermal growth factor (EGF) receptor: cDNA cloning, expression in mouse cells, and differential binding of EGF and transforming growth factor alpha. Mol Cell Biol. 1988;8(5):1970–1978. doi: 10.1128/mcb.8.5.1970. [DOI] [PMC free article] [PubMed] [Google Scholar]
- 9.Ward CW, Hoyne PA, Flegg RH. Insulin and epidermal growth factor receptors contain the cysteine repeat motif found in the tumor necrosis factor receptor. Proteins: Struc Func and Genetics. 1995;22:141–153. doi: 10.1002/prot.340220207. [DOI] [PubMed] [Google Scholar]
- 10.Brown PM, Debanne MT, Grothe S, Bergsma D, Caron M, Kay C, O’Connor-McCourt MD. The extracellular domain of the epidermal growth factor receptor. Studies on the affinity and stoichiometry of binding, receptor dimerization and a binding-domain mutant. Eur J Biochem. 1994;225:223–233. doi: 10.1111/j.1432-1033.1994.00223.x. [DOI] [PubMed] [Google Scholar]
- 11.Lemmon MA, Bu Z, Ladbury JE, Zhou M, Pinchasi D, Lax I, Engelman DM, Schlessinger J. Two EGF molecules contribute additively to stabilization of the EGFR dimer. EMBO J. 1997;16:281–294. doi: 10.1093/emboj/16.2.281. [DOI] [PMC free article] [PubMed] [Google Scholar]
- 12.Carpenter G, Cohen S. Epidermal growth factor. J Biol Chem. 1990;265:7709–7712. [PubMed] [Google Scholar]
- 13.Ullrich A, Schlessinger J. Signal transduction by receptors with tyrosine kinase activity. Cell. 1990;61:203–212. doi: 10.1016/0092-8674(90)90801-k. [DOI] [PubMed] [Google Scholar]
- 14.Garrett TPJ, McKern NM, Lou M, Elleman TC, Adams TE, Lovrecz GO, Zhu HJ, Walker F, Frenkel MJ, Hoyne PA, Jorissen RN, Nice EC, Burgess AW, Ward CW. Crystal structure of a truncated epidermal growth factor receptor extracellular domain bound to transforming growth factor. α Cell. 2002;110:763–773. doi: 10.1016/s0092-8674(02)00940-6. [DOI] [PubMed] [Google Scholar]
- 15.Ogiso H, Ishitani R, Nureki O, Fukai S, Yamanaka M, Kim JH, Saito K, Sakamoto A, Inoue M, Shirouzu M, Yokoyama S. Crystal structure of the complex of human epidermal growth factor and receptor extracellular domains. Cell. 2002;110:775–787. doi: 10.1016/s0092-8674(02)00963-7. [DOI] [PubMed] [Google Scholar]
- 16.Schlessinger J. Ligand-induced, receptor-mediated dimerization and activation of EGF receptor. Cell. 2002;110(6):669–672. doi: 10.1016/s0092-8674(02)00966-2. [DOI] [PubMed] [Google Scholar]
- 17.Burgess AW, Cho HS, Eigenbrot C, Ferguson KM, Garrett TP, Leahy DJ, Lemmon MA, Sliwkowski MX, Ward CW, Yokoyama S. An open-and-shut case? Recent insights into the activation of EGF/ErbB receptors. Mol Cell. 2003;12(3):541–552. doi: 10.1016/s1097-2765(03)00350-2. [DOI] [PubMed] [Google Scholar]
- 18.Mattoon D, Klein P, Lemmon MA, Lax I, Schlessinger J. The tethered configuration of the EGF receptor extracellular domain exerts only a limited control of receptor function. Proc Natl Acad Sci USA. 2004;101(4):923–928. doi: 10.1073/pnas.0307286101. [DOI] [PMC free article] [PubMed] [Google Scholar]
- 19.Bouyain S, Longo PA, Li S, Ferguson KM, Leahy DJ. The extracellular region of ErbB4 adopts a tethered conformation in the absence of ligand. Proc Natl Acad Sci USA. 2005;102(42):15024–15029. doi: 10.1073/pnas.0507591102. [DOI] [PMC free article] [PubMed] [Google Scholar]
- 20.Ferguson KM, Berger MB, Mendrola JM, Cho HS, Leahy DJ, Lemmon MA. EGF activates its receptor by removing interactions that auto-inhibit ectodomain dimerization. Mol Cell. 2003;11:507–517. doi: 10.1016/s1097-2765(03)00047-9. [DOI] [PubMed] [Google Scholar]
- 21.Dawson JP, Bu Z, Lemmon MA. Ligand-induced structural transitions in ErbB receptor extracellular domains. Structure. 2007;15(8):942–954. doi: 10.1016/j.str.2007.06.013. [DOI] [PubMed] [Google Scholar]
- 22.Dawson JP, Berger MB, Lin CC, Schlessinger J, Lemmon MA, Ferguson KM. Epidermal growth factor receptor dimerization and activation require ligand-induced conformational changes in the dimer interface. Mol Cell Biol. 2005;25(17):7734–7742. doi: 10.1128/MCB.25.17.7734-7742.2005. [DOI] [PMC free article] [PubMed] [Google Scholar]
- 23.Brooks CL, III, Karplus M, Pettitt BM. Proteins: A Theoretical Perspective of Dynamics, Structure and Thermodynamics, volume LXXI of Advances in Chemical Physics. John Wiley & Sons; New York: 1988. [Google Scholar]
- 24.Karplus M. Molecular dynamics: Applications to proteins. In: Rivail JL, editor. Modelling of Molecular Structures and Properties, volume 71 of Studies in Physical and Theoretical Chemistry; Proceedings of an International Meeting.Amsterdam: Elsevier Science Publishers; 1990. pp. 427–461. [Google Scholar]
- 25.Karplus M, McCammon JA. Molecular dynamics simulations of biomolecules. Nature Struct Biol. 2002;9:646–652. doi: 10.1038/nsb0902-646. [DOI] [PubMed] [Google Scholar]
- 26.Adcock SA, McCammon JA. Molecular dynamics: survey of methods for simulating the activity of proteins. Chem Rev. 2006;106:1589–1615. doi: 10.1021/cr040426m. [DOI] [PMC free article] [PubMed] [Google Scholar]
- 27.Bakan A, Bahar I. The intrinsic dynamics of enzymes plays a dominant role in determining the structural changes induced upon inhibitor binding. Proc Natl Acad Sci USA. 2009;106(34):14349–14354. doi: 10.1073/pnas.0904214106. [DOI] [PMC free article] [PubMed] [Google Scholar]
- 28.Berendsen HJC, van der Spoel D, van Drunen R. Gromacs: A message-passing parallel molecular dynamics implementation. Comput Phys Commun. 1995;91:43–56. [Google Scholar]
- 29.Lindahl E, Hess B, van der Spoel D. Gromacs 3.0: A package for molecular simulation and trajectory analysis. J Mol Model. 2001;7:306–317. [Google Scholar]
- 30.van Gunsteren WF, Billeter SR, Eising AA, Hünenberger PH, Krüger P, Mark AE, Scott WRP, Tironi IG. Biomolecular simulation: the GROMOS96 manual and user guide. BIOMOS bv; Zürich, Groningen: 1996. [Google Scholar]
- 31.Berendsen HJC, Postma JPM, van Gunsteren WF, Hermans J. Interaction models for water in relation to protein hydration. In: Pullman B, editor. Intermolecular forces. Dordrecht; Netherlands: 1981. pp. 331–342. Reidel. [Google Scholar]
- 32.van der Spoel D, van Buuren AR, Apol E, Meulenhoff PJ, Tieleman DP, Sijbers ALTM, Hess B, Feenstra KA, Lindahl E, van Drunen R, Berendsen HJC. Gromacs User Manual version 3.1. Nijenborgh 4, 9743 AG Groningen, The Netherlands: 2001. Internet: http://www.gromacs.org. [Google Scholar]
- 33.Verlet L. Computer ‘experiments’ on classical fluids: I. Thermodynamical properties of Lennard-Jones molecules. Physical Review. 1967;159:98–103. [Google Scholar]
- 34.Berendsen HJC, Postma JPM, van Gunsteren WF, DiNola A, Haak JR. Molecular dynamics with coupling to an external bath. J Chem Phys. 1984;81:3684–3690. [Google Scholar]
- 35.Hess B, Bekker H, Berendsen HJC, Fraaije JGEM. A linear constraint solver for molecular simulations. J Comp Chem. 1997;18:1463–1472. [Google Scholar]
- 36.Essman U, Perela L, Berkowitz ML, Darden T, Lee H, Pedersen LG. A smooth particle mesh Ewald method. J Chem Phys. 1995;103:8577–8592. [Google Scholar]
- 37.Guex N, Peitsch MC. SWISS-MODEL and the Swiss-PdbViewer: An environment for comparative protein modeling. Electrophoresis. 1997;18:2714–2723. doi: 10.1002/elps.1150181505. http://www.expasy.org/spdbv/ [DOI] [PubMed]
- 38.Humphrey WF, Dalke A, Schulten K. VMD – Visual Molecular Dynamics. J Mol Graphics. 1996;14:33–38. doi: 10.1016/0263-7855(96)00018-5. [DOI] [PubMed] [Google Scholar]
- 39.Kitao A, Go N. Investigating protein dynamics in collective coordinate space. Curr Opinion Struct Biol. 1999;9:164–169. doi: 10.1016/S0959-440X(99)80023-2. [DOI] [PubMed] [Google Scholar]
- 40.Berendsen HJC, Hayward S. Collective protein dynamics in relation to function. Curr Opinion Struct Biol. 2000;10:165–169. doi: 10.1016/s0959-440x(00)00061-0. [DOI] [PubMed] [Google Scholar]
- 41.Amadei A, Linnsen ABM, Berendsen HJC. Essential dynamics of proteins. Proteins: Struc Func and Genetics. 1993;17:412–425. doi: 10.1002/prot.340170408. [DOI] [PubMed] [Google Scholar]
- 42.Balsera MA, Wriggers W, Oono Y, Schulten K. Principal component analysis and long time protein dynamics. J Phys Chem. 1996;100(7):2567–2572. [Google Scholar]
- 43.Zhang Z, Wriggers W. Local feature analysis: A statistical theory for reproducible essential dynamics of large macromolecules. Proteins: Struc Func and Bioinformatics. 2006;64:391–403. doi: 10.1002/prot.20983. [DOI] [PubMed] [Google Scholar]
- 44.Rapp CS, Pollack RM. Crystal packing effects on protein loops. Proteins: Struc Func and Bioinformatics. 2005;60(1):103–109. doi: 10.1002/prot.20492. [DOI] [PubMed] [Google Scholar]
- 45.Anselmi M, Brunori M, Vallone B, Di Nola A. Molecular dynamics simulations of the neuroglobin crystal: Comparision with the simulation in solution. Biophys J. 2008;95:4157–4162. doi: 10.1529/biophysj.108.135855. [DOI] [PMC free article] [PubMed] [Google Scholar]
- 46.Kondrashov DA, Zhang W, Aranda R, IV, Stec B, Phillips GN., Jr Sampling of the native conformational ensemble of myoglobin via structures in different crystalline environments. Proteins: Struc Func and Bioinformatics. 2008;70:353–362. doi: 10.1002/prot.21499. [DOI] [PubMed] [Google Scholar]
- 47.Alvarado D, Klein DE, Lemmon MA. Structural basis for negative cooperativity growth factor binding to an EGF receptor. Cell. 2010;142:568–579. doi: 10.1016/j.cell.2010.07.015. [DOI] [PMC free article] [PubMed] [Google Scholar]
- 48.Babu YS, Bugg CE, Cook WJ. Structure of calmodulin refined at 2.2 Å resolution. J Mol Biol. 1988;204:191–204. doi: 10.1016/0022-2836(88)90608-0. [DOI] [PubMed] [Google Scholar]
- 49.Heidorn DB, Trewhella J. Comparison of the crystal and solution structures of calmodulin and troponin C. Biochemistry. 1988;27:909–915. doi: 10.1021/bi00403a011. [DOI] [PubMed] [Google Scholar]
- 50.Barbato G, Ikura M, Kay LE, Pastor RW, Bax A. Backbone dynamics of calmodulin studied by 15N relaxation using inverse detected two-dimensional NMR spectroscopy: The central helix is flexible. Biochemistry. 1992;31:5269–5278. doi: 10.1021/bi00138a005. [DOI] [PubMed] [Google Scholar]
- 51.Kollman PA, Massova I, Reyes C, Kuhn B, Huo S, Chong L, Lee M, Lee T, Duan Y, Wang W, Donini O, Cieplak P, Srinivasan J, Case D, Cheatham TE., III Calculating structures and free energies of complex molecules: Combining molecular mechanics and continuum models. Acc Chem Res. 2000;33:889–897. doi: 10.1021/ar000033j. [DOI] [PubMed] [Google Scholar]
- 52.Zoete V, Meuwly M, Karplus M. Study of the insulin dimerization: Binding free energy calculations and per-residue free energy decomposition. Proteins: Struc Func and Bioinformatics. 2005;61(1):79–93. doi: 10.1002/prot.20528. [DOI] [PubMed] [Google Scholar]
- 53.Wang J, Deng Y, Roux B. Absolute binding free energy calculations using molecular dynamics simulations with restraining potentials. Biophys J. 2006;91(8):2798–2814. doi: 10.1529/biophysj.106.084301. [DOI] [PMC free article] [PubMed] [Google Scholar]
- 54.Schlitter J, Engels M, Krüger P, Jacoby E, Wollmer A. Targeted molecular dynamics simulation of conformational change - application to the T ↔ R transition in insulin. Molecular Simulation. 1993;10(2–6):291–308. [Google Scholar]
- 55.Zhang Z, Shi Y, Liu H. Molecular dynamics simulations of peptides and proteins with amplified collective motions. Biophys J. 2003;84:3583–3593. doi: 10.1016/S0006-3495(03)75090-5. [DOI] [PMC free article] [PubMed] [Google Scholar]
- 56.He J, Zhang Z, Shi Y, Liu H. Efficiently explore the energy landscape of proteins in molecular dynamics simulations by amplifying collective motions. J Chem Phys. 2003;119:4005–4017. [Google Scholar]
- 57.Zhang Z, Boyle PC, Lu B-Y, Chang J-Y, Wriggers W. Entropic folding pathway of human epidermal growth factor explored by disulfide scrambling and amplified collective motion simulations. Biochemistry. 2006;45:15269–15278. doi: 10.1021/bi0615083. [DOI] [PubMed] [Google Scholar]
- 58.Kabsch W, Sander C. Dictionary of protein secondary structure: pattern recognition of hydrogen-bonded and geometrical features. Biopolymers. 1983;22:2577–637. doi: 10.1002/bip.360221211. [DOI] [PubMed] [Google Scholar]
Associated Data
This section collects any data citations, data availability statements, or supplementary materials included in this article.