

Abstract
Blood brain barrier disruption (BBBD) shows promise for drug delivery in the brain, however optimal parameters for disruption have yet to be firmly established. Previous work has shown that BBBD can be achieved using bursts comprised of microsecond length pulses at 50% duty cycle in order to eliminate standing waves and variability. The capabilities and limitations of this sort of pulse sequence comprising short bursts were examined. Ultrasound induced BBBD was performed in 28 rats using Definity contrast agent. The spacing between 3 μs pulses at 1.18 MHz was either 6 μs, 60 μs, 300 μs, 600 μs during a 10 ms pulse, or 1 s for a single pulse burst. The rate of infusion of the microbubbles was also examined, as well as the burst PRF under infusion conditions. A semi-log relationship between enhancement mean and the number of cycles in a burst was discovered, with a 1 pulse burst (i.e. a 3 μs burst at 1 Hz) still capable of disrupting the BBB. No increased efficacy or safety benefit over bursts containing more cycles was found, however. Microbubble infusions showed no improvement in T1w enhancement, but did improve consistency. Increased burst PRF combined with infusion improved T1w enhancement but without statistical significance, while a decrease in burst PRF showed a statistically significant decrease in enhancement.
Keywords: Blood brain barrier, Focused ultrasound, Transcranial therapy, Brain
Introduction
Microbubble-mediated, ultrasound-induced disruption of the blood-brain barrier (BBB) is an increasingly investigated and promising technique for targeted drug delivery in the brain. The BBB limits permeation of molecules from the vasculature to the brain tissue to molecules smaller than 400–500 Da and with good lipid solubility [Pardridge 2005]. Since small molecules meeting these criteria can treat only a very limited number of disorders [Pardridge 2005], the BBB greatly restricts the effectiveness of many therapeutic agents. Ultrasound combined with microbubble contrast agent has been used to locally and transiently disrupt the BBB in preclinical models [Hynynen et al., 2001; Mesiwala et al., 2002; Sheikov et al., 2004; Choi et al., 2007; McDannold et al., 2007] and has allowed delivery of detectable levels of large molecules to the brain [Choi et al., 2010a], including the chemotherapy agent Herceptin (~150 kDa) [Kinoshita et al., 2006]. Recently, the use of ultrasound to deliver amyloid-beta antibodies to Alzheimer’s disease model mice showed a statistically significant reduction in plaques over those receiving ultrasound or the antibodies alone [Jordão et al., 2010].
Several studies have attempted to characterize the influence of frequency [McDannold et al., 2008a], burst length [McDannold et al., 2008b; Bing et al., 2009], pulse repetition frequency [McDannold et al., 2008b], total sonication duration [Chopra et al., 2010], microbubble size [Choi et al., 2010b] and contrast agent dose [Treat et al., 2007; Yang et al., 2008; McDannold et al., 2008b] on BBBD. However, discrepancy exists between many parametric studies. For example, McDannold et al. [2008b] observed no significant change in disruption level with increasing contrast agent dose, while both Yang et al. [2008] and Treat et al. [2007] demonstrated statistically significant increases in levels of delivered molecules with increasing microbubble dose. With the exception of a few studies that have examined the effects of short pulses [Hynynen et al., 2003; Bing et al., 2009; O’Reilly et al., 2010; Choi et al, 2010c], most work is conducted using continuous wave bursts on the order of milliseconds.
In a previous study, standing waves were identified as a source of variability in transcranial BBBD [O’Reilly et al., 2010]. Standing waves in the skull cavity were found to be geometry dependent and made estimation of in situ pressures impossible to accurately determine when continuous wave excitation was used. Therefore, high variability in results would exist between experimental setups and between animals. In that paper, standing waves were eliminated using ultrasound bursts consisting of closely timed single excitation cycles, which resulted in more consistent levels of BBBD. Further examination of the use of non-continuous wave ultrasound bursts to induce BBBD may lead to a better understanding of the mechanisms driving BBBD. This study uses closely-timed short pulses and examines the effects of the time between single excitation cycles, the PRF of the ultrasound bursts and the rate of injection of the microbubble contrast agent on BBBD in a rat model and in the absence of standing waves. In vivo results from 28 rats are presented and their implications for optimization of BBBD are discussed.
Materials and Methods
Animal Preparation
Twenty-eight rats (Wistar, 244 – 460 g) were anesthetized using a mixture of ketamine (10 mg/kg) and xylazine (40–50 mg/kg). Their heads were shaved and depilated. The animals were positioned supine on the top plate of a three-axis MR-compatible focused ultrasound System constructed in house (operationally similar to the one described by Chopra et al., 2009) with their heads coupled to the transducer via a water bath. Animals were sacrificed two hours following treatment and their brains and skullcaps were fixed in 10% buffered formalin. All animal experiments were approved by the institutional animal care committee.
Generation of the Ultrasound
The ultrasound was generated using a wideband-composite 8 sector spherically-focused array (10 cm aperture, FN=0.8, Imasonic, Inc., Voray-sur-L’Ognon, France), driven as a single element and matched to 1.18 MHz using an external matching circuit. An AFG3102 Tektronic function generator was used to provide an external trigger to an Agilent 33220A (Agilent, Santa Clara, CA, USA) function generator, which generated single sine wave cycles. The function generator signal was amplified using a NP2519 (NP Technology, Newbury Park, CA, USA) RF power amplifier.
Sonications
Definity microbubble contrast agent (0.02 ml/kg, Lantheus Medical Imaging, MA, USA) was injected via a tail vein catheter with the start of sonication. Total bubble dose was kept constant across all experiments. Five minutes were allowed between sonications to allow the Definity to clear from the system. All sonication were performed at an estimated in situ pressure of 0.54 MPa based on an average through skull transmission of 56% at 1.18 MHz and assuming transmission through 5 mm of brain tissue with an attenuation of 5 Np m−1 MHz−1 in brain tissue [Hynynen et al., 2001]. The through skull transmission was based on 24 measurements taken through 3 ex-vivo rat skulls (Wistar). The transducer was calibrated using single cycle pulses with a 10 μm fiber-optic hydrophone (Precision Acoustics, Ltd., Dorset, UK).
A modified pulse with a reduced duty cycle which has been shown to eliminate standing waves in the skull cavity in rats was used [O’Reilly et al., 2010]. Using this pulse, single excitation cycles from the function generator are repeated at close intervals to produce a 50% duty cycle over the duration of the burst. At 1.18 MHz a single excitation cycle caused the transducer to ring for approximately 3 μs. Therefore the control case in the parameter studies used a delay of 6 μs between excitation cycles to achieve the desired response, which was repeated over 10 ms bursts at a PRF of 1 Hz.
Three sets of experiments were conducted to examine the effects of lengthening the delay between single excitation cycles, changing the overall burst PRF and using different microbubbles injection rates. The division of animals and parameters used are summarized in Table 1. Figure 1 shows a timing diagram of the pulse sequence.
Table 1.
Experiment parameters
| Experiment | Parameter | No. Animals | Weight (g) | Sonication Duration | Injection Type | Microbubble dose (ml/kg) |
|---|---|---|---|---|---|---|
| 1 | Delay between cycles | 11 | 312–433 | 2 min | bolus | 0.02 |
| 2 | Injection type | 14 | 244–460 | 5 min | bolus, infusion | 0.02 |
| 3 | PRF | 3 | 225–337 | 5 min | infusion | 0.02 |
| Experiment | Parameter | Delay Between Cycles | PRF (Hz) | Cycles/Bursts | No. Bursts |
|---|---|---|---|---|---|
| 1 | Delay between cycles | 6 μs, 60 μs, 300 μs, 600 μs, 1 s | 1 | 1667, 167, 33 17, 1 | 120 |
| 2 | Injection type | 6 μs | 1 | 1667 | 300 |
| 3 | PRF | 6 μs | 0.2, 1, 2 | 1667 | 60, 300, 600 |
Fig1.
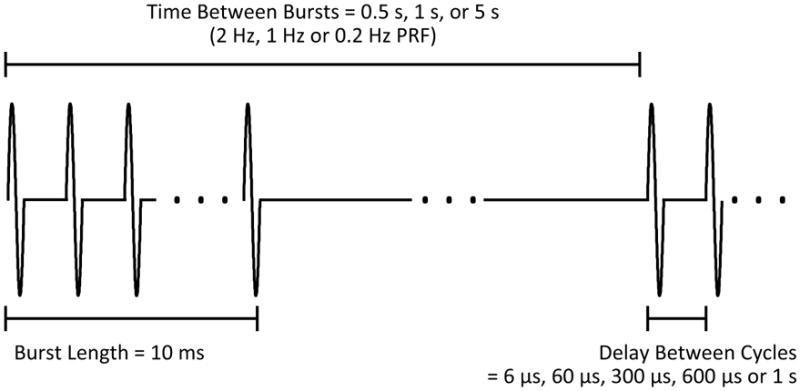
Timing diagram of pulse sequence from the function generator. Single cycles are repeated with a set delay for 10 ms bursts at variable burst PRF. For the case of a 1s delay between cycles, a single cycle is repeated at 1 Hz.
Experiment 1
Eleven rats were used to examine the effects of lengthening the delay between excitation cycles. One side of the brain was used as a control and four points approximately 2 mm from the midline were sonicated using a 6 μs delay between cycles in a burst. Four points on the contralateral side were sonicated using delays of 60 μs, 300 μs, 600 μs and 1 second. In the case of the 1 second delay, only a single cycle was delivered every second, and so the burst length was approximately 3 μs. For the other cases, the burst length remained constant at 10 ms. Therefore the total number of cycles delivered decreased with increasing delay between cycles. Four points and their control pairs were discounted due to operator error. A total of 80 sonication locations were available for analysis (40 control, 10 at 60 μs, 10 at 30 μs, 10 at 600 μs, 10 at 1 s).
Experiment 2
Fourteen rats in total were used to examine the effects of microbubble infusion parameters on BBBD. All sonications were 5 minutes in length with 6 μs delays between cycles, 10 ms bursts and a 1 Hz PRF. Eight rats were used to compare enhancement achieved using bolus delivery of microbubbles versus infusion delivery. All sonications were 5 minutes in length. One side of the brain was sonicated at four points using bolus injection. The contralateral side was sonicated using microbubble infusion. The infusions were performed with an in-house constructed MRI-compatible syringe pump. The constructed syringe pump was driven by a Shinsei motor (Shinsei ultrasonic piezoelectric-ceramic rotary motor, USR60-S3N, Shinsei Corporation, Tokyo, Japan) and did not have any feedback control. The speed was controlled using a potentiometer, and the settings were calibrated. Infusions were 4.5 minutes in length, beginning with the start of sonication. Bubbles were kept in suspension during the infusion by rotating the syringe pump. A total of 64 locations (32 bolus, 32 infusion) were available for analysis.
The remaining six rats were used to compare different infusion rates. The infusions were performed using a fringe-field compatible feedback controlled syring pump (Chemyx NanoJetXF MRI Compatible Syringe Pump, Chemyx Inc., Stafford, TX, USA). The control case was a 15 second infusion designed to mimic a manual bolus but with the consistency of the syringe pump. Four sonication locations in each rat were sonicated with the control case. On the contralateral side, two sonications were performed with a 1 minute long infusion delivered at time t = 0. The other two sonication locations were performed with a 30 second infusion of a half-dose delivered at time t = 0 and the remaining dose delivered in a 30 second bolus halfway through the sonication (t = 2.5 min). One 1 minute infusion location and its control were excluded from analysis due to a targeting error. A total of 46 sonication location from the six rats were available for analysis (23 control, 23 experimental).
Experiment 3
Three animals were used to examine the effects of PRF under infusion conditions. The control side of the brain had four sonications at 1 Hz burst PRF. The contralateral side repeated bursts either every 0.5 second or 5 seconds (2 Hz or 0.2 Hz). The infusion was performed using a fringe-field compatible feedback controlled syringe pump (Chemyx NanoJetXF MRI Compatible Syringe Pump, Chemyx Inc., Stafford, TX, USA). Infusions lasted 4.5 minutes and bubbles were kept in suspension during the infusion by rotating the syringe pump. A total of 24 locations (12 control, 6 at 2 Hz, 6 at 0.2 Hz) were available for analysis.
Imaging
Sonications were MRI-guided (Signa 1.5 T, GE Healthcare, Milwaukee, WI, USA ), using T2w images (FSE, TE =61.7 ms, TR =2000 ms, ETL = 4, FOV = 6 cm × 6 cm, slice thickness = 1 mm, 128 × 128) to select the targets. Disruption of the blood-brain barrier was confirmed via contrast enhanced T1-weighted images (FSE, TE = 10 ms, TR = 500 ms). Sonication order and location was randomized and gadolinium (0.2 ml/kg Omniscan, GE Healthcare) was injected following the final sonication in each animal. Time series images were obtained until the enhancement peak had passed. T2w images were captured and examined for indicators of edema. Post-FUS T2w images were captured after MR contrast agent injection.
Analysis
Analysis was performed in MATLAB (Mathworks, MA, USA). Enhancement of the sonication locations relative to baseline was averaged over a 3×3 pixel region of interest. The region of interest was selected based on the maximum enhancement on the CE-T1w images. Enhancement means of the different parameters were compared to the control case using a two-tailed paired t-test.
Whole rat brains were post fixed in 10% NBF (neutral buffered formalin) followed by routine processing for paraffin wax embedding. Sections were cut at 5 μm in increments of 300 μm throughout the brain in the axial plane. Sections were subsequently stained with haematoxylin & eosin (H&E) to enable the identification of extravasation of red blood cells at the sites of sonication.
Results
Effect of the Delay Between Cycles
Disruption of the BBB was achieved for all time delays used (6 μs, 60 μs, 300 μs and 600 μs), and for the case of a single cycle per second. Figure 2 shows a contrast enhanced T1w imaged from a single animal showing enhancement at sonication locations for all 8 locations and all time delays. The results are summarized in Table 2. For a few of the sonications at longer time delays, no discernable level of enhancement was detected. Figure 3 shows the mean enhancement for the different time delays, compared with the mean enhancement for the paired control cases of a 6 μs delay. At 60 μs, using a two-tailed paired t-test, no statistically significant difference was found in the enhancement mean (p=0.145). Statistically significant differences in mean were observed at 300 μs, 600 μs and the single cycle case (p=0.033, p=0.016 and p=0.018 respectively). Figure 4 shows a semi-log plot of the enhancement means versus the number of cycles per burst for the five cases. A logarithmic fit is clearly visible from the plotted data.
Fig.2.
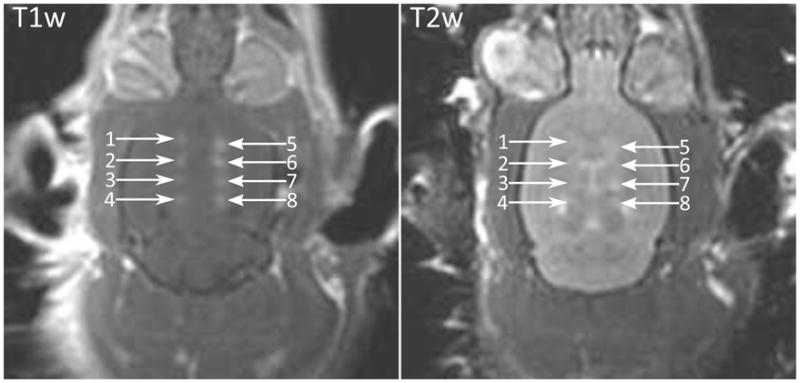
(Left) Contrast enhanced T1w image of a rat brain following BBBD in eight locations. Delay between cycles (1) 300 μs, (2) 600 μs, (3) 1 s, (4) 60 μs, (5–8) 6 μs; (Right) T2w image of same rat brain showing enhancement indicating edema at 8 sonicated locations.
Table 2.
Results from delay between cycles experiment
| Delay | Min. Enhancement | Max. Enhancement | Mean Enhancement | Instances of Edema |
|---|---|---|---|---|
| 6 μs (control) | 5.88% | 82.73% | 26.21 ± 3.41% | 17 (40) |
| 60 μs | 0.00% | 53.54% | 15.20 ± 5.78% | 2 (10) |
| 300 μs | 0.32% | 46.08% | 15.54 ± 4.42% | 4 (10) |
| 600 μs | 0.00% | 45.24% | 13.21 ± 4.52% | 3 (10) |
| 1 s | 1.92% | 26.27% | 9.10 ± 2.44% | 1 (10) |
Fig.3.
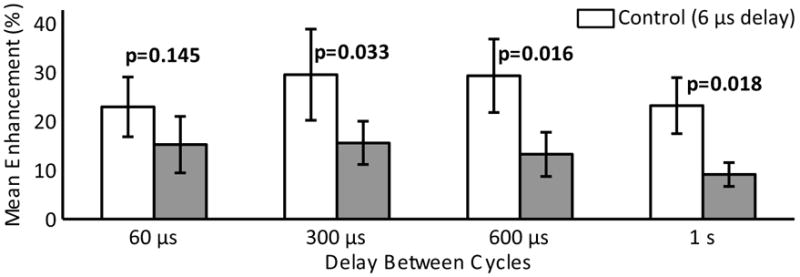
Paired mean contrast enhancement using different delays between excitation cycles. The control case (delay = 6 μs) is shown in white. Error bars indicate the standard deviation on the mean.
Fig.4.
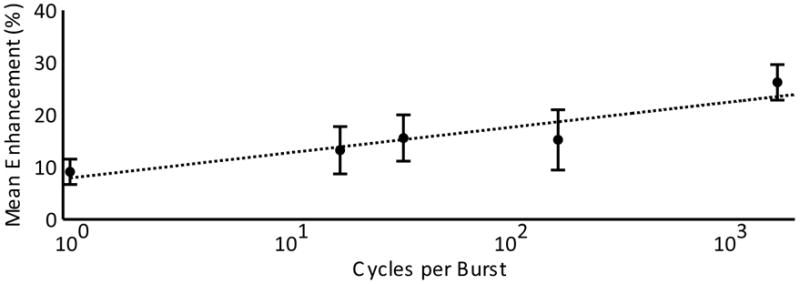
Semi-log plot of mean enhancement versus cycles per burst with a line of best fit shown. Error bars indicate the standard deviation on the mean.
Edema was detected from T2w images for at least one sonication with each delay parameter (Fig.2). Of the 40 control side points, there were 17 possible instances of edema detected on the T2w images. There were 10 possible instances of edema on the non-control sides: 2 at 60μs, 4 at 300 μs, 3 at 600 μs and 1 instance in the single cycle case.
Injection Rate
Opening was observed for all sonications in the injection rate study. In the eight rats used to compare manual bolus with infusion, the mean enhancement from bolus injection was higher than for the previous experiment. This was expected, since enhancement increases with increasing sonication duration [Chopra et al., 2010]. The mean enhancement using bolus injection was 43.4 ± 4.7 %, versus 16.0 ± 1.6 % for the infusion case. Figure 5 shows the paired enhancement data for the bolus and infusion sonications. The use of long infusions seemed to reduce the inter-animal variability in the contrast mean. However, effectiveness of the treatment was reduced, with a lower mean enhancement. Sonications with bolus injections of microbubbles resulted in 28 (32) possible instances of edema, versus 5 (32) possible instances using a slow infusion of microbubbles.
Fig.5.
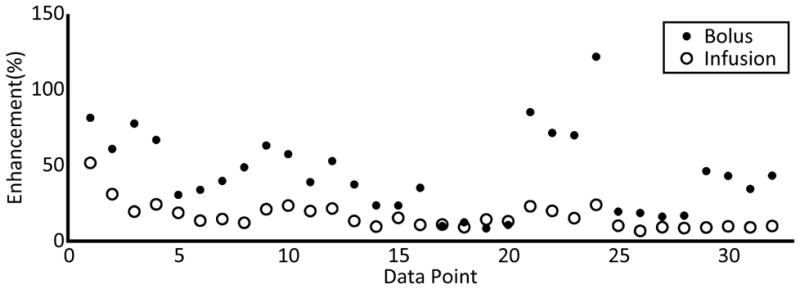
Enhancement values at the bolus and infusion sonication locations
In the six rats used to examine a 15 second automated bolus with a 1 minute infusion and 2, 30 second half dose infusions, no statistical difference was found between the 15 second bolus and either of the longer infusions (p=0.88 and p=0.66, respectively). Figure 6 shows the mean enhancement values for the infusion types.
Fig.6.
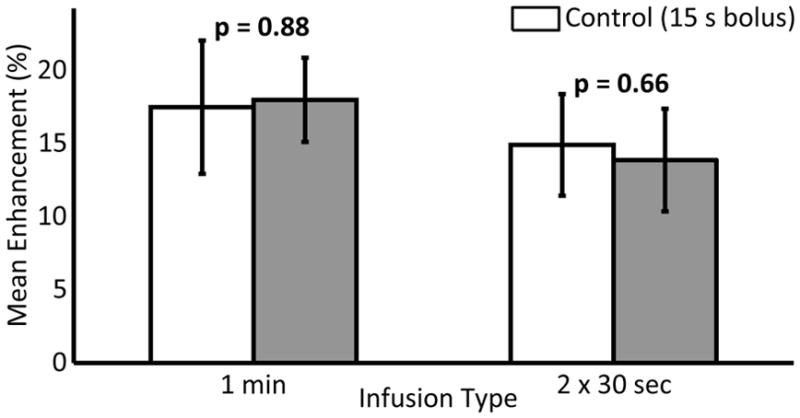
Paired mean enhancement using different infusion types. The control case of a 15 second bolus delivered using an infusion pump is shown in white. Error bars indicate the standard deviation on the mean.
Effect of Pulse Repetition Frequency
The enhancement means measured in the 3 rats (24 sonication locations) used in the PRF study are shown in Figure 7. Paired t-tests found a statistically significant (p = 0.04) reduction in enhancement mean at 0.2 Hz over the control case of a 1 Hz PRF. The mean enhancement at the 2 Hz PRF was higher than at 1 Hz PRF, however no statistical difference was found (p = 0.4).
Fig.7.
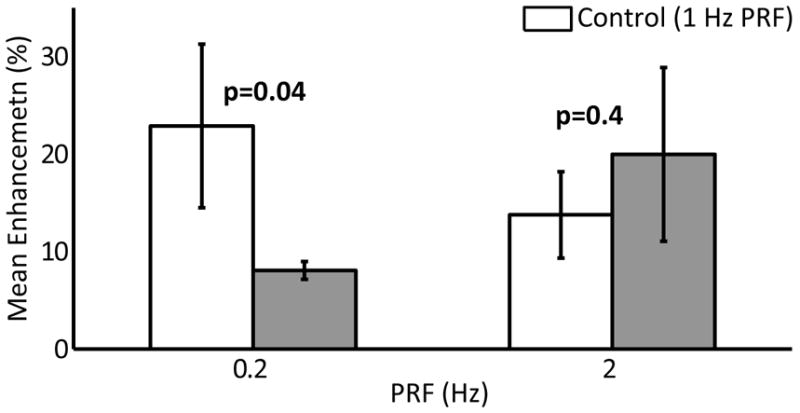
Paired mean enhancement using different burst PRFs. The control case of a 1 Hz PRF is shown in white. Error bars indicate the standard deviation on the mean.
T2W imaging and Histological Analysis
T2w images were captured pre and post sonication and analysed for all 28 rats used in this study. Combining all included sonications for the 28 animals provides data from 214 sonication locations. Figure 8 shows histogram data for all sonications showing the percentage of sonications in each T1w enhancement band. The data is divided into sonications with and without T2w evidence of edema. One sonication exhibiting edema was outside the binned range on the histogram with an enhancement of 121.5% and was excluded from the histogram. No sonications producing T1w enhancement levels above 30% were observed without the T2w indicators of edema.
Fig.8.
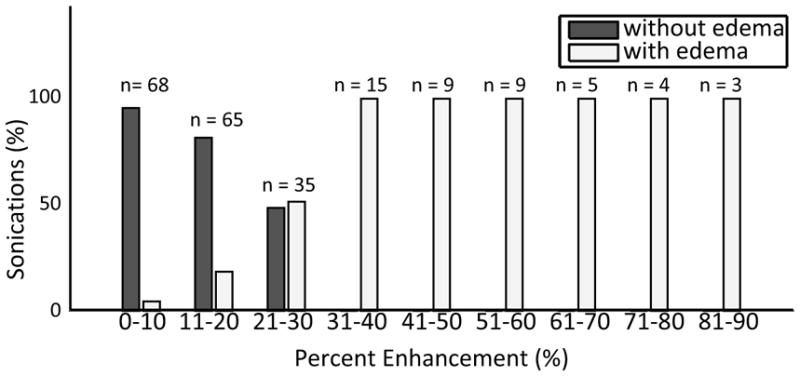
Histogram data for all sonications showing the percentage enhancement T1w enhancement for locations with and without edema. One sonication with edema and T1w enhancement of 121.5% is excluded from the histogram.
Histological examination of the brains showed extravasated red blood cells located at the sonication locations. Figure 9 shows histology from two sonication locations. Sonications producing opening but no T2w enhancement produced little or no evidence of extravasations. No evidence of lesioning or permanent damage to the tissue was detected, although it is not unexpected that such effects would not yet be visible at only 2 hours post-treatment.
Fig.9.
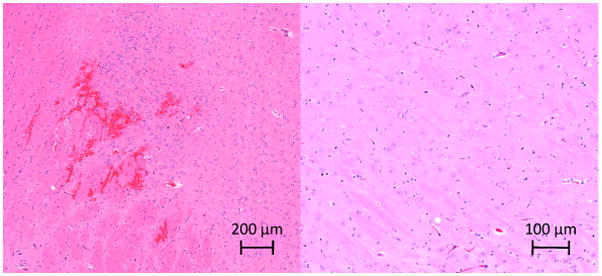
Histology slices from sonication locations in two rats. (Left) Extravasated red blood cells visible near the sonication location for a sonication producing T2w enhancement; (Right) Histology from a sonication location showing T1w enhancement but no T2w enhancement.
Discussion
The BBB was successfully disrupted using single cycle bursts at a 1 Hz PRF, a less than 0.0003% duty cycle. Hynynen et al. [2003] disrupted the BBB in rabbits through a craniotomy window using 10 μs bursts at 1.5 MHz and 1 kHz PRF. However, the BBB was not successfully disrupted at pressures lower than 6.3 MPa, a threshold too high for practical applications in drug delivery due to associated tissue damage. The microbubble contrast agent used in that study was Optison, which has an albumin-shell. Definity, which was used in this study has a phospholipid shell and therefore potentially different behavior when exposed to short sonations at therapeutic pressures. Bing et al., [2009] reported successful disruption of the BBB in mice using short sonations at diagnostic frequencies (5.0 – 8.0 MHz) combined with Definity. However, that study used concentrations ranging from 400 – 2400 μl/kg, 20 to 120 times the maximum recommended dose in humans and frequencies which would prove difficult to implement clinically due to the high attenuation of ultrasound through the skull at frequencies above 1 MHz.
The shortest delay between single cycles, 6 μs, provided the highest mean enhancement level. There were lower percentages of cases which resulted in edema using the longer delay times. However, at least one instance of edema was detected for each delay time, and the shorter delays were unable to achieve the same enhancement levels as the control case without resulting in edema. Post-sonication T2w imaging was performed after gadolinium injection, which could affect T2w images given the short TR (2000 ms) used. Histological anlaysis showed good correlation with T2w imaging results, so most likely this influence was not significant. Therefore, it appears that there is no benefit to treatment outcome or safety in lengthening the delay between cycles. However, short single cycle sonations could be useful to increase throughput in preclinical studies using a multipoint positioning system or in clinical work by allowing more locations to be exposed during single bolus injection of the ultrasound contrast agent. The positioning system presented by Chopra et al., [2009] allows four points to be sonicated in the same amount of time as a single point sonication by utilizing the delay between bursts to sonicate the remaining target locations. The brevity of a single cycle sonation would further improve throughput by allowing more points to be targeted within the 1 second repetition time.
The logarithmic nature of the enhancement mean versus number of cycles per burst data also suggests that a 50% duty cycle as used in the control case need not be exact and that slightly longer delays could be used without sacrificing enhancement. This is supported by failure to find statistically significant difference in the enhancement mean at 60 μs delay (167 cycles) from the 6 μs delay (1667 cycles) control case. Bursts longer than 10 ms, using longer delays between cycles, but a greater number of cycles (e.g. 60 μs delay between cycles and 1667 cycles for a burst length of 100 ms) were not investigated, however Hynynen et al. [2001] reported no difference in enhancement levels between continuous wave bursts of 10 ms and 100 ms. Similarly, no statistical difference was found between enhancement means using 10 ms and 50 ms bursts comprised of single cycles separated by a 5 μs delay [O’Reilly et al., 2010].
Disruption of the BBB with a single excitation cycle per second at reasonable pressures also suggests that the mechanism for BBBD is of a mechanical nature, possibly related to the maximum expansion of the microbubbles in the vasculature or a required pressure to cause nonlinear bubble behavior. This theory would fit well with data from McDannold et al., [2006] which shows a sharp rise in detected harmonic emissions with BBBD.
Decreasing the burst PRF decreased the enhancement mean over the 1 Hz control case. At 2 Hz, their appeared to be a slight improvement in enhancement mean, however without statistical significance. This may indicate that more experiments needs to be performed to investigate the higher repetition frequency sonications. This is contrary to the findings of McDannold et al. [2008b], which showed decreased enhancement at 2 Hz and at 0.5 Hz over a 1 Hz control. The study by McDannold et al. used bolus injection, which could bias results as longer repetition times would produce fewer sonications occurring around the bolus peak, which would counter any positive effects resulting from a longer replenishment time between bursts. This study used infusion, intending to examine only the reperfusion effects and still found no benefit to a low PRF. However, the increasing enhancement level with increasing PRF may be a result of an increasing number of sonications per treatment.
Using a long infusion versus a bolus injection decreased the mean enhancement level. Long infusions seemed to produce more consistent results than manual boluses. However, the pump controlled 15 second bolus and the two fast infusion types did not produce statistically different results and the longer infusion times may be necessary in order to see a significant difference. Infusion and bolus injections were performed injecting the same amount of contrast agent. Therefore, the maximum level of microbubbles circulating in the blood stream during the long infusion would be substantially lower than with a bolus. Since the half-life of Definity is approximately 1.3 minutes in the body (Lantheus Medical Imaging. Package insert. April 2008), a higher dosage of microbubbles could be administered via infusion without exceeding clinical dosage recommendations.
Some inter-animal variability was seen in all the experiments. The control sonications in some animals produced higher enhancement levels than in others. Paired analysis was used for all experiments in order to account for inter-animal variability. Paired locations were selected symmetric about the midline of the skull in order to minimize the effects of intra-animal variations and within experiments each animal received the same number sonications at each of the experimental parameters. When directly comparing results between experiments, the relative values of the control means should be considered. One possible source of variability in the results is variations in skull bone thickness between animals. Younger animals would have thinner skull bones, which could result in an underestimation of in situ pressures. Investigation of the effect of animal size on ultrasound transmission through skull bone could provide useful information for future work. Additionally, intra-animal variations in the controls exist which may be due to local variations in the skull bone thickness.
These results were obtained with one bubble concentration, type and frequency and the BBBD was measured with a small molecule MRI contrast agent. Therefore, the results may be different for different agents and sonication parameters. Therefore these results can be used as a guide for initial experiments but optimal sonication conditions may need to be studied for each therapy molecule and frequency separately.
Conclusion
The blood brain barrier has been disrupted using closely timed 3 μs pulses, at repetitions rates as slow as 1 Hz. Use of such short burst lengths has the potential to decrease treatment times, although no improvement in safety over longer bursts consisting of short pulses was established. Long infusion of microbubbles using an automated syringe pump produced more consistent results than bolus injections, although the mean enhancement decreased. There appears to be no benefit to a PRF of 0.2 Hz or less, however a PRF of 2 Hz may increase enhancement over a 1 Hz PRF when used with infusion microbubble delivery. Higher PRF’s were not investigated. The disruption of the BBB with very short bursts provides new insight into the mechanisms driving ultrasound-mediated BBBD. However, a greater level of treatment control may be necessary to clinically transition the procedure.
Acknowledgments
The authors would like to thank Ping Wu for her technical support, Shawna Rideout-Gros, Alexandra Garces and Dr. Mark Kun Zhang for their help with the animal care, and Anthony Chau for the construction of the MRI-compatible syringe pump. Support for this work was provided by NIH under grants No. EB003268 and No. EB000705 and the Canada Research Chair Program.
Footnotes
Publisher's Disclaimer: This is a PDF file of an unedited manuscript that has been accepted for publication. As a service to our customers we are providing this early version of the manuscript. The manuscript will undergo copyediting, typesetting, and review of the resulting proof before it is published in its final citable form. Please note that during the production process errors may be discovered which could affect the content, and all legal disclaimers that apply to the journal pertain.
References
- Bing KF, Howles GP, Qi Y, Palmeri ML, Nightingale KR. Blood-brain barrier (BBB) disruption using a diagnostic ultrasound scanner and Definity in mice. Ultrasound Med Biol. 2009;35:1298–1308. doi: 10.1016/j.ultrasmedbio.2009.03.012. [DOI] [PMC free article] [PubMed] [Google Scholar]
- Choi JJ, Pernot M, Small SA, Konofagou EE. Noninvasive, transcranial and localized opening of the blood-brain barrier using focused ultrasound in mice. Ultrasound Med Biol. 2007;33:95–104. doi: 10.1016/j.ultrasmedbio.2006.07.018. [DOI] [PubMed] [Google Scholar]
- Choi JJ, Wang S, Tung Y-S, Morrison B, Konofagou EE. Molecules of various pharmacologically-relevant sizes can cross the ultrasound-induced blood-brain barrier opening in vivo. Ultrasound Med Biol. 2010;36:58–67. doi: 10.1016/j.ultrasmedbio.2009.08.006. [DOI] [PMC free article] [PubMed] [Google Scholar]
- Choi JJ, Feshitan JA, Baseri B, Wang S, Tung Y-S, Borden MA, Konofagou EE. Microbubble-size dependence of focused ultrasound-induced blood-brain barrier opening in mice in vivo. IEEE Trans Biomed Eng. 2010;57:145–154. doi: 10.1109/TBME.2009.2034533. [DOI] [PMC free article] [PubMed] [Google Scholar]
- Choi JJ, Selert K, Gao Z, Samiotaki G, Baseri B, Konofagou EE. Noninvasive and localized blood-brain barrier disruption using focused ultrasound can be achieved at short pulse lengths and low pulse repetition frequencies. J Cereb Blood Flow Metab. 2010 doi: 10.1038/jcbfm.2010.155. [DOI] [PMC free article] [PubMed] [Google Scholar]
- Chopra R, Curiel L, Staruch R, Morrison L, Hynynen K. An MRI-compatible system for focused ultrasound experiments in small animal models. Med Phys. 2009;36(5):1867–1874. doi: 10.1118/1.3115680. [DOI] [PMC free article] [PubMed] [Google Scholar]
- Chopra R, Vykhodtseva N, Hynynen K. Influence of exposure time and pressure amplitude on blood-brain-barrier opening using transcranial ultrasound exposures. ACS Chem Neurosci. 2010;1:391–398. doi: 10.1021/cn9000445. [DOI] [PMC free article] [PubMed] [Google Scholar]
- Hynynen K, McDannold N, Vykhodtseva N, Jolesz FA. Noninvasive MR imaging-guided focal opening of the blood-brain barrier in rabbits. Radiology. 2001;220:640–646. doi: 10.1148/radiol.2202001804. [DOI] [PubMed] [Google Scholar]
- Hynynen K, McDannold N, Martin H, Jolesz FA, Vykhodtseva N. The threshold for brain damage in rabbits induced by bursts of ultrasound in the presence of an ultrasound contrast agent (Optison) Ultrasound Med Biol. 2003;29:473–481. doi: 10.1016/s0301-5629(02)00741-x. [DOI] [PubMed] [Google Scholar]
- Jordão JF, Ayala-Grosso CA, Markham K, Huang Y, Chopra R, McLaurin J, Hynynen K, Aubert I. Antibodies targeted to the brain with image-guided focused ultrasound reduces amyloid-beta plaque load in the TgCRND8 mouse model of Alzheimer’s disease. PLoS One. 2010;5:e10549. doi: 10.1371/journal.pone.0010549. [DOI] [PMC free article] [PubMed] [Google Scholar]
- Kinoshita M, McDannold N, Jolesz FA, Hynynen K. Noninvasive localized delivery of Herceptin to the mouse brain by MRI-guided focused ultrasound-induced blood-brain barrier disruption. Proc Natl Acad Sci U S A. 2006;103:11719–11723. doi: 10.1073/pnas.0604318103. [DOI] [PMC free article] [PubMed] [Google Scholar]
- McDannold N, Vykhodtseva N, Hynynen K. Targeted disruption of the blood-brain barrier with focused ultrasound: association with cavitation activity. Phys Med Biol. 2006;51:793–807. doi: 10.1088/0031-9155/51/4/003. [DOI] [PubMed] [Google Scholar]
- McDannold N, Vykhodtseva N, Hynynen K. Use of ultrasound pulses combined with Definity for targeted blood-brain barrier disruption: a feasibility study. Ultrasound Med Biol. 2007;33:584–590. doi: 10.1016/j.ultrasmedbio.2006.10.004. [DOI] [PMC free article] [PubMed] [Google Scholar]
- McDannold N, Vykhodtseva N, Hynynen K. Blood-brain barrier disruption induced by focused ultrasound and circulating preformed microbubbles appears to be characterized by the mechanical index. Ultrasound Med Biol. 2008;34:834–840. doi: 10.1016/j.ultrasmedbio.2007.10.016. [DOI] [PMC free article] [PubMed] [Google Scholar]
- McDannold N, Vykhodtseva N, Hynynen K. Effects of acoustic parameters and ultrasound contrast agent dose on focused-ultrasound induced blood-brain barrier disruption. Ultrasound Med Biol. 2008;34:930–937. doi: 10.1016/j.ultrasmedbio.2007.11.009. [DOI] [PMC free article] [PubMed] [Google Scholar]
- Mesiwala AH, Farrell L, Wenzel HJ, Silbergeld DL, Crum LA, Winn HR, Mourad PD. High-intensity focused ultrasound selectively disrupts the blood-brain barrier in vivo. Ultrasound Med Biol. 2002;28:389–400. doi: 10.1016/s0301-5629(01)00521-x. [DOI] [PubMed] [Google Scholar]
- O’Reilly MA, Huang Y, Hynynen K. Impact of standing wave effects on transcranial focused ultrasound disruption of the blood-brain barrier in a rat model. Phys Med Biol. 2010;55:5251–5267. doi: 10.1088/0031-9155/55/18/001. [DOI] [PMC free article] [PubMed] [Google Scholar]
- Pardridge WM. The blood-brain barrier: bottleneck in brain drug development. NeuroRx. 2005;2:3–14. doi: 10.1602/neurorx.2.1.3. [DOI] [PMC free article] [PubMed] [Google Scholar]
- Sheikov N, McDannold N, Vykhodtseva N, Jolesz F, Hynynen K. Cellular mechanisms of the blood-brain barrier opening induced by ultrasound in presence of microbubbles. Ultrasound Med Biol. 2004;30:979–989. doi: 10.1016/j.ultrasmedbio.2004.04.010. [DOI] [PubMed] [Google Scholar]
- Treat LH, McDannold N, Vykhodtseva N, Zhang Y, Tam K, Hynynen K. Targeted delivery of doxorubicin to the rat brain at therapeutic levels using MRI-guided focused ultrasound. Int J Cancer. 2007;121:901–907. doi: 10.1002/ijc.22732. [DOI] [PubMed] [Google Scholar]
- Yang F-Y, Fu W-M, Chen W-S, Yeh W-L, Lin W-L. Quantitative evaluation of the use of microbubbles with transcranial focused ultrasound on blood-brain-barrier disruption. Ultrason Sonochem. 2008;15:636–43. doi: 10.1016/j.ultsonch.2007.08.003. [DOI] [PubMed] [Google Scholar]